Copyright
©2011 Baishideng Publishing Group Co.
World J Gastroenterol. Apr 28, 2011; 17(16): 2096-2103
Published online Apr 28, 2011. doi: 10.3748/wjg.v17.i16.2096
Published online Apr 28, 2011. doi: 10.3748/wjg.v17.i16.2096
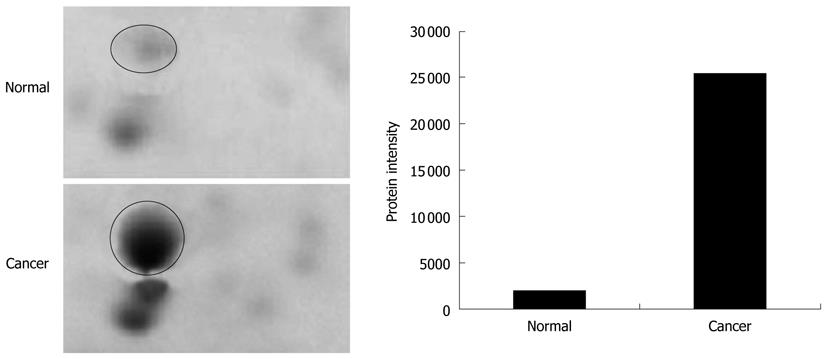
Figure 1 Comparison of protein spot intensity between normal and colorectal cancer tissues for glutathione S-transferase P.
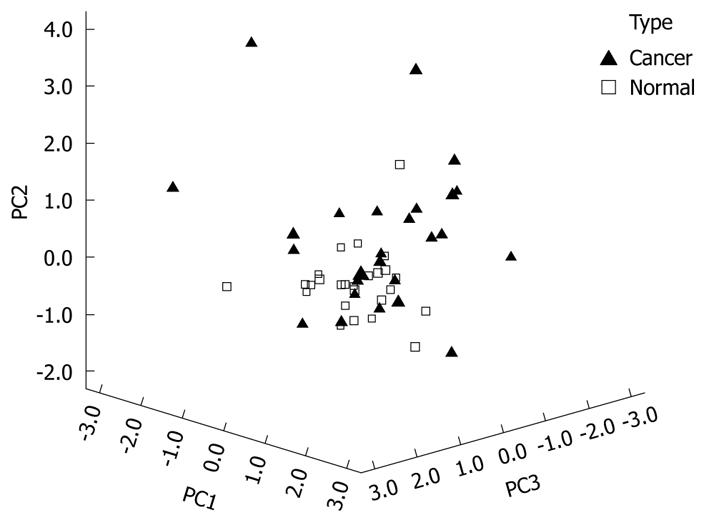
Figure 2 Principal component plot of Tris proteins.
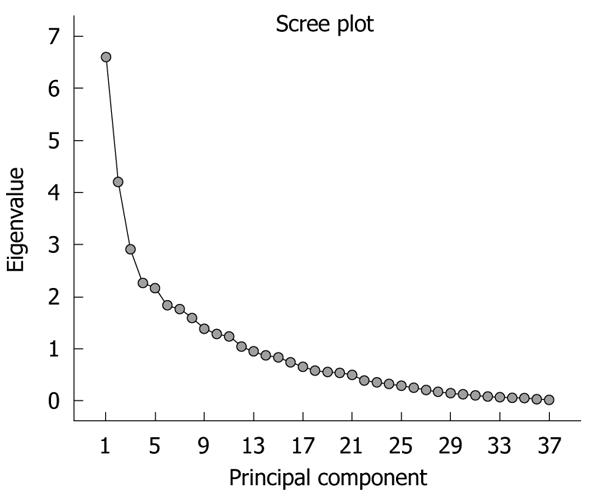
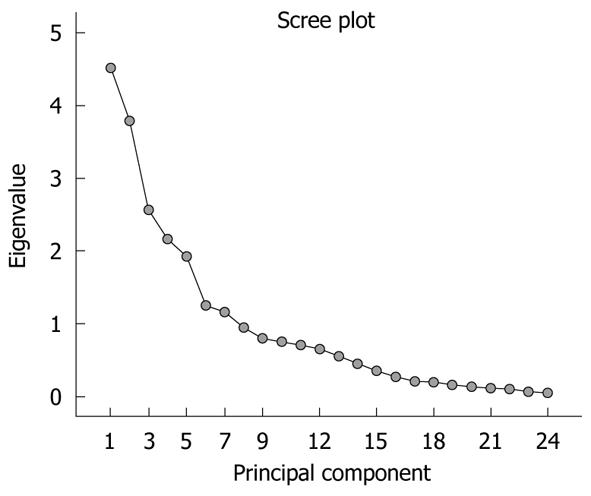
Figure 3 Scree plot showing principal components and their eigenvalues in Tris extracts.
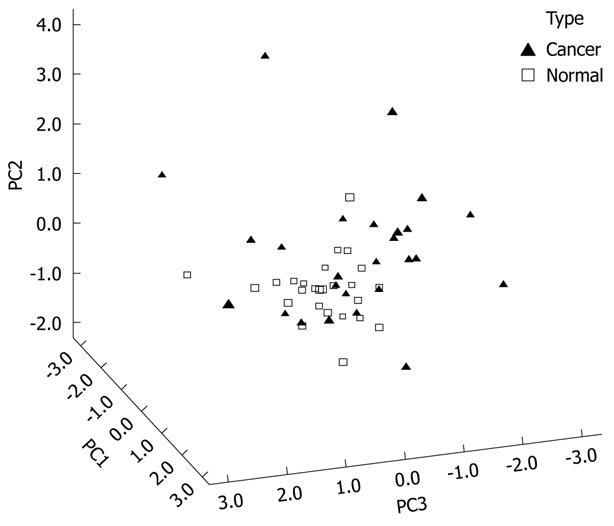
Figure 4 Principal component plot of thiourea lysis buffer proteins.
Figure 5 Scree plot showing principal components and their eigenvalues in thiourea lysis buffer extracts.
- Citation: Yeoh LC, Dharmaraj S, Gooi BH, Singh M, Gam LH. Chemometrics of differentially expressed proteins from colorectal cancer patients. World J Gastroenterol 2011; 17(16): 2096-2103
- URL: https://www.wjgnet.com/1007-9327/full/v17/i16/2096.htm
- DOI: https://dx.doi.org/10.3748/wjg.v17.i16.2096


