Copyright
©2011 Baishideng Publishing Group Co.
World J Gastroenterol. Apr 28, 2011; 17(16): 2086-2095
Published online Apr 28, 2011. doi: 10.3748/wjg.v17.i16.2086
Published online Apr 28, 2011. doi: 10.3748/wjg.v17.i16.2086
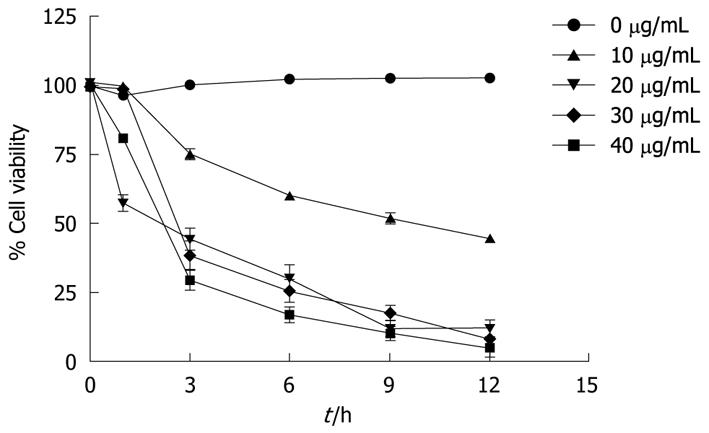
Figure 1 Effect of α-mangostin on the viability of COLO 205 cells.
Different concentrations of α-mangostin (0-40 μg/mL) at different incubation times were studied. Cell viability is expressed as a percentage of the number of viable cells to that of the control, to which no α-mangostin was applied. Each data point shown is the mean ± SD from three independent experiments.
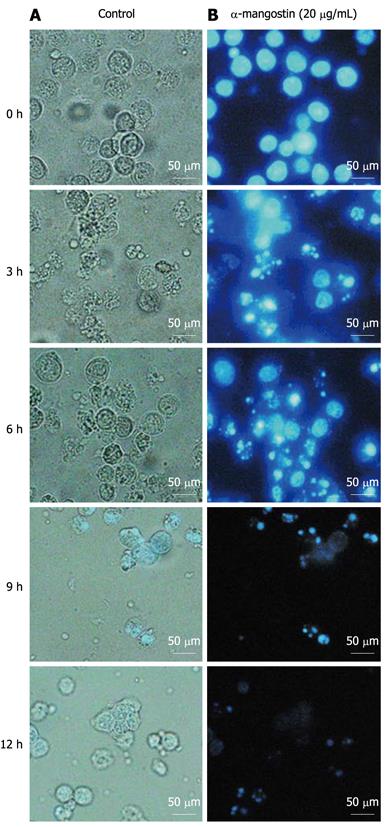
Figure 2 Effect of α-mangostin on the cell morphology and nuclear condensation of COLO 205 cells.
A: Untreated control cells were examined for cell morphology and Hoescht 33342 stained cells were examined for nuclei morphology; B: Cells were cultured for 0, 3, 6, 9 and 12 h in the presence of 20 μg/mL α-mangostin.
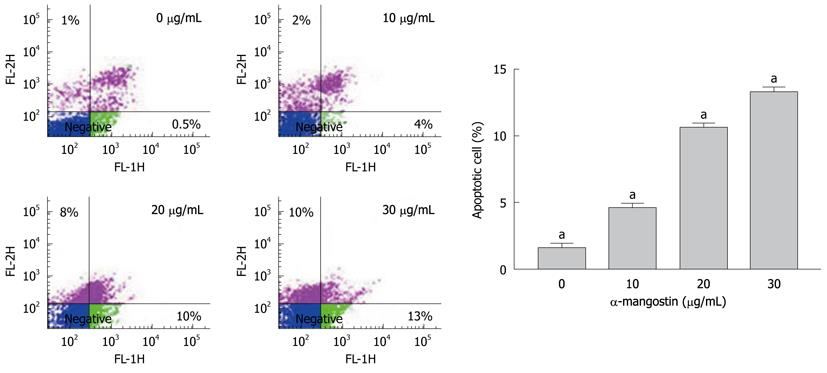
Figure 3 Fluorescent-activated cell sorter analysis of COLO 205 cells stained with Annexin V-FITC.
Cells were treated with 10, 20 and 30 μg/mL α-mangostin for 3 h. α-mangostin induced early apoptosis in a concentration dependent manner. The values are expressed as mean ± SD; aP < 0.05.
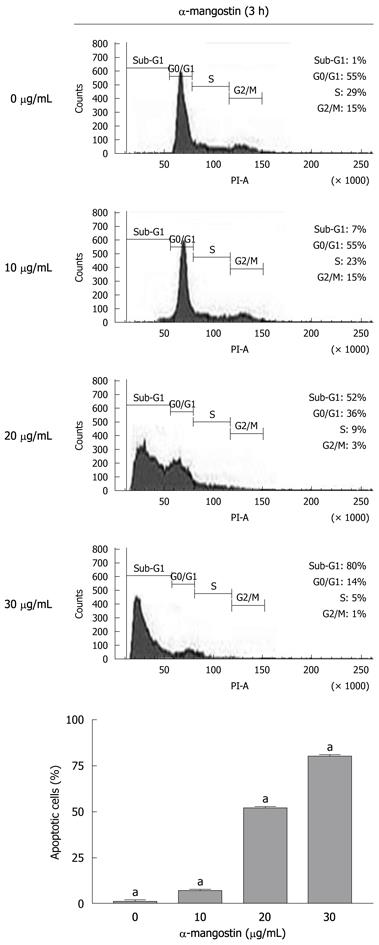
Figure 4 Flow analysis of cell cycle.
Representative plots of PI staining of COLO 205 cells that were treated with 0 (control), 10, 20 and 30 μg/mL α-mangostin for 3 h. The values are expressed as mean ± SD; aP < 0.05.
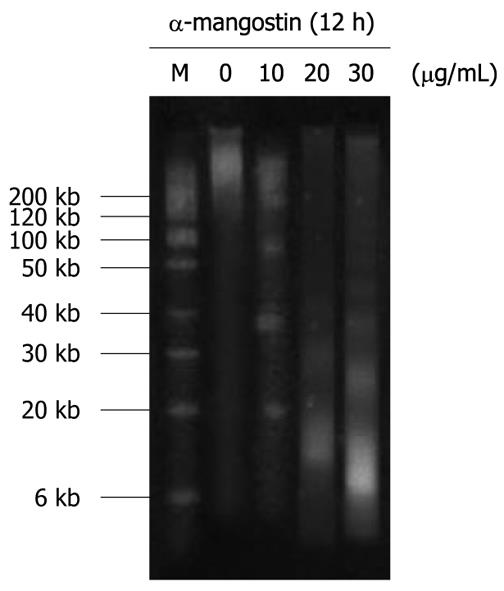
Figure 5 Analysis of DNA integrity in COLO 205 cells upon treatment with α-mangostin.
COLO 205 cells were treated with varying concentrations of α-mangostin (10, 20 and 30 μg/mL) for 12 h. Cells were lysed, followed by phenol-chloroform extraction. DNA fractions were then electrophoresed on 1.8% agarose gels. DNA was stained with ethidium bromide and visualized under a UV light trans-illuminator.
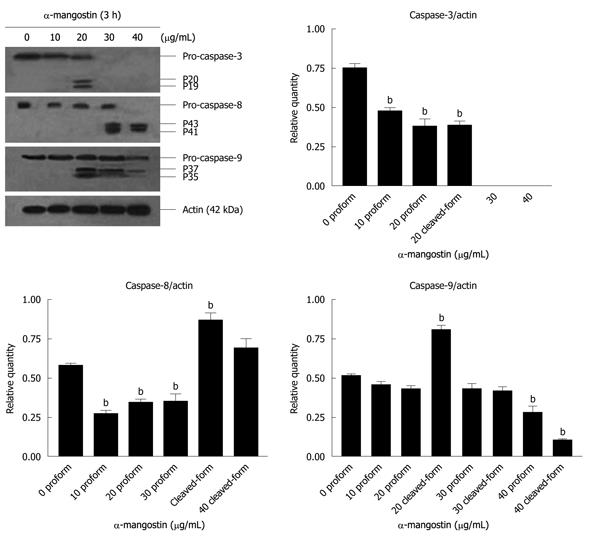
Figure 6 Effects of α-mangostin on the activation of caspase-3, -8 and -9 in COLO 205 cells.
Cells were treated with 10, 20, 30 and 40 μg/mL α-mangostin for 3 h. Cell lysates were separated by SDS-PAGE using 12% polyacrylamide gels. Proteins were subjected to immuno-detection of caspases-3, -8, and -9 using appropriate anti-caspase antibodies at 4°C. The expression of cleaved-caspase-3, -8 and -9 were detected. The density of each band was determined, equal protein loading was verified by β-actin staining. The values are expressed as mean ± SD; bP < 0.01.
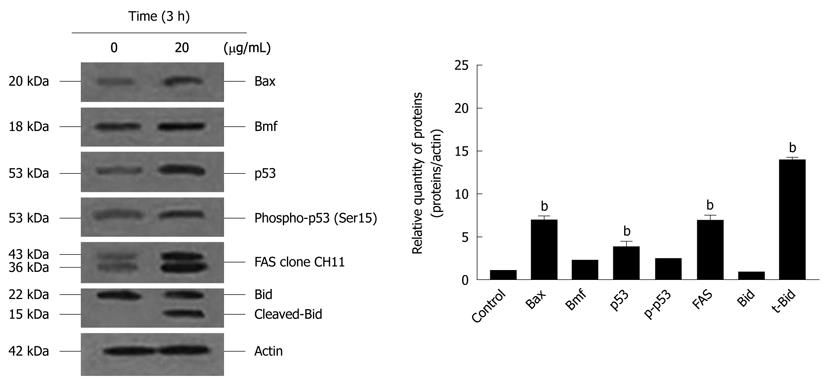
Figure 7 Effects of α-mangostin on the activation of Bax, Bmf, p53, Fas and Bid.
Cells were treated with 20 μg/mL α-mangostin for 3 h. Cell lysates were separated by SDS-PAGE using 12% polyacrylamide gels. Proteins were subjected to immuno-detection of Bax, Bmf, p53, p-p53, Fas, Bid and t-Bid using appropriate antibodies. The density of each band was determined, equal protein loading was verified by β-actin staining. The values are expressed as mean ± SD; bP < 0.01.
Figure 8 Release of cytochrome c from the mitochondria in COLO 205 cells.
Upon treatment with 20 μg/mL α-mangostin for 3, 6 and 9 h, cytosol fractions were prepared from these cells and separated by SDS-PAGE using 12% polyacrylamide gels. Proteins were subjected to immuno-detection of cytochrome c using a mouse monoclonal antibody against human cytochrome c. The density of each band was determined, equal protein loading was verified by β-actin staining. The values are expressed as mean ± SD; aP < 0.05.
Figure 9 Measurements of mitochondrial membrane depolarization in COLO 205 cells.
Cells were treated with 0 (control) and 20 μg/mL α-mangostin for 3h and then incubated with JC-1 (10 μg/mL in PBS) at 37°C for 10 min. Stained cells were subjected to FACS analysis. The mitochondrial function was assessed as JC-1 green. The values are expressed as mean ± SD; aP < 0.05.
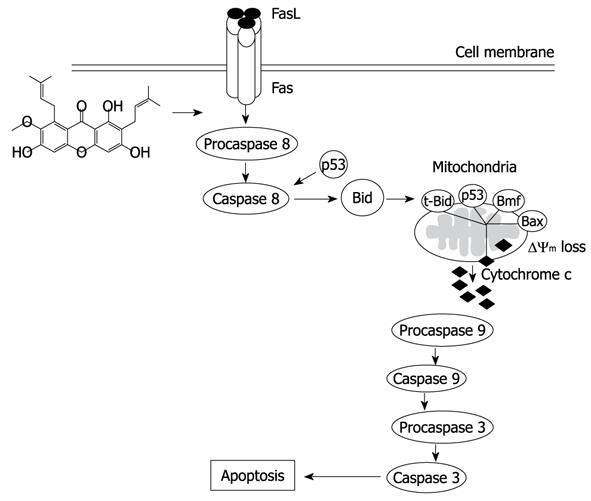
Figure 10 A proposed diagram for α-mangostin-induced apoptosis in COLO 205 cells.
Upon α-mangostin treatment, extrinsic pathway was activated, procaspase-8 was cleaved to caspase-8 which then further activated the cleavage of Bid to t-Bid. The t-Bid then translocates to mitochondria resulting in the activation of mitochondrial apoptotic pathway.
- Citation: Watanapokasin R, Jarinthanan F, Nakamura Y, Sawasjirakij N, Jaratrungtawee A, Suksamrarn S. Effects of α-mangostin on apoptosis induction of human colon cancer. World J Gastroenterol 2011; 17(16): 2086-2095
- URL: https://www.wjgnet.com/1007-9327/full/v17/i16/2086.htm
- DOI: https://dx.doi.org/10.3748/wjg.v17.i16.2086


