Copyright
©2011 Baishideng Publishing Group Co.
World J Gastroenterol. Apr 21, 2011; 17(15): 1947-1960
Published online Apr 21, 2011. doi: 10.3748/wjg.v17.i15.1947
Published online Apr 21, 2011. doi: 10.3748/wjg.v17.i15.1947
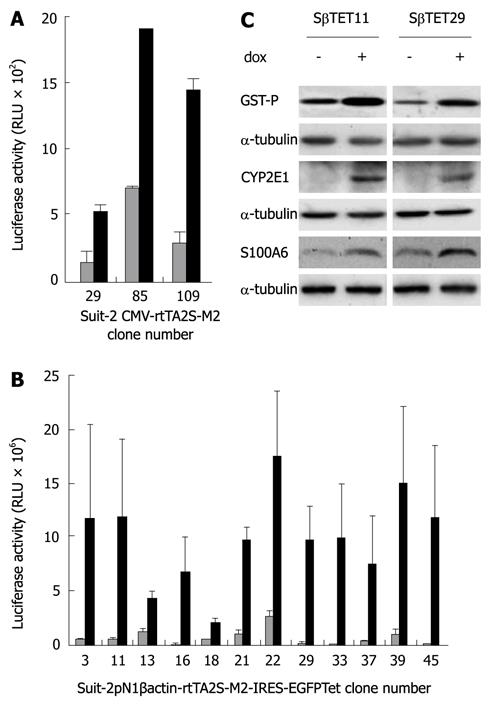
Figure 1 Identification of clones transfected with CMV-rtTA2S-M2 or pN1βactin-rtTA2S-M2-IRES-EGFP-SUIT-2 cell clones.
Suit-2 cells were transfected with CMV-rtTA2S-M2 (A) or pN1βactin-rtTA2S-M2-IRES-EGFP (B) and stable clones selected using 300 μg/mL G418. Clones were isolated and transfected with pTRE2hygluc, used as an indirect measure of rtTA activity. Cells were treated for 24 h with 500 ng/mL doxycycline (black bars) or an equivalent volume of PBS (white bars), and luciferase activity measured in 50 μg protein (1 mg/mL protein; 50 μL was assayed per sample). Error bars represent standard errors for three experiments. C: Cells were transiently transfected with pTRE2hygGST-P, pTRE2hygCYP2E1, and pTRE2hygS100A6 and treated with 500 ng/mL doxycycline or PBS as control for 24 h. Protein lysates were prepared and subjected to Western Blotting using anti-GST-P, CYP2E1 and S100A6 antibodies. α-tubulin was used as a loading control.
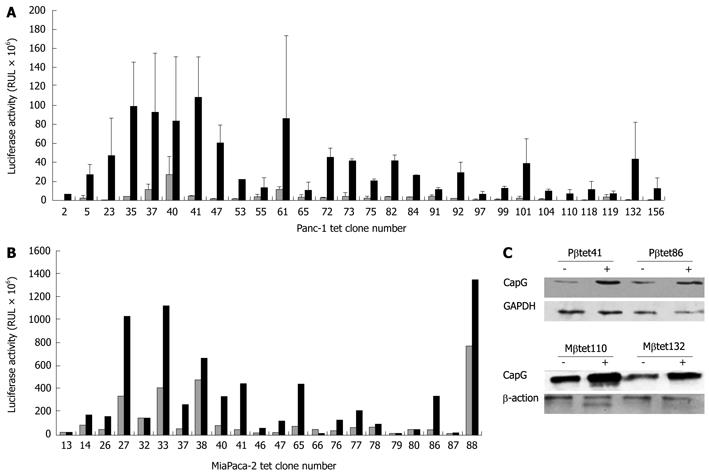
Figure 2 Identification of stable pN1βactin-rtTA2S-M2-IRES-EGFP- expressing Panc-1 (A) and MiaPaca (B) cell clones and their functionality (C).
Panc-1 and MiaPaca cells were transfected with pN1βactin-rtTA2S-M2-IRES-EGFP and stable expressors selected using 300 μg/mL G418. Clones were isolated and transfected with pTRE2hygluc, used as an indirect measure of rtTA activity. Cells were treated for 24 h with 500 ng/mL doxycycline (black bars) or an equivalent volume of PBS (white bars) and luciferase activity measured in 50 μg protein (1 mg/mL protein; 50 μL was assayed per sample). A: 90 G418 resistant clones were isolated from Panc-1 cells, of which 25% showed > 5-fold increase in luciferase activity in the stimulated (black bars in Figure 1) compared to the unstimulated (white bars in Figure 1) condition; B: Of 170 G418-resistant cells identified in MiaPaCa-2 cells, 60% showed > 5-fold increase in luciferase expression; C: Two stable pN1βactin-rtTA2S-M2-IRES-EGFP Panc-1 (Pβtet41 and Pβtet86) and MiaPaCa-2 (Mβtet110and Mβtet132) cell lines were transiently transfected with the pTRE2hygCapG vector and treated for 24 h with or without 500 ng/mL doxycycline. Cell lysates was subjected to Western Blotting for the detection of CapG. β-actin and GAPDH were used as loading controls, respectively. Tet: Tetracycline.
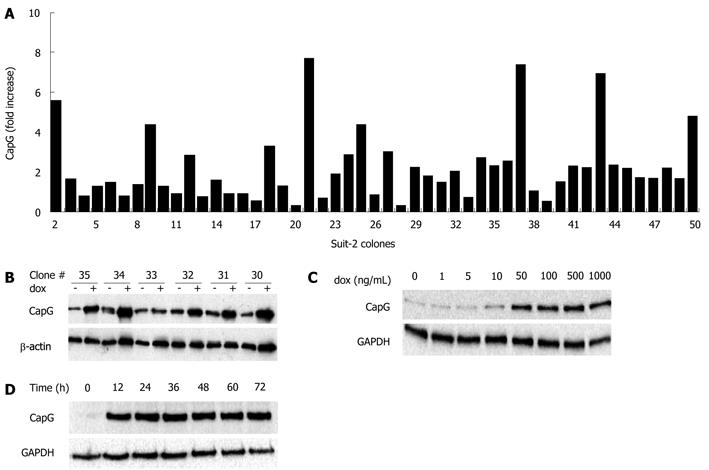
Figure 3 Selection (A, B) and inducibility (C, D) of stably-transfected Sβtet29Cap clones.
The stable Sβtet29 clone was transfected with the pTRE2hygCapG full size vector and clones selected with hygromycin B (200 μg/mL). A: Individual clones (n = 49) were induced with 500 ng/mL doxycycline for 24 h and the protein lysate subjected to Western blotting. The CapG level was calculated for each individual clone in the non-induced and the induced state. The fold increase (normalised to actin) in CapG for each of the 49 clones is shown in the bar chart; B: A representative Western blotting for CapG is shown for pTRE2hygCapG clones 30 to 35. The indicates the basal CapG expression, + doxycycline (dox) induced; C: The inducibility of CapG protein expression was investigated by treating the Sβtet29Cap35 cells with 0, 1, 5, 10, 50, 100, 500, 1000 ng/mL dox for 24 h. The resulting Western blotting for CapG and GAPDH as a loading control is shown; D: The Western blotting represents the CapG protein level of Sβtet29Cap35 cells, induced with 500 ng/mL doxycycline for 0, 12, 24, 36 and 48 h. GAPDH was used as a loading control.
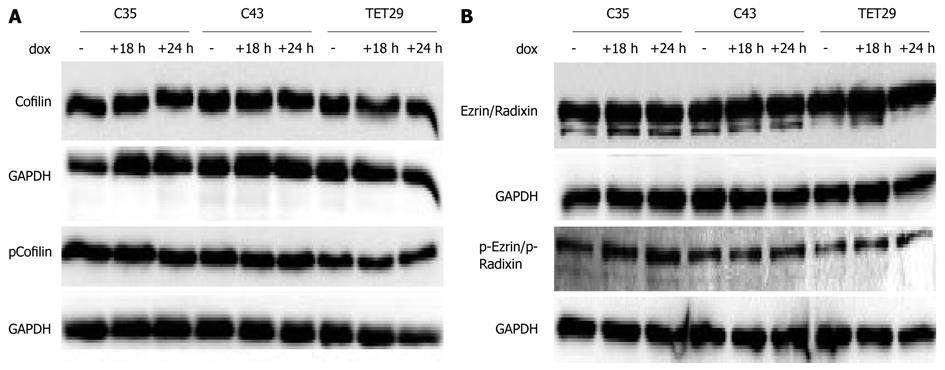
Figure 4 The effects of CapG overexpression on Cofilin and Ezrin/Radixin levels and phosphorylation status.
Sβtet29Cap35 (C35), Sβtet29Cap43 (C43) and control Sβtet29 (TET29) cells were incubated with dox (500 ng/mL) for the indicated times and lysates assayed by Western blotting for changes in the levels of Cofilin (A) and Ezrin/Radixin (B) and phospho-Cofilin (A) and phosphor-Ezrin/Radixin (B).
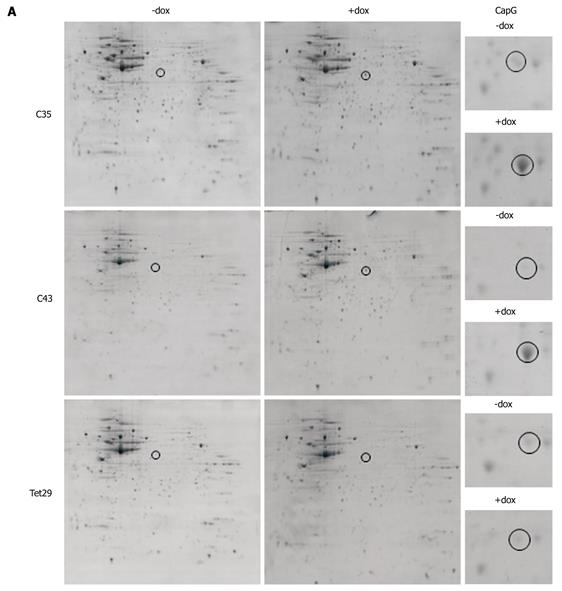
Figure 5 Two-dimensional gel analysis of stable inducible CapG overexpressing cells.
A: Colloidal Coomassie Blue stained gels displaying the proteome of Sβtet29Cap35 (C35), Sβtet29Cap43 (C43) and control Sβtet29 (TET29) cells. Cells were lysed in their uninduced state (- dox) and 18 h after treatment with 500 ng/mL doxycycline (+ dox). The area around the spot representing CapG (black circle) was magnified in the right hand column (CapG); B: The spot representing CapG was excised from the gels, trypsin digested, and analysed by Maldi-Tof. The sequence is shown and peptides identified by Maldi are bold and underlined.
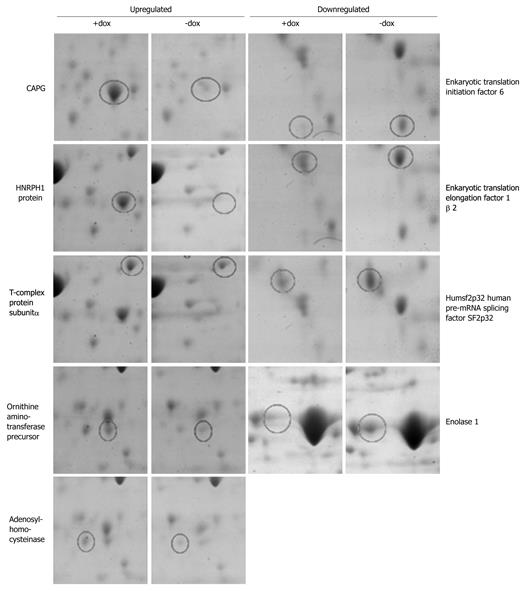
Figure 6 Two-dimensional gel analysis shows up- or downregulation of proteins associated with CapG overexpression.
Coomassie Blue stained gel insets displaying proteins found to be up- or downregulated in Sβtet29Cap35 (C35), Sβtet29Cap43 (C43) but not in control Sβtet29 (TET29) cells, following treatment for 18 h with 500 ng/mL doxycycline (+dox). Spots were excised from the gels, trypsin digested, and analysed by Maldi-Tof, leading to the identification of proteins.
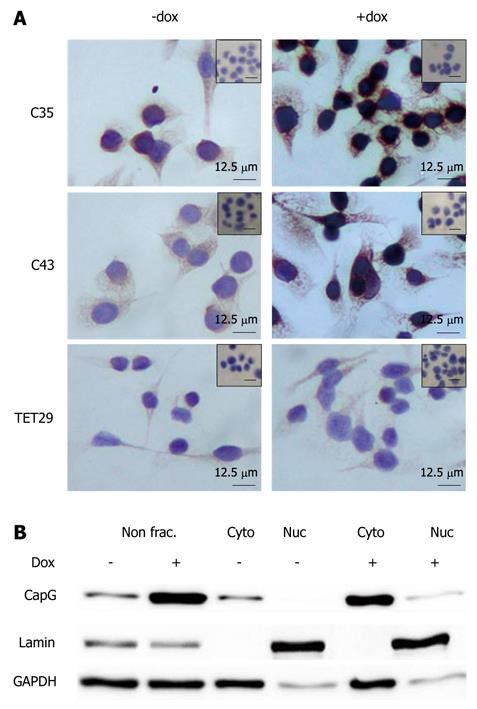
Figure 7 Subcellular localization of CapG in stable CapG inducible clones by immunohistochemistry (A) and subcellular fractionation (B).
A: CapG protein expression and localization in Sβtet29Cap35 (C35), Sβtet29Cap43 (C43) and the control Sβtet29 (TET29) cells was analyzed 24 h after treatment with 500 ng/ml doxycycline (+ dox) or PBS as control (- dox). Specific antibody reaction (anti-CapG) was visualized by a peroxidase labelled secondary antibody (DAB detection, brown colour). Nuclei were counterstained with hematoxylin (blue colour). Bars = 12.5 μm. B. Whole protein lysate (non frac.) or enriched nuclear (Nuc) and cytoplasmic (Cyto) fractions of Sβtet29Cap35, Sβtet29Cap43 and the control Sβtet29 clones 24 h after treatment with 500 ng/mL doxycycline (+) or PBS as control (-) were analysed using Western blotting for the detection of CapG, Lamin (marker for nuclear fraction) and GAPDH (marker for cytoplasmic fraction). The experiment was performed three times. A representative Western blot of Sβtet29Cap35 is shown.
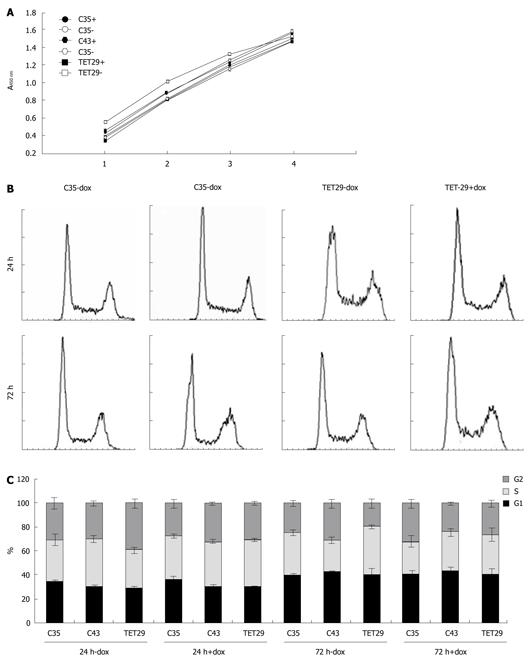
Figure 8 Cell proliferation (MTS-assay) (A) and cell cycle analysis (B) of doxycycline induced CapG overexpressing cells.
A: Sβtet29Cap35 (C35), Sβtet29Cap43 (C43) and the control Sβtet29 (TET29) cells were treated with 500 ng/mL doxycycline (+) or PBS as control (-) for 48 h. Mitochondrial activity was measured with the EZ4U assay and absorbance measured 1 h, 2 h, 3 h, and 4 h after substrate incubation. The experiment was performed three times with at least ten replicates; B: Sβtet29Cap35 (C35), Sβtet29Cap43 (C43) and the control Sβtet29 (TET29) cells were treated with 500 ng/ml doxycycline (+) or PBS as control (-) for 24 h and 72 h. The cells were propidium iodide stained and FACS analyzed. 10 000 cells were measured and the experiment was performed in triplicate with three replicates each. A representative chart for the cell cycle of C35 and TET29 cells is presented; C: The graphics represent the average percentage (± SE) of cells in G1, G2, and S phase in the different experimental conditions.
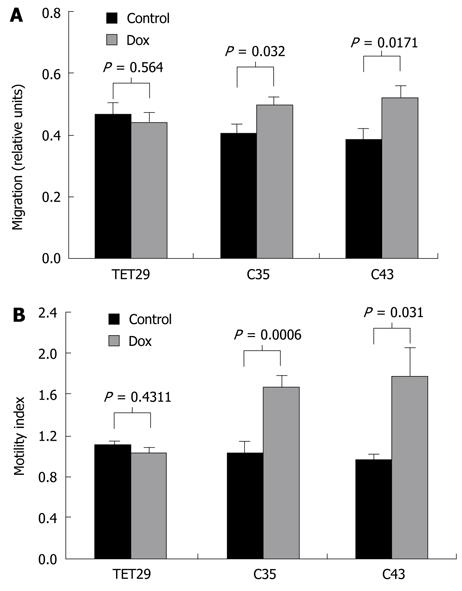
Figure 9 Wound healing capacity (A) and motility (B) of CapG-overexpressing cells.
A: Bars represent the migration in relative units for Sβtet29Cap35 (C35), Sβtet29Cap43 (C43) and the control Sβtet29 (TET29) cells treated with doxycycline (dox, grey bar) or PBS (Control, black bar). Error bars present the SE for three experiments carried out in triplicate; B: The motility investigated by a Boyden Chamber assay of Sβtet29Cap35 (C35), Sβtet29Cap43 (C43) and the control Sβtet29 (TET29) cells treated with doxycycline (dox, gray bar) or PBS (Control, black bar) is shown. Each experiment was performed in triplicate with three replicates.
- Citation: Tonack S, Patel S, Jalali M, Nedjadi T, Jenkins RE, Goldring C, Neoptolemos J, Costello E. Tetracycline-inducible protein expression in pancreatic cancer cells: Effects of CapG overexpression. World J Gastroenterol 2011; 17(15): 1947-1960
- URL: https://www.wjgnet.com/1007-9327/full/v17/i15/1947.htm
- DOI: https://dx.doi.org/10.3748/wjg.v17.i15.1947


