Copyright
©2011 Baishideng Publishing Group Co.
World J Gastroenterol. Apr 7, 2011; 17(13): 1718-1724
Published online Apr 7, 2011. doi: 10.3748/wjg.v17.i13.1718
Published online Apr 7, 2011. doi: 10.3748/wjg.v17.i13.1718
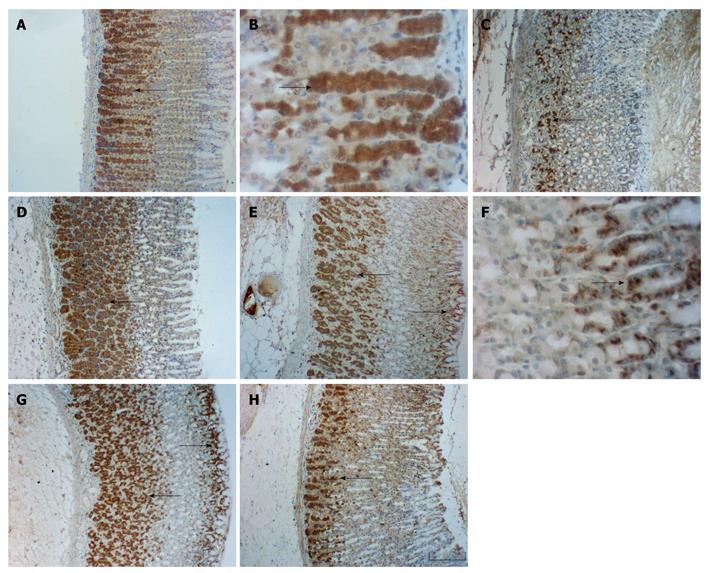
Figure 1 Histological exhibition of Bcl-2 and Bax positive cells in the gastric mucosa at different reperfusion times after ischemia, by immunohistochemical staining in rats.
The Bcl-2 and Bax positive cells were respectively probed with anti-Bcl-2 and anti-Bax polyclonal antibodies in rat gastric mucosa. Nuclear counterstaining was performed with hematoxylin. The examples of immunoreactive cells are those with dark brown staining in their cytosol (arrows). A and B: Bcl-2, control; C: Bcl-2, GI-R at 1 h after reperfusion; D: Bcl-2, GI-R at 24 h after reperfusion; E and F: Bax, control; G: Bax, GI-R at 1 h after reperfusion; H: Bax, GI-R at 24 h after reperfusion. Images were obtained at × 100 (A, C, D, E, G and H, Bar 100 μm) and × 400 (B and F, Bar 400 μm).
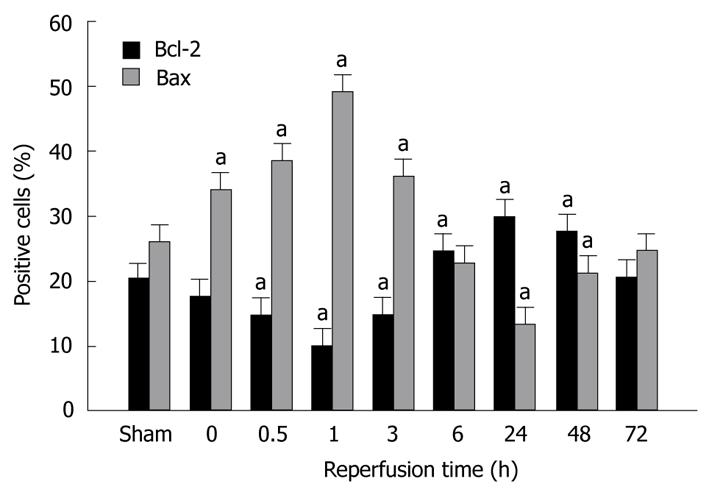
Figure 2 Quantitative changes in Bcl-2 and Bax positive cells in rat gastric mucosa for different reperfusion times after GI-R.
Reperfusion was maintained for 0, 0.5, 1, 3, 6, 24, 48 and 72 h after 30 min of ischemia. Sham: sham-operated. Values are percentage of positive cells (positive cells/total cells) counted in 10 microscopic fields. Each column represents mean ± SD, n = 6. aP < 0.05 vs sham.
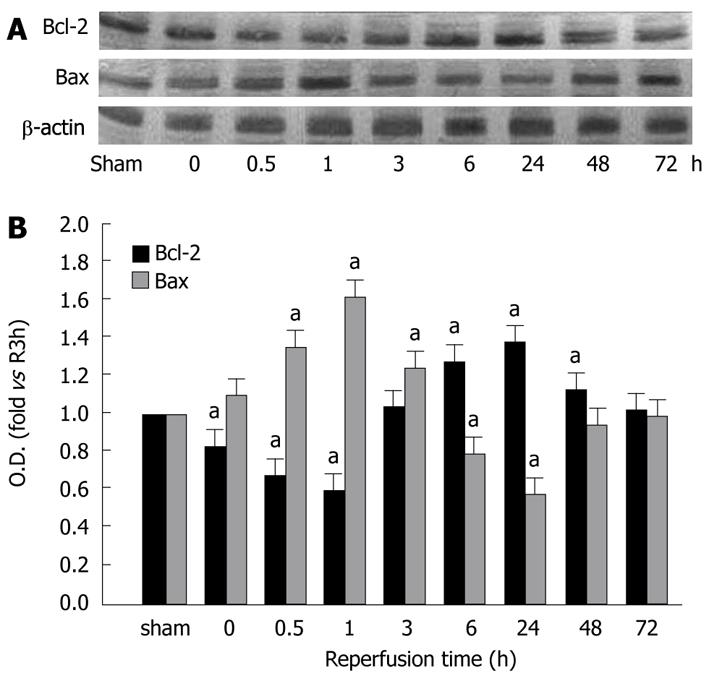
Figure 3 Expression of Bcl-2 and Bax proteins in cytoplasm extracts from rat gastric mucosa for different reperfusion durations after gastric ischemia-reperfusion.
Extracts were obtained from sham-operated rats or from gastric ischemia-reperfusion rats with different reperfusion durations (0, 0.5, 1, 3, 6, 24, 48, or 72 h) after 30 min of ischemia, and were analyzed respectively by western blotting with anti-Bcl-2 and anti-Bax antibodies. A: Representative blots corresponding to expression levels of Bcl-2 and Bax proteins; B: Semi-quantitative analysis of the levels of Bcl-2 and Bax. Sham: Sham-operated. Values are means ± SD, n = 6. aP < 0.05 vs sham.
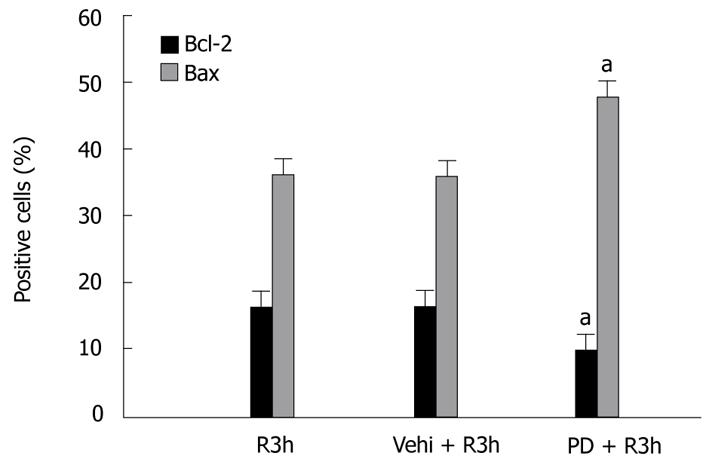
Figure 4 Effects of PD98059 (ERK1/2 inhibitor) on quantitative changes of Bcl-2 and Bax positive cells in rat gastric mucosa after gastric ischemia-reperfusion.
R3h: Reperfusion for 3 h after 30 min of ischemia; Vehi + R3h: Vehicle + R3h; PD + R3h: PD98059 + R3h; Sham: Sham-operated. Values are percentage of positive cells (positive cells/total cells) counted in 10 microscopic fields. Each column represents mean ± SD, n = 6. aP < 0.05 vs R3h.
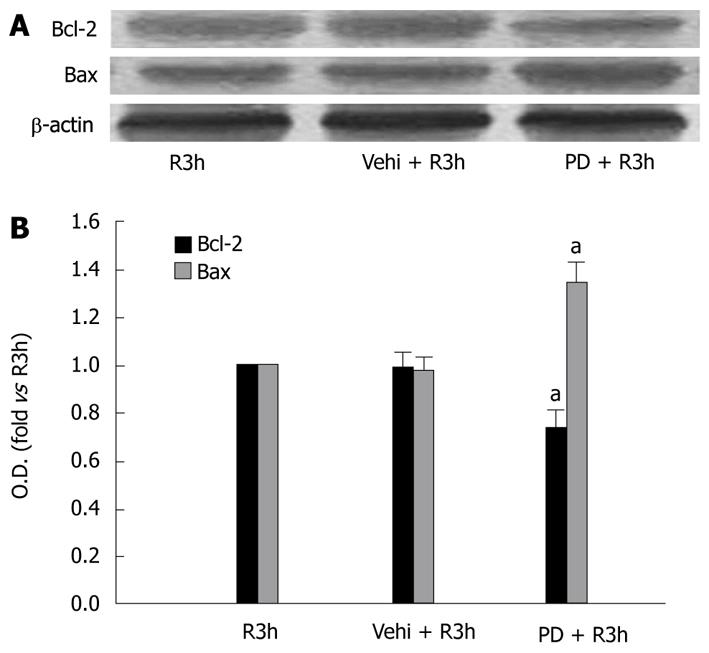
Figure 5 Effects of PD98059 (ERK1/2 inhibitor) on expression of Bcl-2 and Bax proteins in cytoplasm extracts from rat gastric mucosa after gastric ischemia-reperfusion.
R3h: Reperfusion for 3 h after 30 min of ischemia; Vehi + R3h: Vehicle + R3h; PD + R3h: PD98059 + R3h. Extracts were obtained for analysis by western blotting with anti-Bcl-2 and anti-Bax antibodies. A: Representative blots corresponding to expression levels of Bcl-2 and Bax proteins; B: Semi-quantitative analysis of the levels of Bcl-2 and Bax. Values are means ± SD, n = 6. aP < 0.05 vs R3h.
- Citation: Qiao WL, Wang GM, Shi Y, Wu JX, Qi YJ, Zhang JF, Sun H, Yan CD. Differential expression of Bcl-2 and Bax during gastric ischemia-reperfusion of rats. World J Gastroenterol 2011; 17(13): 1718-1724
- URL: https://www.wjgnet.com/1007-9327/full/v17/i13/1718.htm
- DOI: https://dx.doi.org/10.3748/wjg.v17.i13.1718


