Copyright
©2011 Baishideng Publishing Group Co.
World J Gastroenterol. Apr 7, 2011; 17(13): 1710-1717
Published online Apr 7, 2011. doi: 10.3748/wjg.v17.i13.1710
Published online Apr 7, 2011. doi: 10.3748/wjg.v17.i13.1710
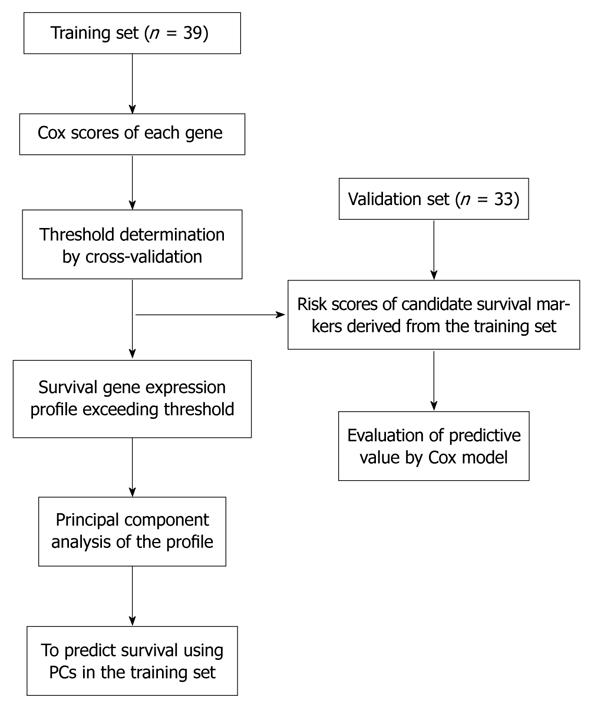
Figure 1 Overview of the strategy used for the development and validation of prognostic markers.
Figure 2 Overall survival curves and the expression profile of the ten-gene prognostic marker in the training dataset.
A: The gene expression pattern of the ten-gene prognostic marker. Nine genes were associated with the prolonged survival and one gene with poor survival. Red, high expression; green, low expression; B: Kaplan-Meier survival curves based on the expression profile of the ten-gene prognostic marker; C: Overall survival curves according to the tumor-node-metastasis stages.
Figure 3 Overall survival curves and the expression profile of the ten-gene prognostic marker in the validation dataset.
A: The gene expression pattern of the ten-gene prognostic marker. Red, high expression; green, low expression; B: Kaplan-Meier survival curves based on the expression profile of the ten-gene prognostic marker; C: Overall survival curves according to the tumor-node-metastasis stages.
- Citation: Zhang YZ, Zhang LH, Gao Y, Li CH, Jia SQ, Liu N, Cheng F, Niu DY, Cho WC, Ji JF, Zeng CQ. Discovery and validation of prognostic markers in gastric cancer by genome-wide expression profiling. World J Gastroenterol 2011; 17(13): 1710-1717
- URL: https://www.wjgnet.com/1007-9327/full/v17/i13/1710.htm
- DOI: https://dx.doi.org/10.3748/wjg.v17.i13.1710


