Copyright
©2011 Baishideng Publishing Group Co.
World J Gastroenterol. Apr 7, 2011; 17(13): 1694-1700
Published online Apr 7, 2011. doi: 10.3748/wjg.v17.i13.1694
Published online Apr 7, 2011. doi: 10.3748/wjg.v17.i13.1694
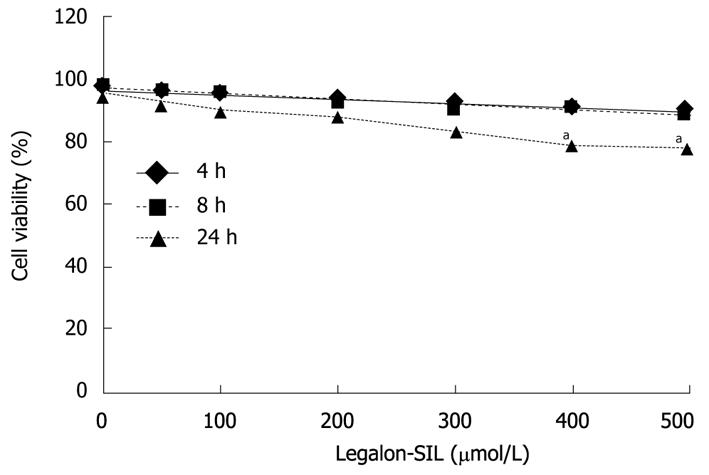
Figure 1 Effects of legalon-SIL on CON1 cell viability.
Cellular viability of CON1 cells was measured using the propidium iodide assay after 4, 8, and 24 h of exposure to legalon-SIL (LS) at varying concentrations ranging from 0-500 μm/L. The mean ± SE from 3 independent experiments. aP < 0.05 vs DMSO control.
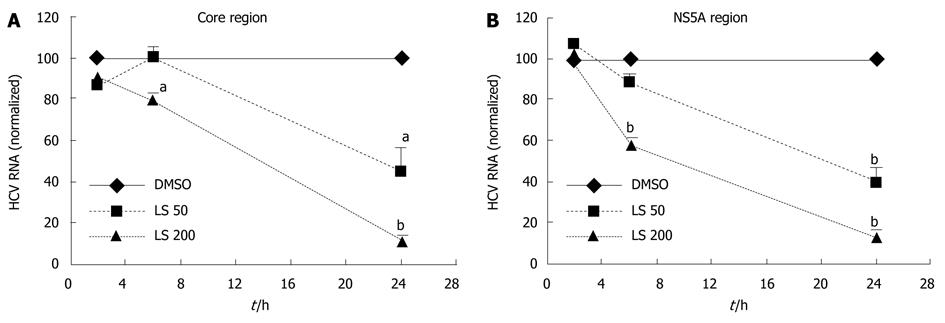
Figure 2 Time course of effects of legalon-SIL on hepatitis C virus RNA in CON1 cells.
CON1 cells were grown to near confluence and the medium was changed to 5% fetal bovine serum (FBS) plus Dulbecco’s modified Eagle’s medium, then treated with vehicle only (DMSO) or 50 or 200 μmol/L legalon-SIL (LS). The cells were harvested after 2, 6, and 24 h after treatment. The levels of hepatitis C virus (HCV) RNA [core region (A) and NS5A region (B)] were quantified using qRT-PCR as described in “Materials and Methods”. The amounts of HCV RNA were normalized to glyceraldehyde-3-phosphate dehydrogenase. A: LS 50 μmol/L downregulated HCV RNA (core region) after 24 h. LS 200 μmol/L downregulated HCV RNA (core region) after 6 and 24 h; B: LS 50 μmol/L downregulated HCV RNA (NS5A region) after 24 h. LS 200 μM downregulated HCV RNA (core region) after 6 and 24 h. Data for RNA levels are mean ± SE (n = 3 independent experiments). aP < 0.05, bP < 0.01 vs DMSO control.
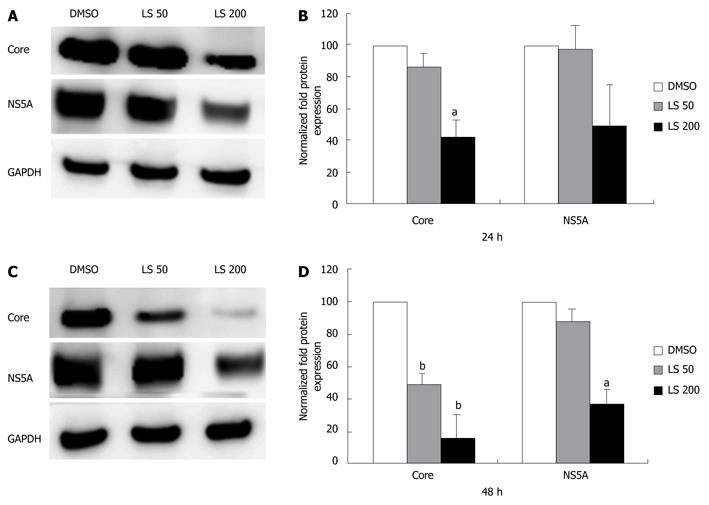
Figure 3 Effects of legalon-SIL on hepatitis C virus core and NS5A protein levels in CON1 cells after 24 and 48 h.
CON1 cells were grown to near confluence and the medium was changed to 5% FBS plus Dulbecco’s modified Eagle’s medium, then treated with vehicle only (DMSO) or 50 or 200 μmol/L legalon-SIL (LS). The cells were harvested 24-48 h after treatment. Total protein (10 μg) was separated on 4%-12% gradient sodium dodecyl sulphate-polyacrylamide gel electrophoresis and electrophoretically transferred onto an Immun-Blot PVDF. Hepatitis C virus core and NS5A protein levels were assessed through Western blotting. Representative Western blots, and glyceraldehyde-3-phosphate dehydrogenase (GAPDH)-normalized quantifications are shown after 24 h (A, B), and 48 h (C, D). Data for protein levels are mean ± SE (n = 3 independent experiments). aP < 0.05, bP < 0.01 vs DMSO control.
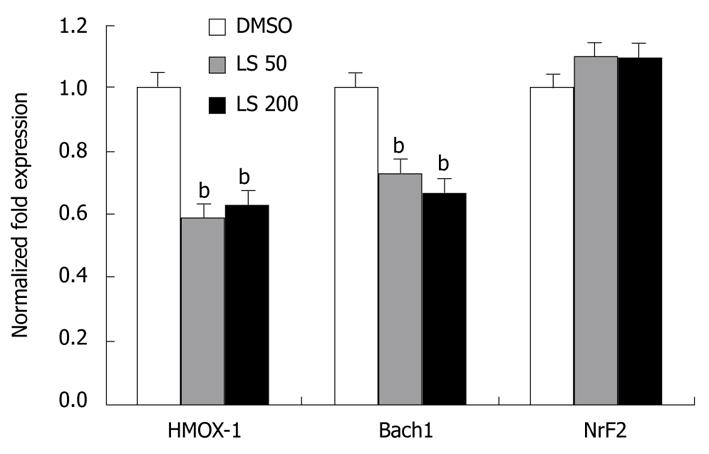
Figure 4 Effects of legalon-SIL on heme oxygenase-1, Bach1, and nuclear factor erythroid 2-related factor 2 mRNA levels after 24 h.
CON1 cells were grown to near confluence and medium was changed to 5% FBS plus Dulbecco’s modified Eagle’s medium, then treated with vehicle only (DMSO) or 50 or 200 μmol/L legalon-SIL (LS). The cells were harvested 24 h after treatment. The levels of HMOX-1, Bach1, and nuclear factor erythroid 2-related factor 2 (Nrf2) mRNA were quantified using quantitative reverse transcriptase polymerase chain reaction as described in “Materials and Methods”. The amounts of HMOX-1, Bach1, and Nrf2 mRNA were normalized to glyceraldehyde-3-phosphate dehydrogenase. Data are presented as the mean ± SE experiments were performed 3 times. bP < 0.01 vs DMSO control.
Figure 5 Effects of legalon-SIL on HMOX-1, Bach1, and Nrf2 protein levels in CON1 cells after 48 h.
CON1 cells were grown to near confluence and the medium was changed to 5% FBS plus Dulbecco’s modified Eagle’s medium, and then treated with vehicle only (DMSO) or 50 or 200 μmol/L legalon-SIL (LS). The cells were harvested 48 h after treatment. Total protein (10 μg) was separated on 4%-12% gradient sodium dodecyl sulphate-polyacrylamide gel electrophoresis and electrophoretically transferred onto an Immun-Blot PVDF. HMOX-1, Bach1, and Nrf2 protein levels were assessed through Western blotting, and normalized to glyceraldehyde-3-phosphate dehydrogenase (GAPDH). A: Representative Western blottings. B: Results of these independent experiments quantified and normalized to GAPDH. Data for protein levels are mean ± SE (n = 3 independent experiments). aP < 0.05 vs DMSO control.
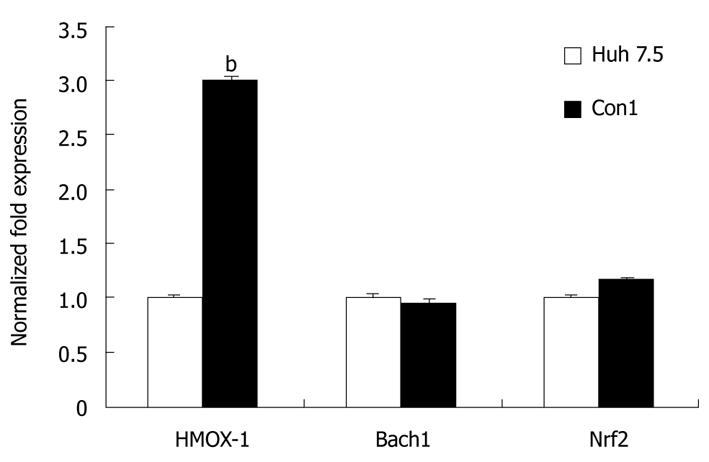
Figure 6 HMOX-1, Bach1, and Nrf2 mRNA levels in CON1 vs Huh 7.
5 cells. The levels of HMOX-1, Bach1, and Nrf2 mRNA in untreated Huh 7.5 and CON1 cells were quantified using quantitative reverse transcriptase polymerase chain reaction as described in “Materials and Methods”. The amounts of HMOX-1, Bach1 and Nrf2 mRNA were normalized to GAPDH. Data for mRNA levels are mean ± SE. bP < 0.01 vs Huh7.5.
- Citation: Mehrab-Mohseni M, Sendi H, Steuerwald N, Ghosh S, Schrum LW, Bonkovsky HL. Legalon-SIL downregulates HCV core and NS5A in human hepatocytes expressing full-length HCV. World J Gastroenterol 2011; 17(13): 1694-1700
- URL: https://www.wjgnet.com/1007-9327/full/v17/i13/1694.htm
- DOI: https://dx.doi.org/10.3748/wjg.v17.i13.1694


