Copyright
©2011 Baishideng Publishing Group Co.
World J Gastroenterol. Mar 28, 2011; 17(12): 1631-1641
Published online Mar 28, 2011. doi: 10.3748/wjg.v17.i12.1631
Published online Mar 28, 2011. doi: 10.3748/wjg.v17.i12.1631
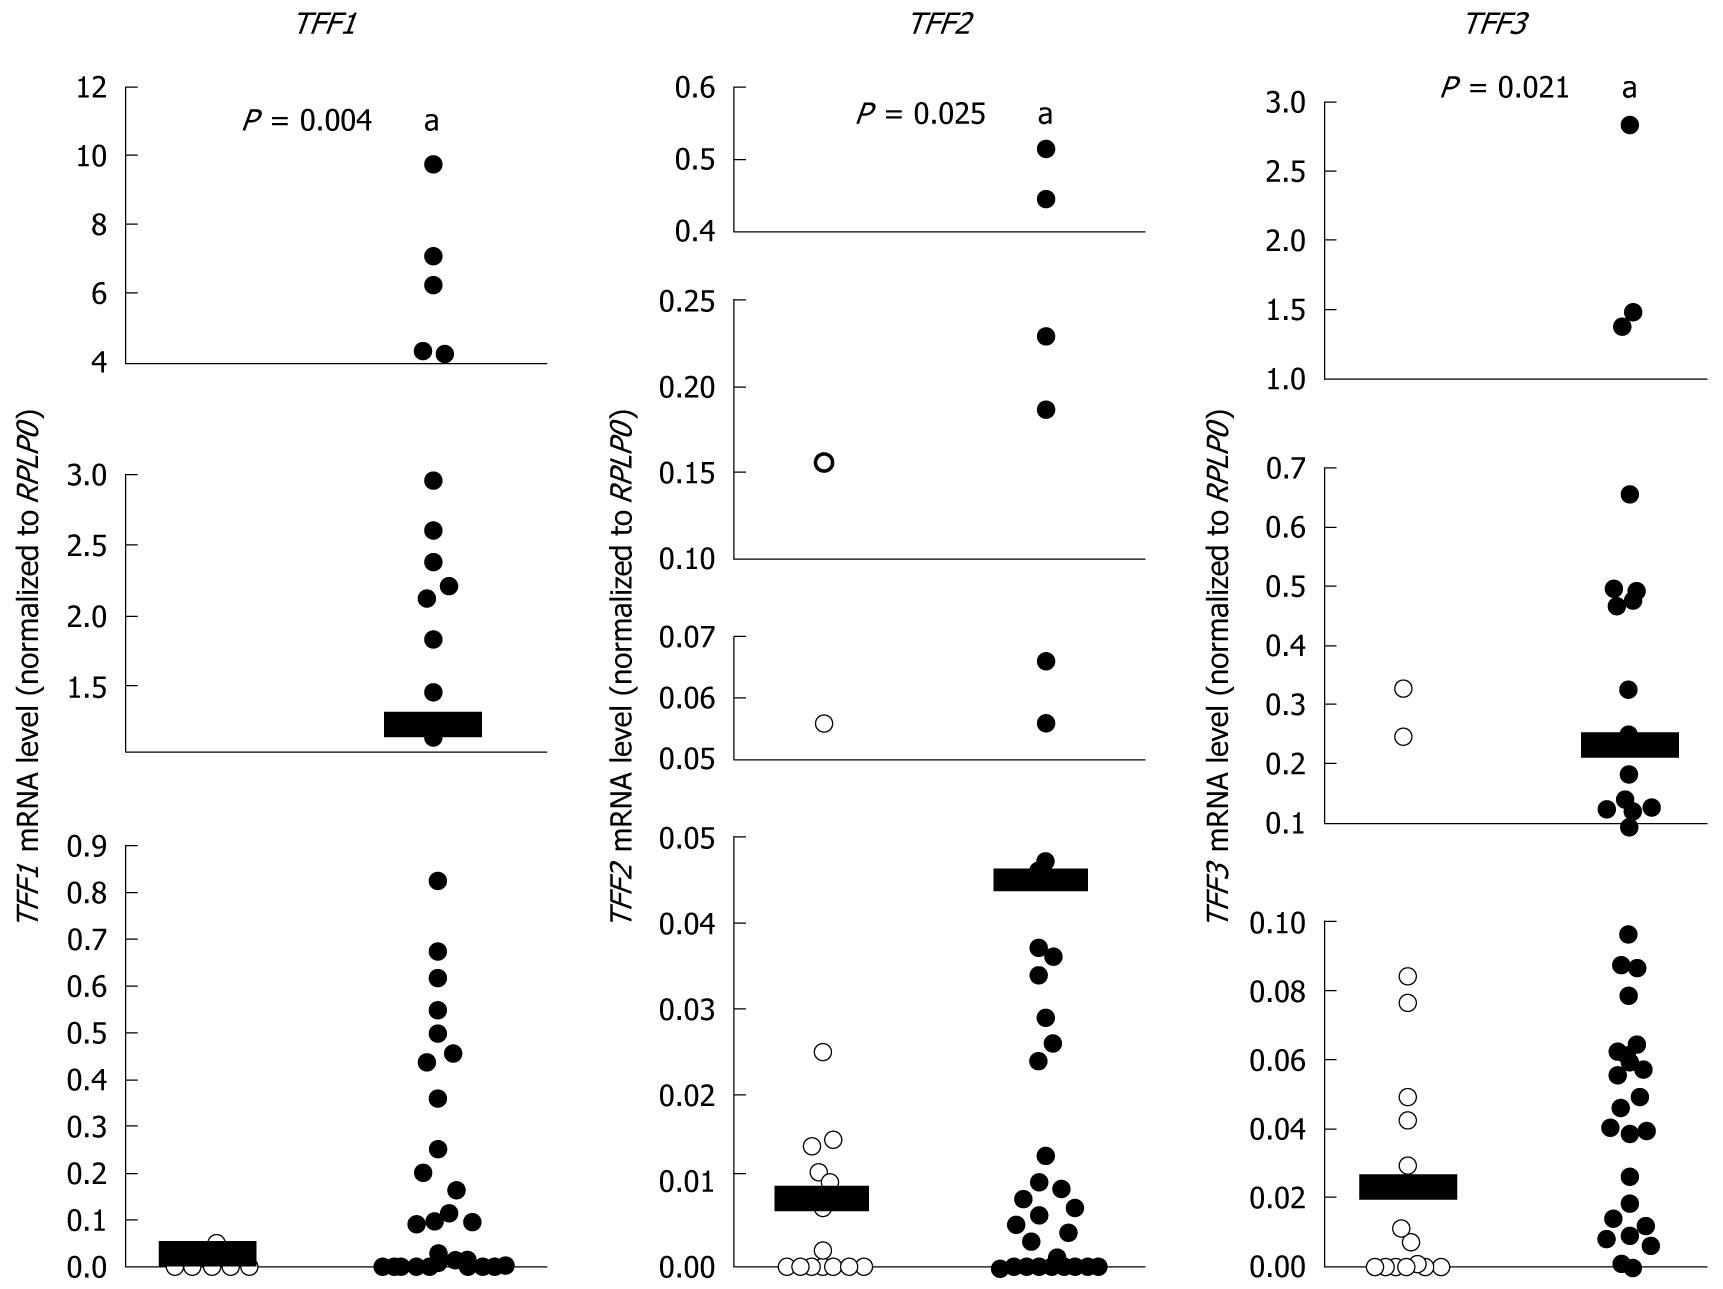
Figure 1 The mRNA expression levels of Trefoil factor genes in normal and cholangiocarcinoma tissues.
Quantitative reverse transcription polymerase chain reaction analysis of trefoil factor (TFF)1, TFF2 and TFF3 mRNA levels in cholangiocarcinoma tumors (n = 46) compared with normal controls (n = 16). Scatter plots show mRNA abundance for each data point normalized to the internal reference gene RPLP0. Horizontal black bars show mean mRNA levels. aP < 0.05. A statistical outlier in the TFF2 normal control data set is +3.58 standard deviations from the mean and failed a Z-test, which requires that values must fall within 3 standard deviations of the mean for statistical validity. This sample (shown in bold font) was excluded from all statistical calculations for this data set.
Figure 2 Immunohistochemical detection of trefoil factor proteins in normal and dysplasia bile ducts (Original magnification × 400).
A: Small and large normal bile ducts (short arrows) showing no trefoil factor (TFF)1 expression, whereas dysplasia showed moderately increased expression (long arrows); B: TFF2 expression was strongly positive in peribiliary glands (long arrows) but rarely present in dysplasia (short arrows); C: TFF3 was distributed widely at low level in small and large normal bile ducts (short arrows) and markedly increased in dysplasia (long arrows).
Figure 3 Immunohistochemical examinations of trefoil factor proteins in cholangiocarcinoma (Original magnification × 400).
A: Trefoil factor (TFF)1 staining was markedly positive and was mostly seen in the cytoplasm; B: TFF2 staining was mostly in the cytoplasm and at the invasion front (arrows); C: TFF3 staining showing a goblet cell pattern manifested as diffusely distributed coarse granules.
Figure 4 Frequencies of trefoil factor immunostaining in normal bile ducts, dysplasia and cholangiocarcinoma.
A: Trefoil factor (TFF)1 positive immunostaining was markedly frequent in dysplasia and cholangiocarcinoma (CCA) compared to normal; B: Frequency of TFF2 positive immunostaining was significantly higher in CCA than in dysplasia and normal controls; C: TFF3 positive immunostaining was less frequent in CCA than in dysplasia and controls. aP < 0.05.
Figure 5 Kaplan-Meier survival curves with regard to trefoil factor copy number in cholangiocarcinoma.
No association between trefoil factor (TFF) copy number and survival time (week) was found for A: TFF1; B: TFF2; C: TFF3.
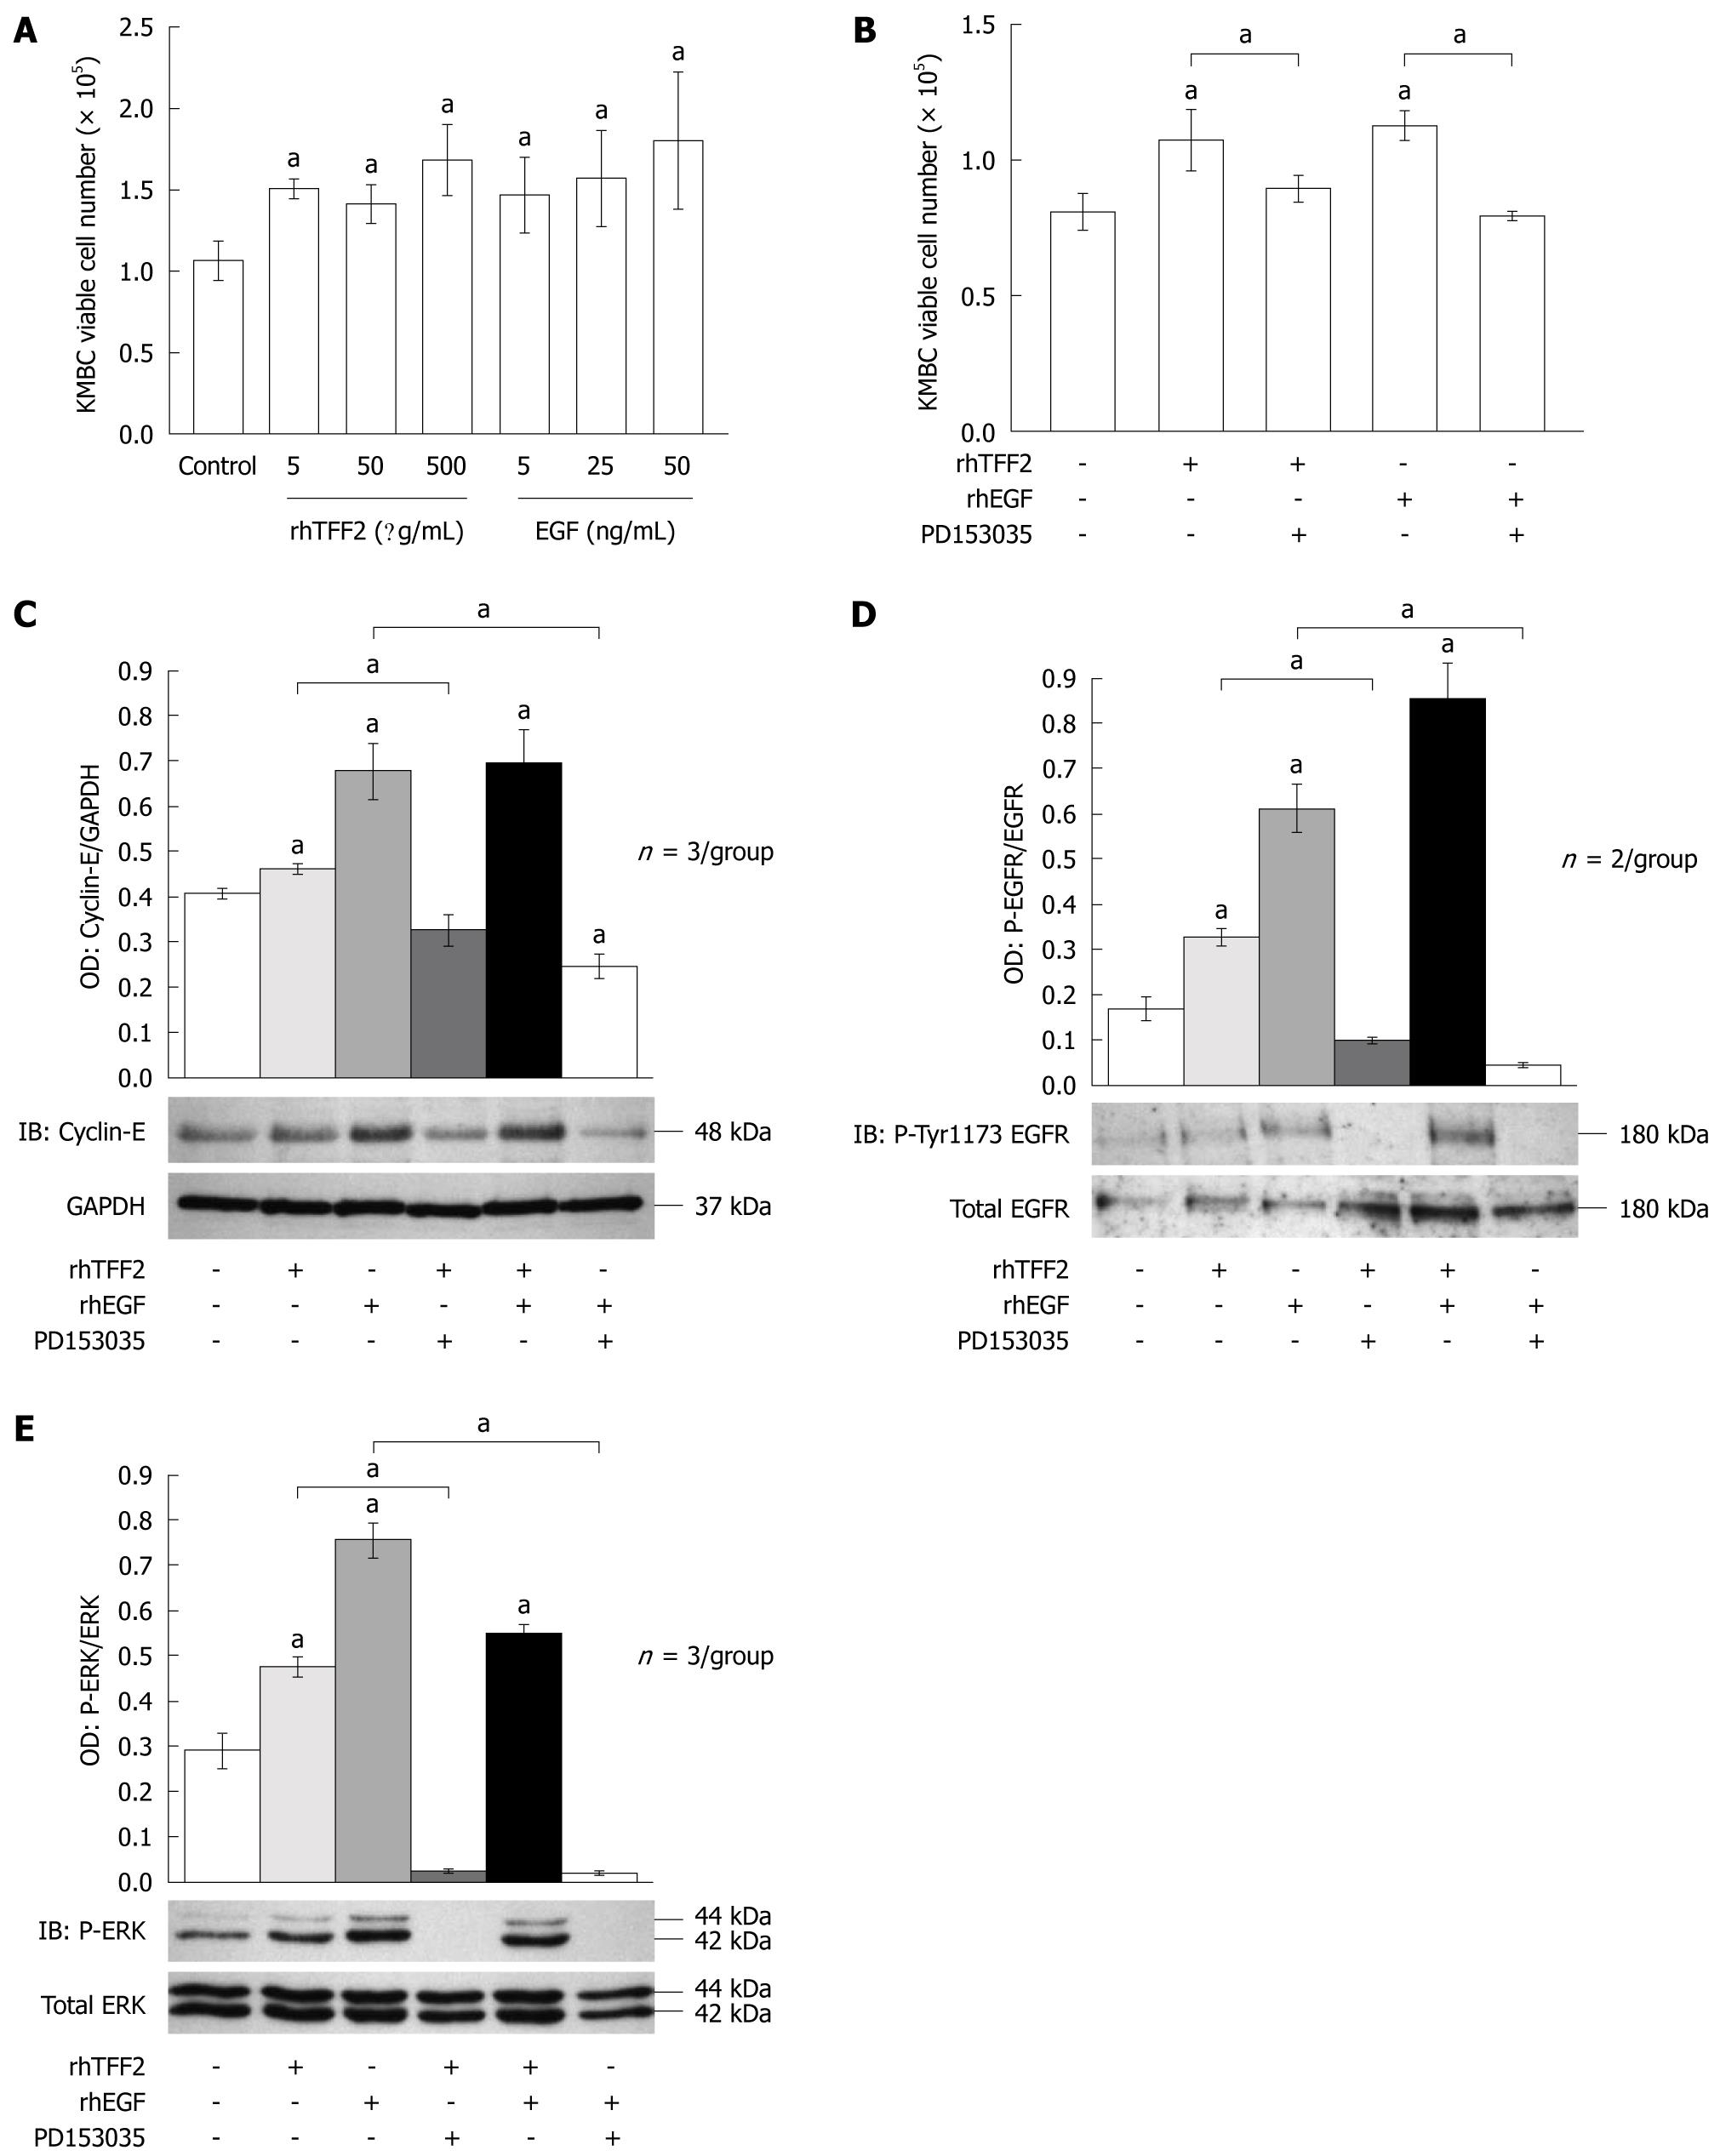
Figure 6 Trefoil factor 2 drives proliferation of KMBC cholangiocarcinoma cells via epidermal growth factor receptor tyrosine kinase and mitogen-activated protein kinase pathway activation.
A: Proliferation of KMBC human cholangiocarcinoma cells determined by viable cell number counting with recombinant human trefoil factor (rhTFF)2 dose response (5, 50, 500 μg/mL) and epidermal growth factor (EGF) (5, 25, 50 ng/mL). Histograms show mean cell number per well. Error bars show standard error of the mean (SE). aP < 0.05; B: Proliferation of KMBC cells determined by viable cell number counting following treatment with combinations of
- Citation: Kosriwong K, Menheniott TR, Giraud AS, Jearanaikoon P, Sripa B, Limpaiboon T. Trefoil factors: Tumor progression markers and mitogens via EGFR/MAPK activation in cholangiocarcinoma. World J Gastroenterol 2011; 17(12): 1631-1641
- URL: https://www.wjgnet.com/1007-9327/full/v17/i12/1631.htm
- DOI: https://dx.doi.org/10.3748/wjg.v17.i12.1631


