Copyright
©2011 Baishideng Publishing Group Co.
World J Gastroenterol. Mar 28, 2011; 17(12): 1594-1599
Published online Mar 28, 2011. doi: 10.3748/wjg.v17.i12.1594
Published online Mar 28, 2011. doi: 10.3748/wjg.v17.i12.1594
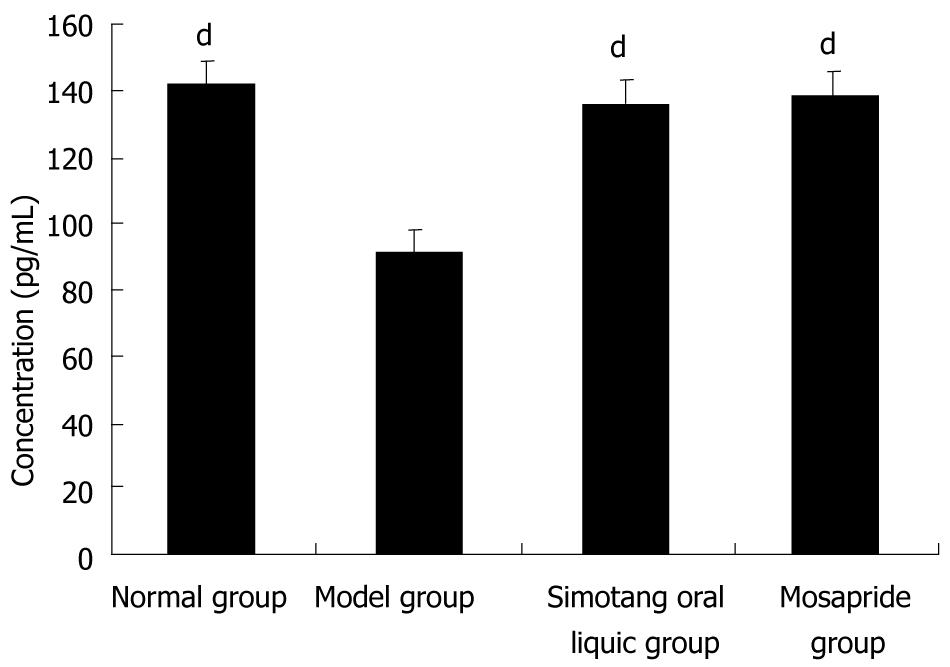
Figure 1 Effect of Simotang on serum motilin level in chronically stressed mice.
Values are expressed as mean ± SD, n = 10/group. dP < 0.01 vs model group.
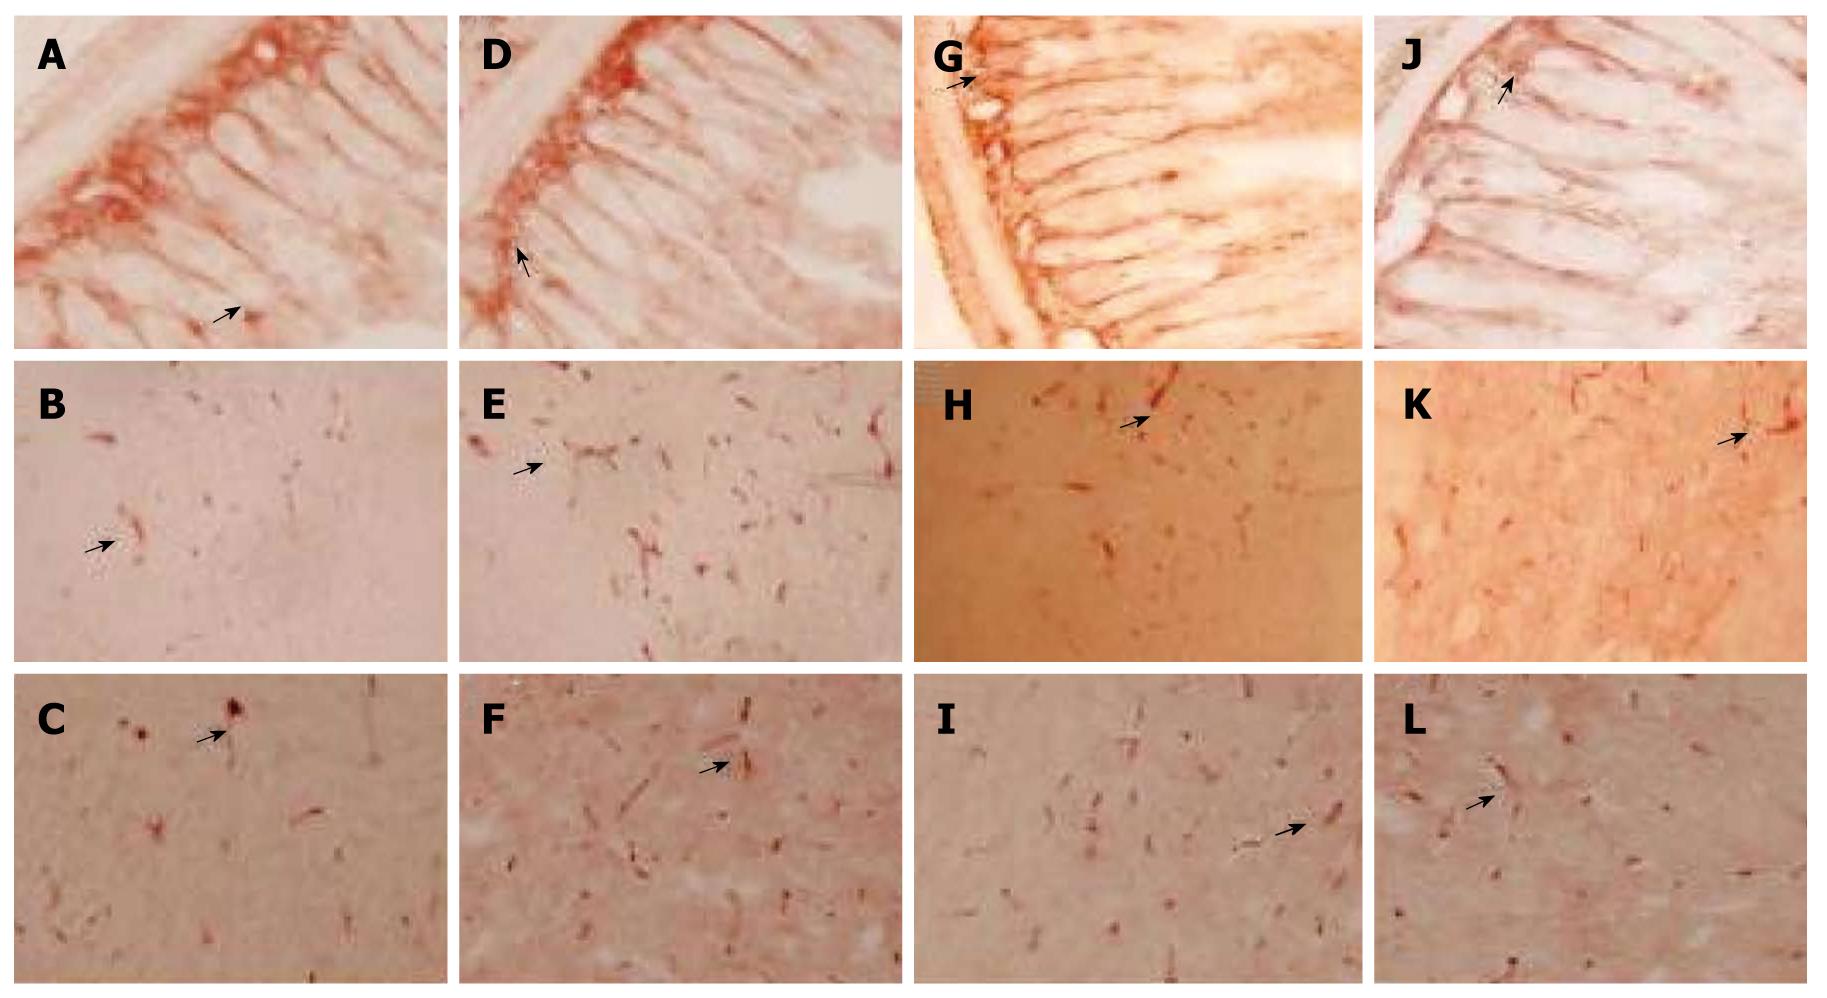
Figure 2 Effect of Simotang on expression of cholecystokinin-positive cells in the small intestine, spinal cord and brain of chronically stressed mice with immunostaining with cholecystokinin in small intestine (A, D, G and J), spinal cord (B, E, H and K) and brain cortex (C, F, I and L) in control group (A-C), model group (E, F), Simotang group (G-I) and mosapride group (J-L).
Magnification × 200.
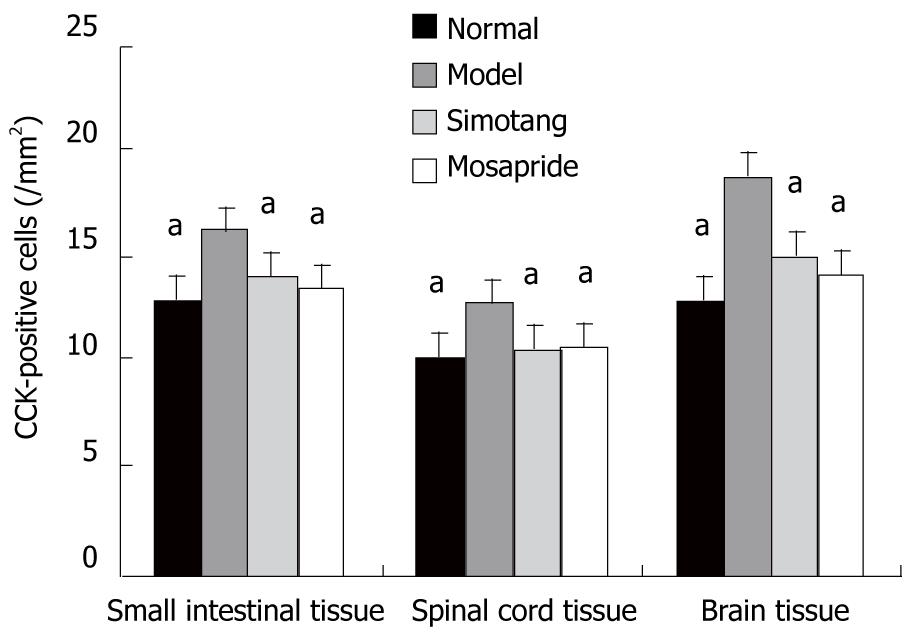
Figure 3 Effect of Simotang on the number of cholecystokinin-positive cells in the small intestine, spinal cord and brain of chronically stressed mice (mean ± SD, n = 5/group).
aP < 0.05 vs model group.
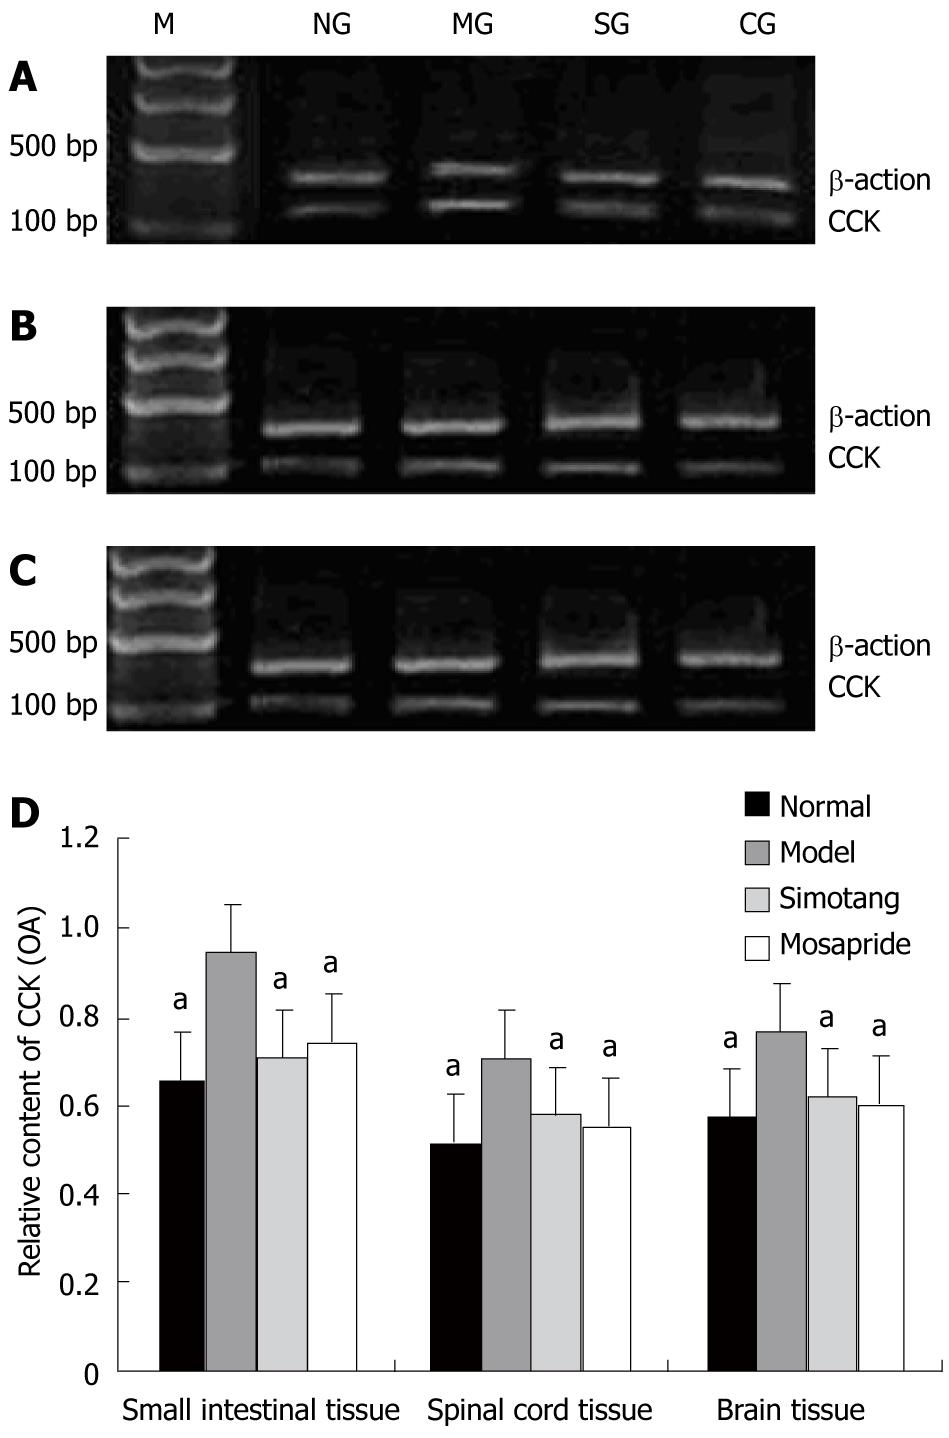
Figure 4 Effect of simotang on cholecystokinin gene expression in the small intestine (A), spinal cord (B), brain (C) of chronically stressed mice, and relative optical density of cholecystokininm RNA in small intestine, spinal cord and brain of chronically stressed mice (D).
Values are expressed as mean ± SD (n = 5/group). M: Marker; NG: Control group; MG: Model group; SG: Simotang group; CG: Mosapride group. aP < 0.05 vs model group.
- Citation: Cai GX, Liu BY, Yi J, Chen XM, Liu FL. Simotang enhances gastrointestinal motility, motilin and cholecystokinin expression in chronically stressed mice. World J Gastroenterol 2011; 17(12): 1594-1599
- URL: https://www.wjgnet.com/1007-9327/full/v17/i12/1594.htm
- DOI: https://dx.doi.org/10.3748/wjg.v17.i12.1594


