Copyright
©2011 Baishideng Publishing Group Co.
World J Gastroenterol. Jan 7, 2011; 17(1): 79-88
Published online Jan 7, 2011. doi: 10.3748/wjg.v17.i1.79
Published online Jan 7, 2011. doi: 10.3748/wjg.v17.i1.79
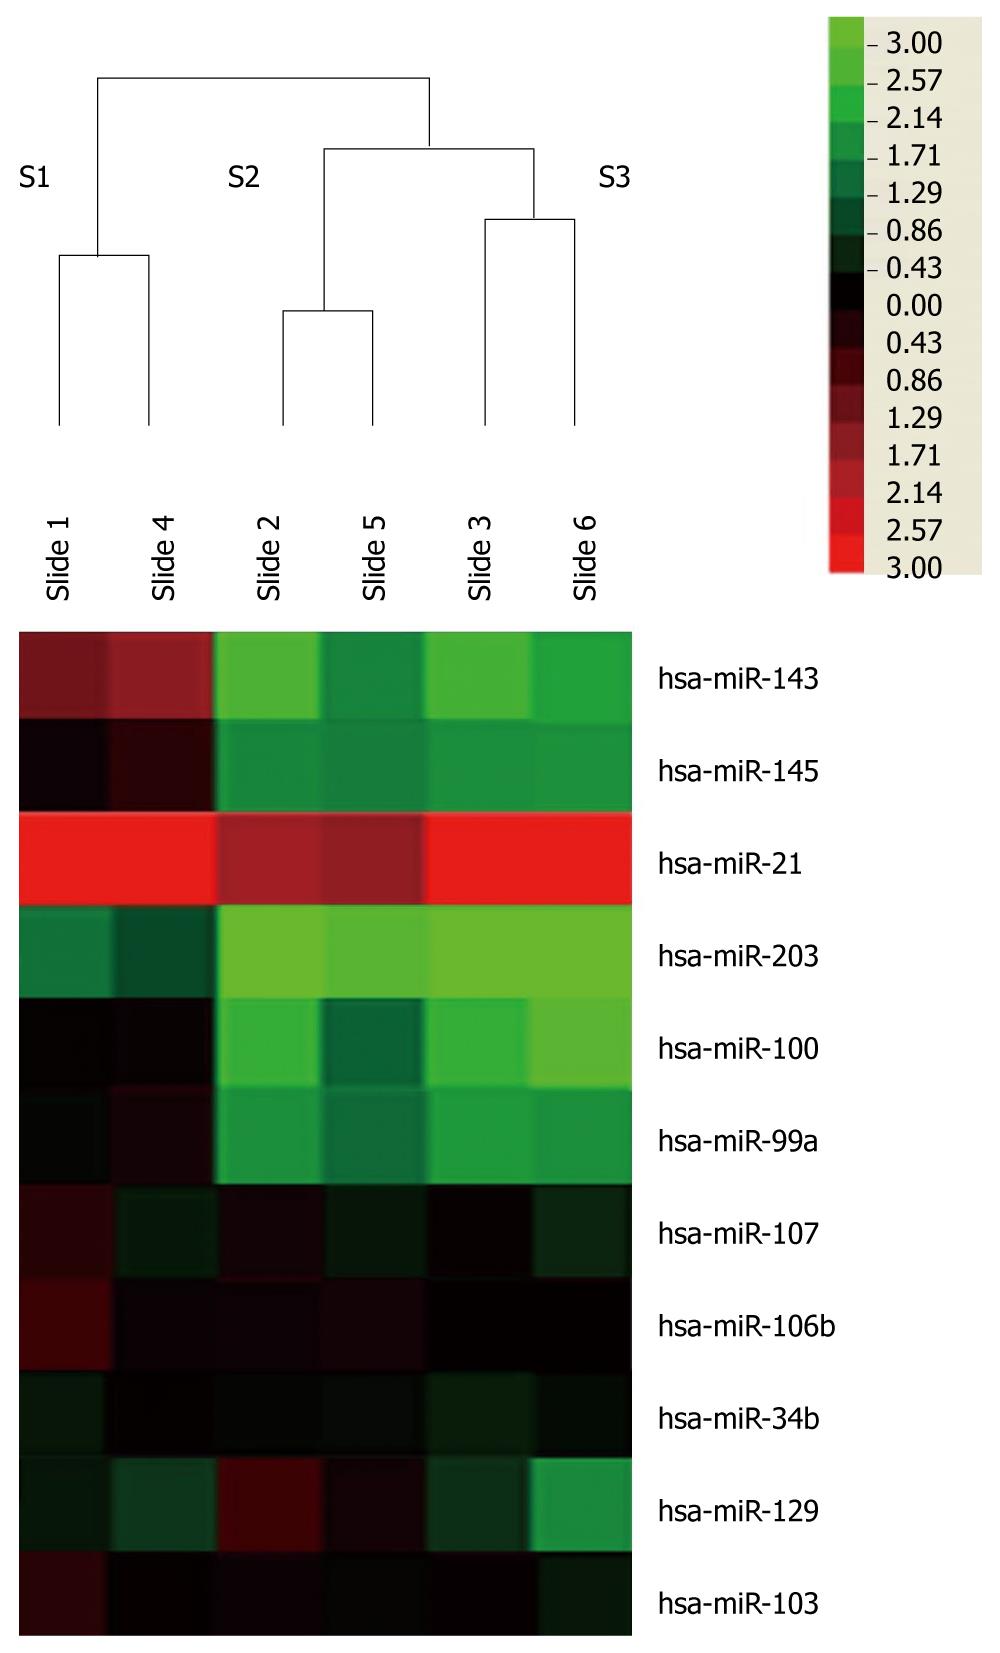
Figure 1 miRNAs are deregulated in esophageal squamous cell carcinoma as detected by microRNA microarray.
Three pairs of esophageal carcinoma and normal tissue matches were analyzed by miRCURY LNA™ microRNA Arrays v.11.0. Each RNA sample was dye-swap labeled. Unsupervised hierarchical cluster analysis of miRNA expression in three esophageal carcinoma patients. Rows: miRNAs; columns: cases. The analysis showed that two chips in each case were consistent. For each miRNA, red represents higher expression and blue represents lower expression than the average expression. S1, sample 1; S2, sample 2; S3, sample 3.
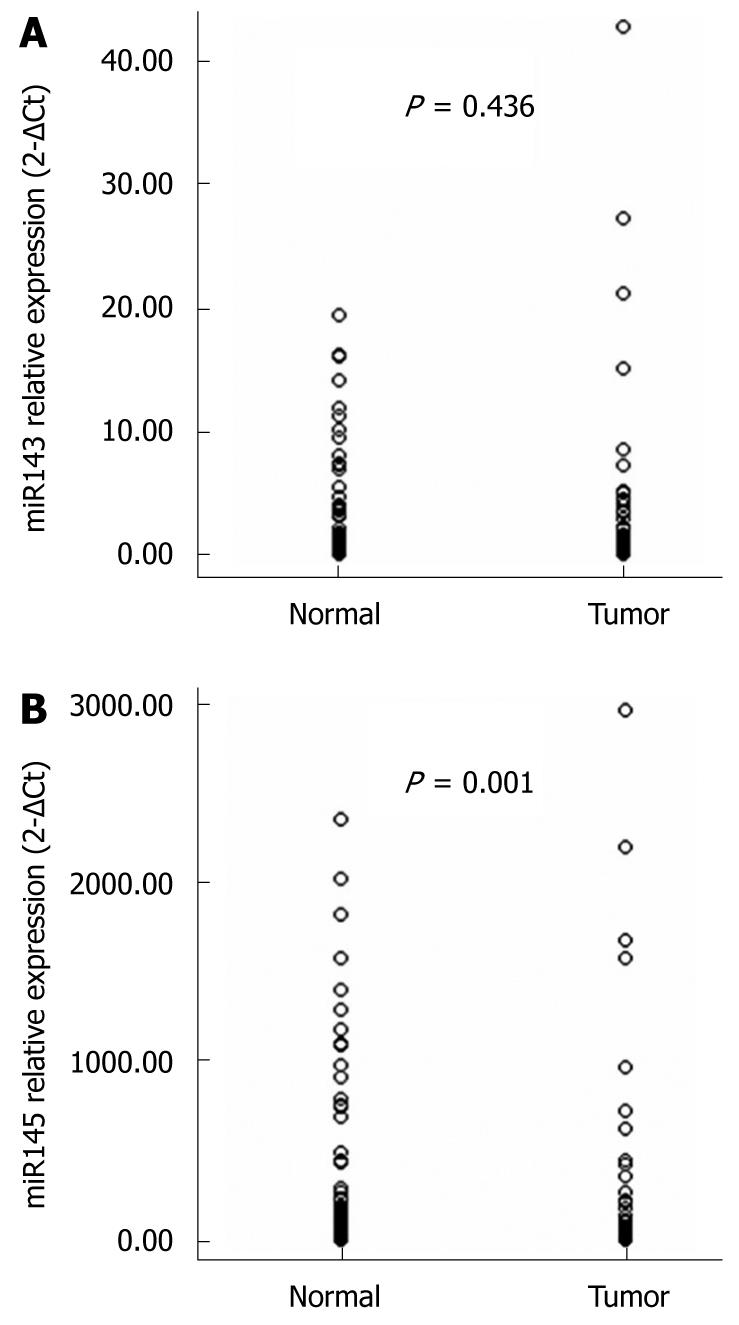
Figure 2 Differential expression of miR-143 (A) and miR-145 (B) in esophageal squamous cell carcinoma compared to normal tissue.
Each value represents the relative expression using the 2-ΔCt method with U6 RNA as an endogenous control. miR-145 is significantly deregulated in esophageal carcinoma patients (P = 0.001).
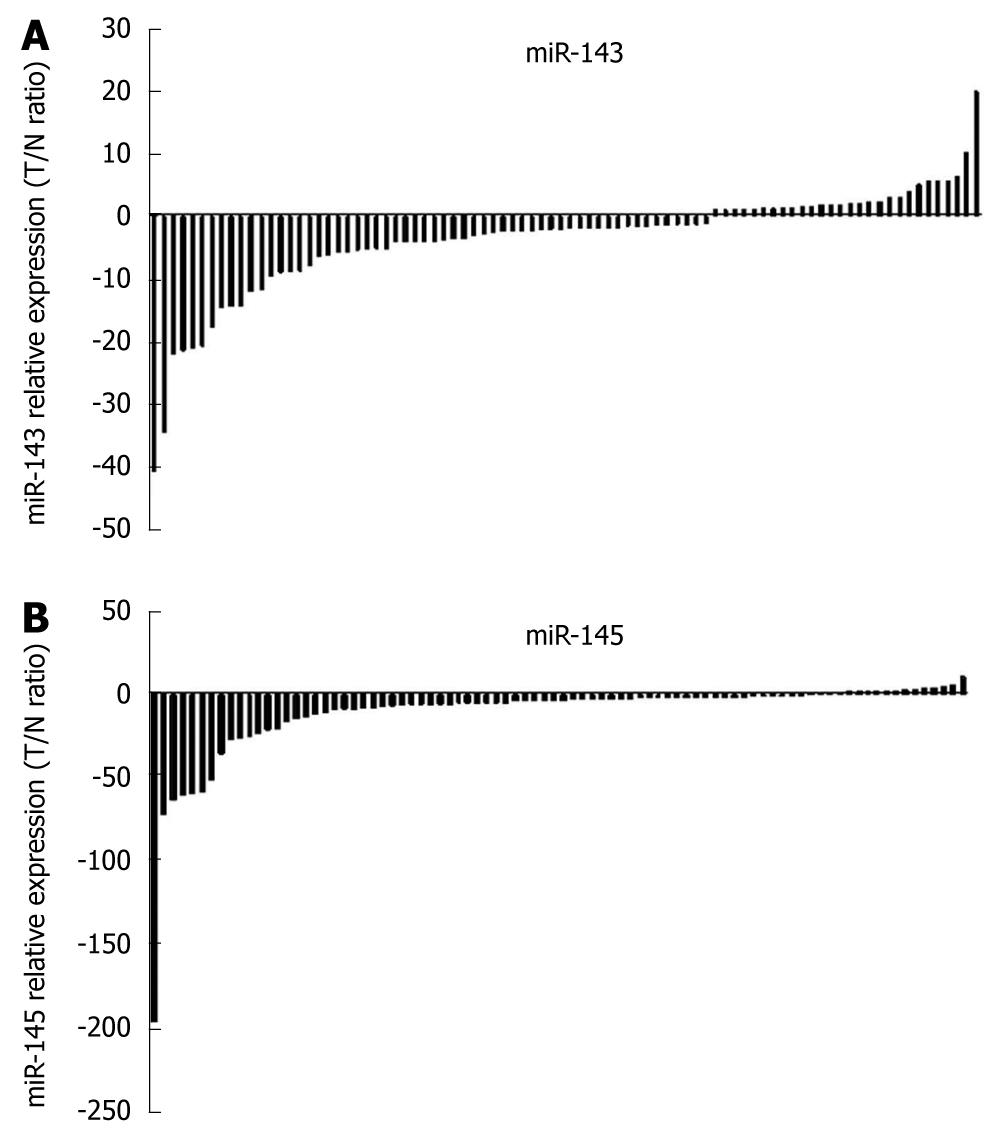
Figure 3 Downregulation of miR-143 and miR-145 in esophageal squamous cell carcinoma.
Using the 2-ΔΔCt method, those with a greater than 2-fold change were considered significant. The expression of miR-143 was downregulated in 48.9% (46/94) and miR-145 was downregulated in 60.6% (57/94) clinical samples of esophageal carcinoma.
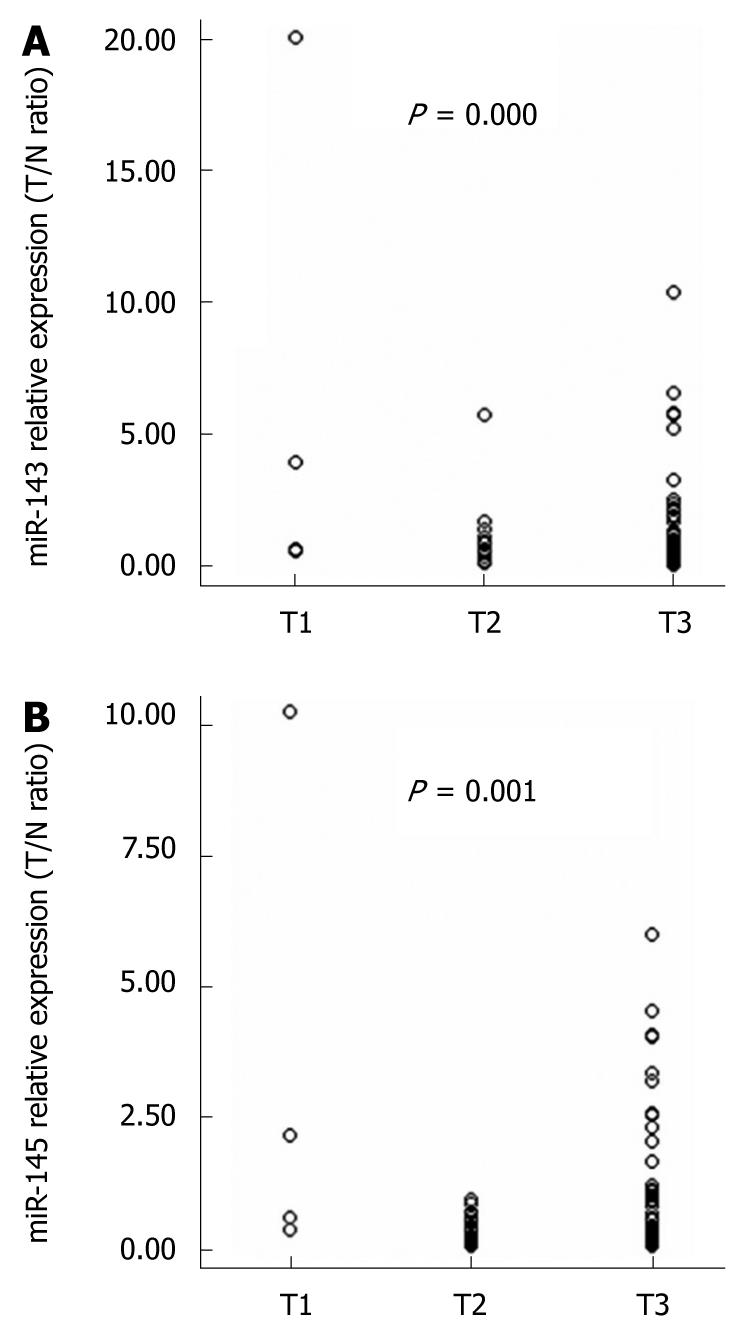
Figure 4 Associations between the expression of miR-143 and miR-145 and clinicopathologic features.
The expression of both miR-143 and miR-145 were significantly associated with esophageal squamous cell carcinoma tumor invasion (P = 0.000 and P = 0.001, respectively).
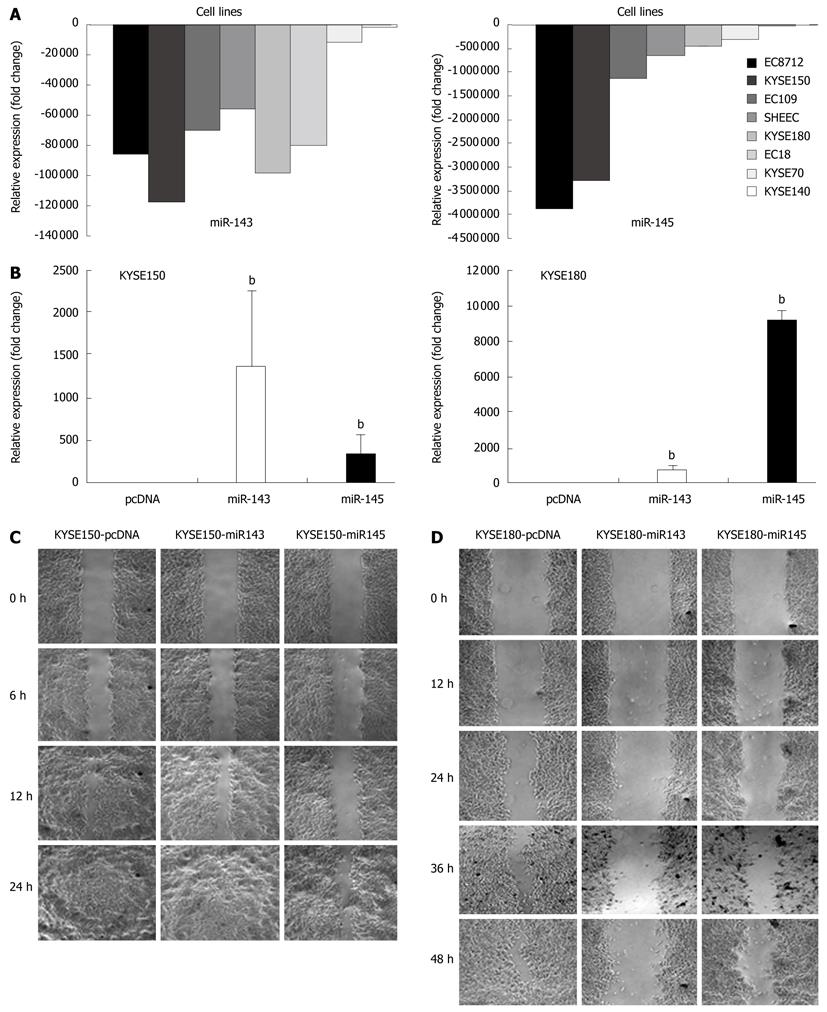
Figure 5 miR-143 and miR-145 inhibited esophageal squamous cell carcinoma cell mobility.
A: The expression levels of miR-143 and miR-145 in esophageal squamous cell carcinoma (ESCC) cell lines. Using normal tissue as the control, both miRNAs were significantly downregulated in ESCC cell lines; B: The increased expression of miR-143 and miR-145 following stable transfection. Quantitative reverse transcription-polymerase chain reaction demonstrated a significant increase in the expression levels of miR-143 and miR-145 in KYSE150 and KYSE180 cells transfected with the respective expression plasmids compared with the levels in control cells (bP < 0.01); C, D: The increased expression of miR-143 and miR-145 inhibited the mobility of both KYSE150 and KYSE180 cells. The miRNA stably transfected cells were seeded in a 6-well plate, streaks were made using a tip when the cells were grown to almost confluence 24 h later. Streaks were photographed at different intervals at 50 ×. This showed that upregulation of miR-143 and miR-145 can prevent ESCC cell wound healing. These findings are shown in (C) and (D).
Figure 6 Identification of miR-143 and miR-145 targets.
A, B: The protein level of the reported miR-145 target, FSCN1, did not change significantly in KYSE150 and KYSE180 cells when the expression of both miRNAs was upregulated by transfection with their corresponding expression plasmids.
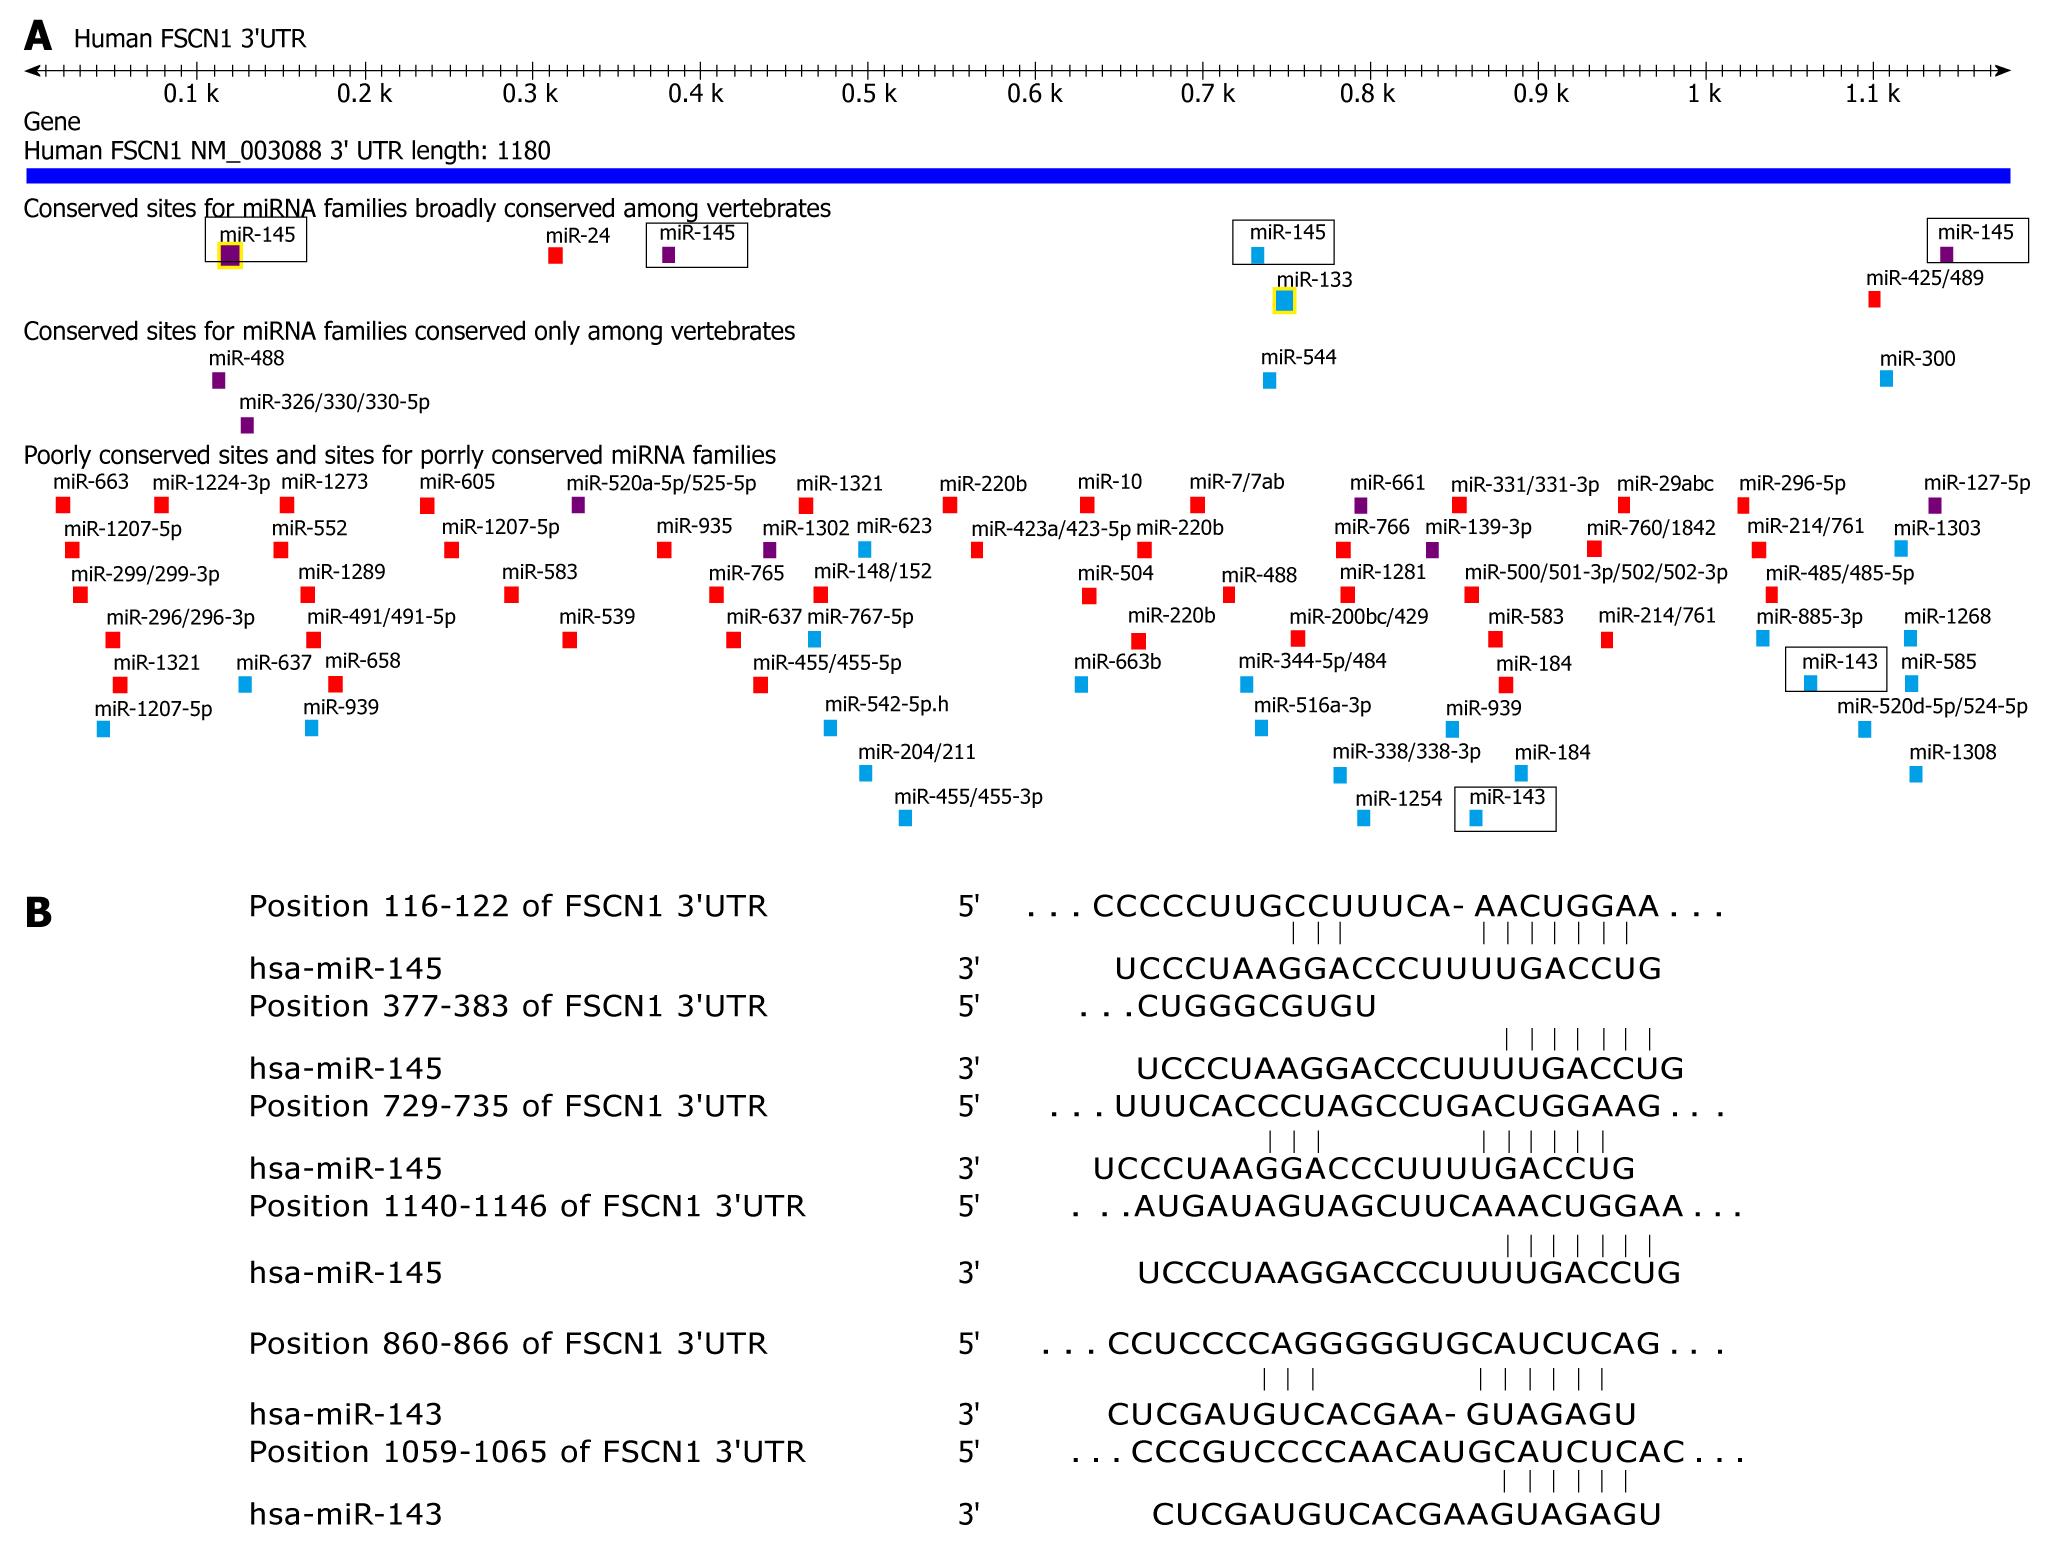
Figure 7 Human FSCN1 3′-UTR and its possible miRNA target sites predicted by the TargetScan program.
A: The four conserved binding sites for miR-145 and two non-conserved binding sites for miR-143 are indicated by black boxes; B: The detailed seed sequence positions and sequence pairing for miR-143 and miR-145 with FSCN1.
- Citation: Wu BL, Xu LY, Du ZP, Liao LD, Zhang HF, Huang Q, Fang GQ, Li EM. MiRNA profile in esophageal squamous cell carcinoma: Downregulation of miR-143 and miR-145. World J Gastroenterol 2011; 17(1): 79-88
- URL: https://www.wjgnet.com/1007-9327/full/v17/i1/79.htm
- DOI: https://dx.doi.org/10.3748/wjg.v17.i1.79


