Copyright
©2011 Baishideng Publishing Group Co.
World J Gastroenterol. Jan 7, 2011; 17(1): 53-62
Published online Jan 7, 2011. doi: 10.3748/wjg.v17.i1.53
Published online Jan 7, 2011. doi: 10.3748/wjg.v17.i1.53
Figure 1 Endoscopic images from an area positive for esophageal adenocarcinoma.
Abnormal areas (arrow) can be seen in the high-resolution white light image (A), and the narrow-band image (B) [Copyright (2008), with permission from Elsevier][38]; in the narrow-band image, the irregular mucosal morphology is visible (arrow); an abnormal area (arrow) can be seen in the autofluorescence image (C) where areas with loss of fluorescence are indicated as purple regions in the pseudo-colored overlay [Copyright (2005), with permission from Elsevier][36].
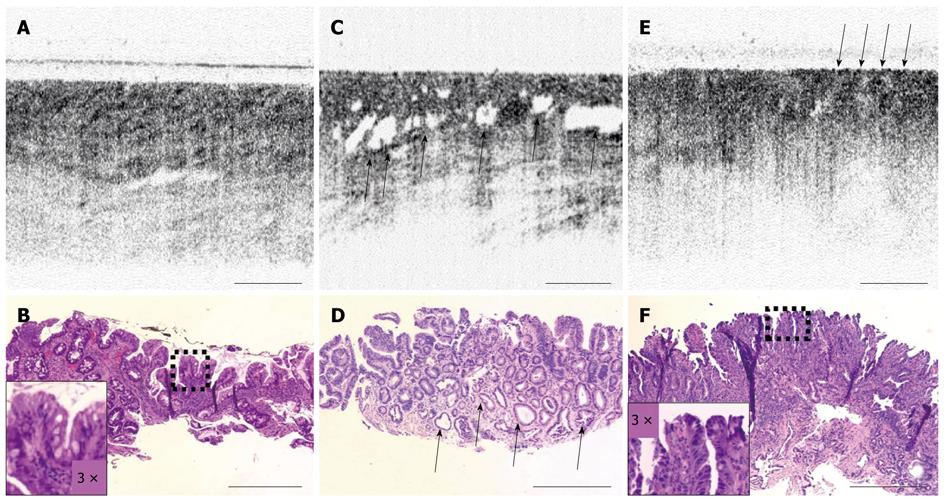
Figure 2 Optical coherence tomography images of intestinal metaplasia (A), and of neoplasia (C, E) are shown with corresponding histological images shown below [Copyright (2006), with permission from Elsevier][43], dilated glands (C) and increased surface reflectivity (E) can be seen in the optical coherence tomography images of neoplastic tissue, corresponding histopathology is shown (B, D, F).
Scale bars, 500 μm.
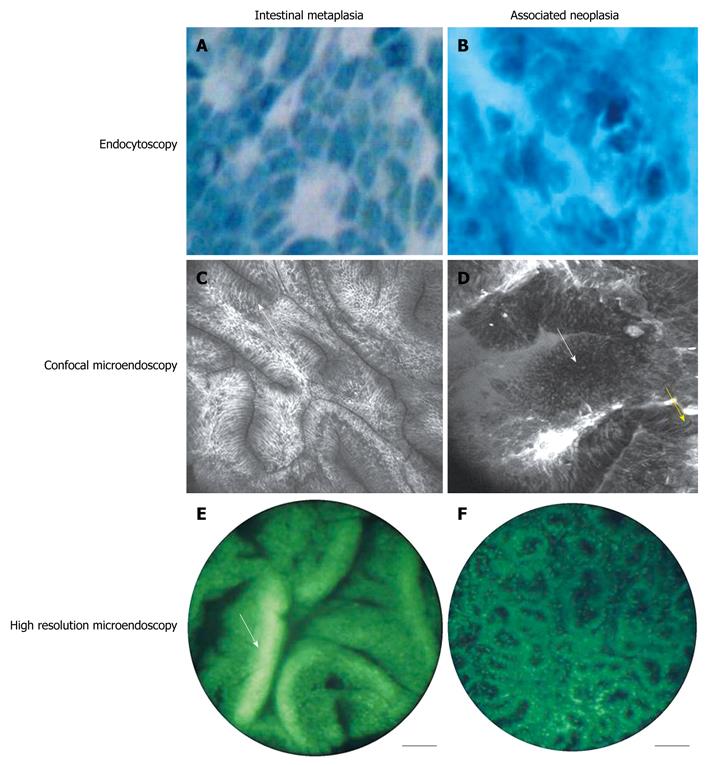
Figure 3 Images representing intestinal metaplasia and neoplasia collected using endocytoscopy (A, B) (Copyright (2007), with permission from Thieme)[47], confocal microendoscopy (C, D) [Copyright (2006), with permission from Elsevier][48], and high-resolution microendoscopy (E, F) [Copyright (2008), with permission from Elsevier][51].
Topically applied methylene blue is used in endocytoscopy to highlight nuclear changes (A, B); In metaplasia (A), nuclei appear organized and regular; this is in stark contrast to neoplasia (B) where nuclei appear pleomorphic. Both images were taken using 1125 × magnification. Confocal images were taken using intravenous fluorescein to enhance contrast of subepithelial capillaries (C, D); for intestinal metaplasia (C), confocal microendoscopy allows visualization of mucin-containing goblet cells (white arrow); For Barrett’s-associated neoplasia (B), cells are irregularly oriented (white arrow) and malignant invasion of the lamina propria can be seen (yellow arrow). Confocal images are 500 μm × 500 μm. High-resolution microendoscopy uses proflavine for contrast enhancement, highlighting changes in glandular and nuclear patterns (E, F). High-resolution images are 750 μm in diameter.
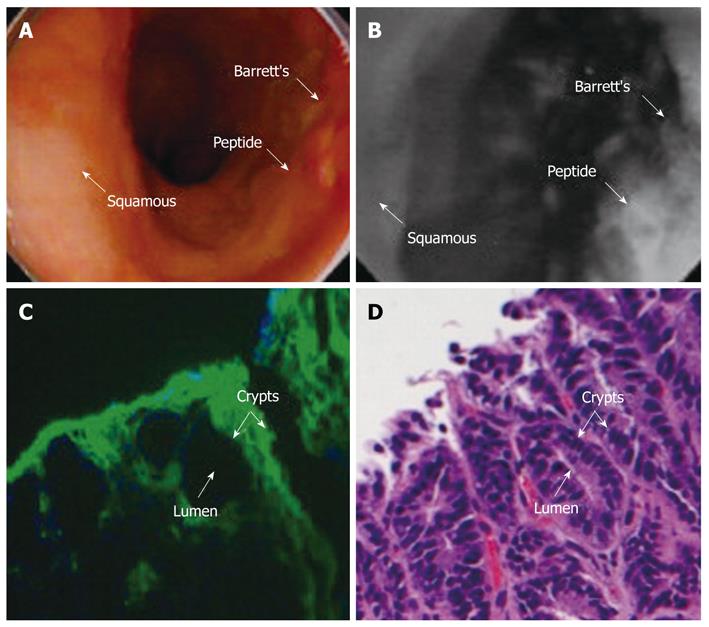
Figure 4 In vivo localization of contrast agent localized to a neoplasia region visualized using wide-field fluorescence endoscopy.
White light endoscopic image (A) shows no evidence of lesion; topical administration of peptide-targeted fluorescent dye reveals neoplastic area (B) [Copyright (2008), with permission from IOS Press][56]; targeted neoplastic crypts seen with fluorescence microscopy (C), and corresponding histology (D) [Copyright (2010), with permission from Elsevier][59].
- Citation: Thekkek N, Anandasabapathy S, Richards-Kortum R. Optical molecular imaging for detection of Barrett’s-associated neoplasia. World J Gastroenterol 2011; 17(1): 53-62
- URL: https://www.wjgnet.com/1007-9327/full/v17/i1/53.htm
- DOI: https://dx.doi.org/10.3748/wjg.v17.i1.53


