Copyright
©2010 Baishideng.
World J Gastroenterol. Feb 21, 2010; 16(7): 897-903
Published online Feb 21, 2010. doi: 10.3748/wjg.v16.i7.897
Published online Feb 21, 2010. doi: 10.3748/wjg.v16.i7.897
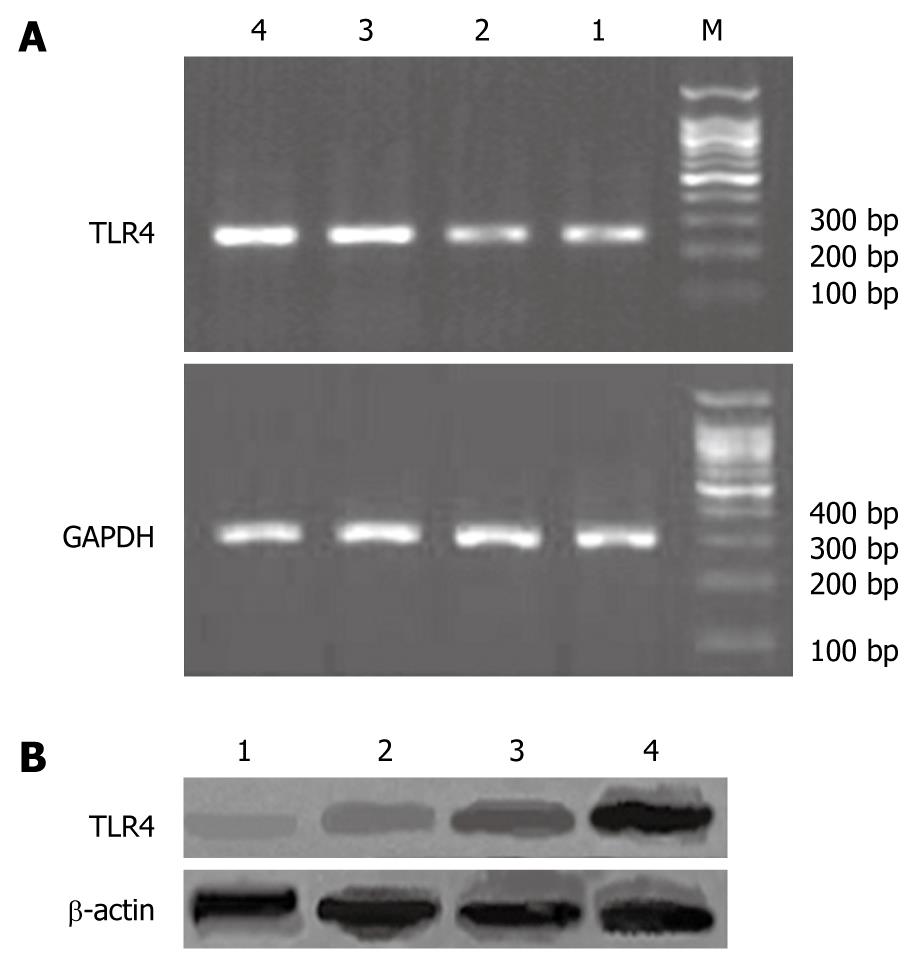
Figure 1 Expression of TLR4 in rat liver tissues.
A: RT-PCR assay of TLR4 mRNA; B: Western blotting assay of TLR4 protein. 1: Control; 2: High dose betaine group; 3: Low dose betaine group; 4: Model; M: DNA marker.
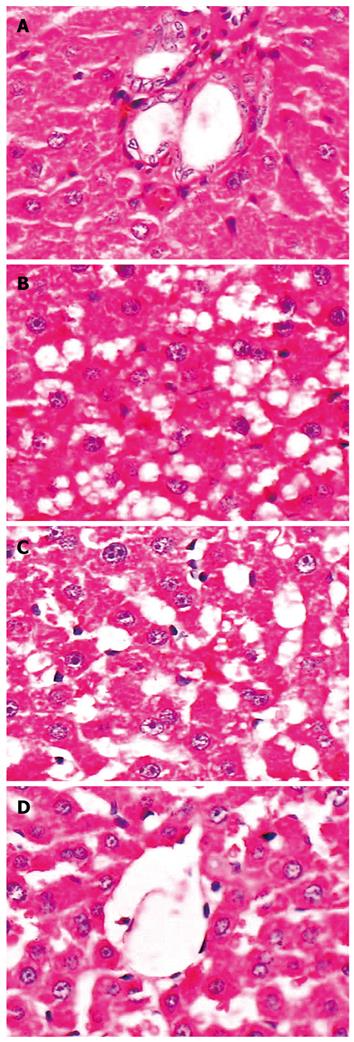
Figure 2 Histopathological changes of rat liver after betaine intervention.
A: In control group, liver structure was normal, without obvious inflammation and hepatic steatosis; B: In model group, the structure of hepatic cord was deranged, with various degrees of diffuse hepatic steatosis and intralobular inflammation; C: In low dose betaine group, the degree of hepatic steatosis and inflammation was greatly reduced compared with model group; D: High dose betaine group, showing more significant improvement of hepatic steatosis and inflammation than the low does betaine group. Original magnification × 400.
- Citation: Shi QZ, Wang LW, Zhang W, Gong ZJ. Betaine inhibits Toll-like receptor 4 expression in rats with ethanol-induced liver injury. World J Gastroenterol 2010; 16(7): 897-903
- URL: https://www.wjgnet.com/1007-9327/full/v16/i7/897.htm
- DOI: https://dx.doi.org/10.3748/wjg.v16.i7.897


