Copyright
©2010 Baishideng.
World J Gastroenterol. Feb 14, 2010; 16(6): 755-763
Published online Feb 14, 2010. doi: 10.3748/wjg.v16.i6.755
Published online Feb 14, 2010. doi: 10.3748/wjg.v16.i6.755
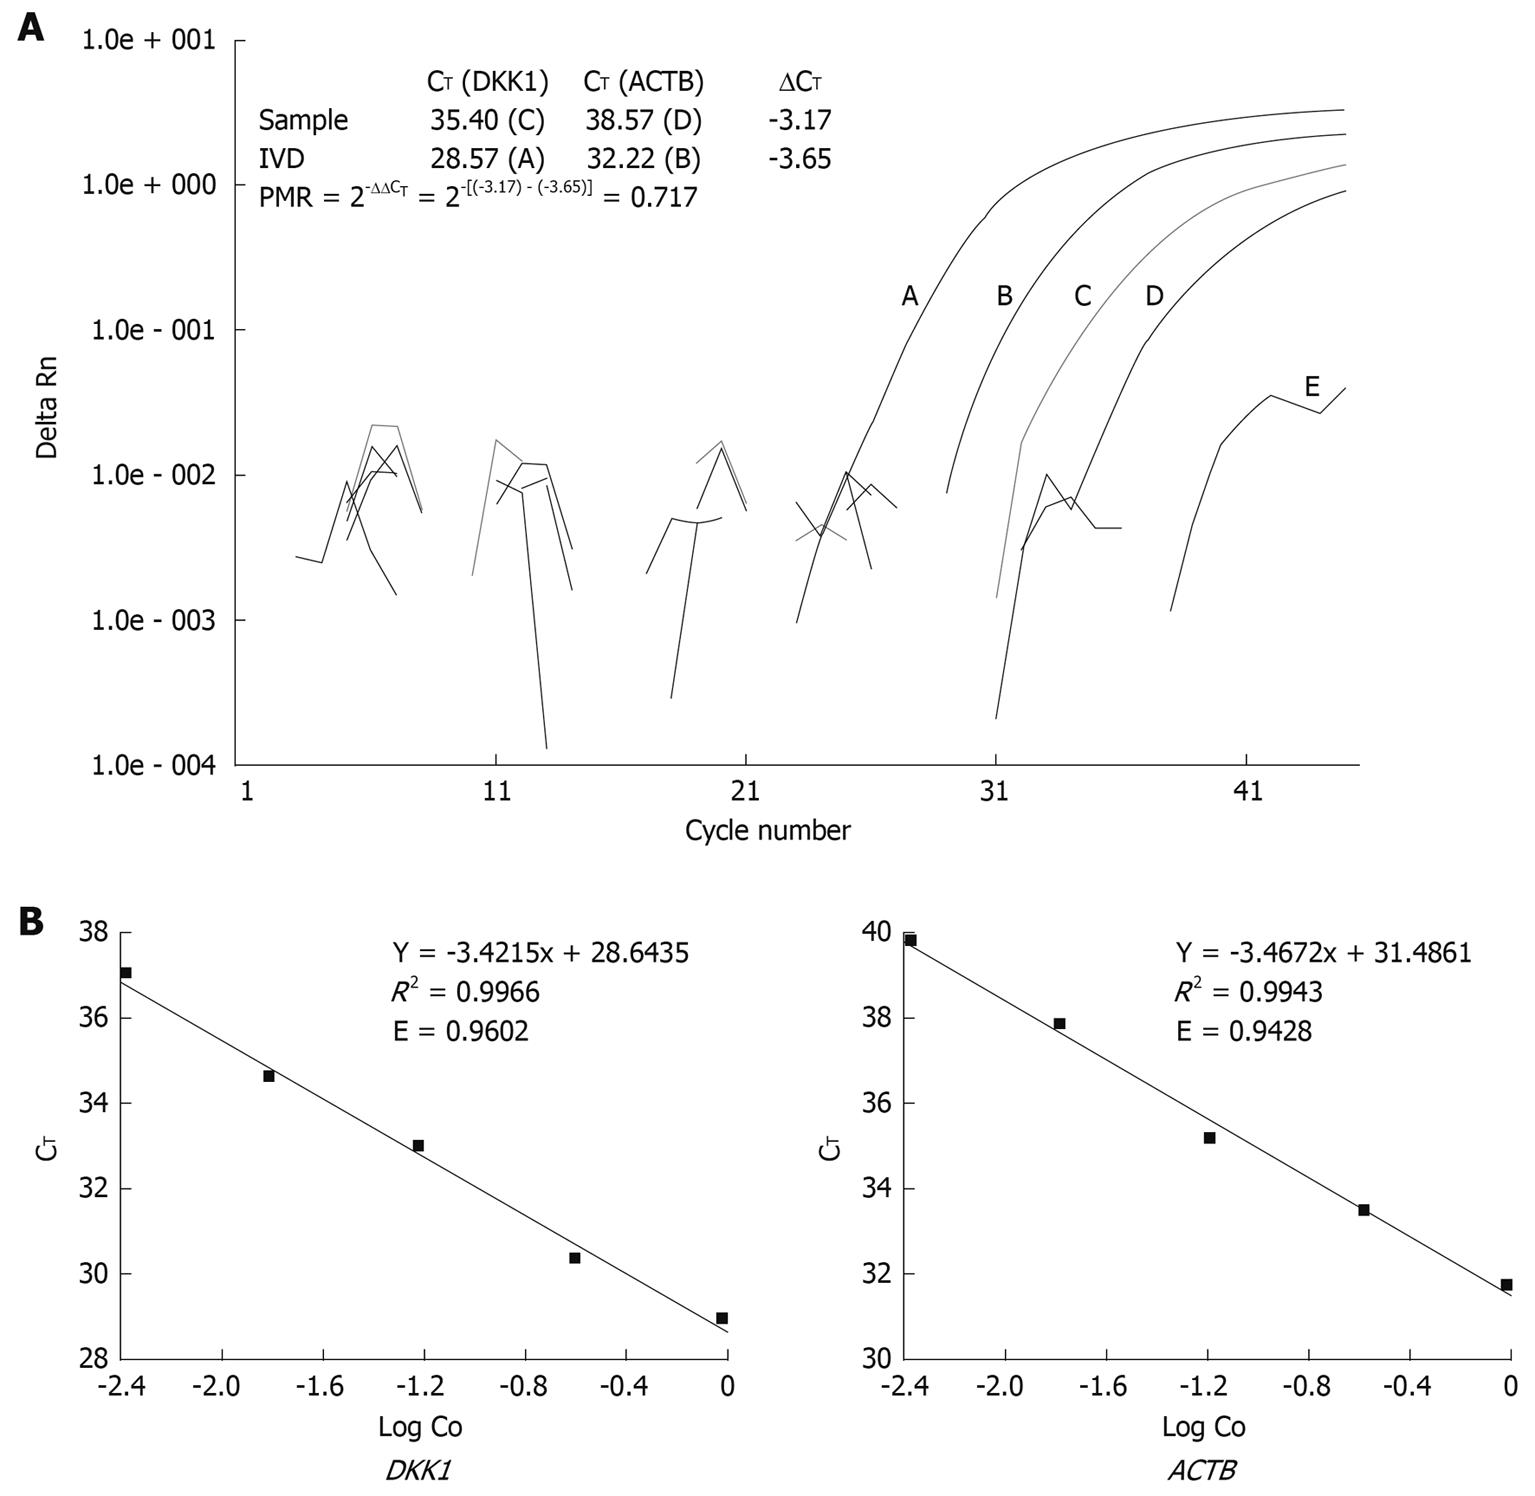
Figure 1 Quantitative methylation analysis using comparative CT method.
A: Representative quantitative methylation-specific polymerase chain reaction (Q-MSP) amplification plots for DKK1 and illustration for percent of methylated reference (PMR) calculation with comparative CT method; B: Validation experiment for comparative CT method, E = 10(-1/Slope) - 1, where E: PCR efficiency; Slope: Slope of calibration curve. DKK: Dickkopf.
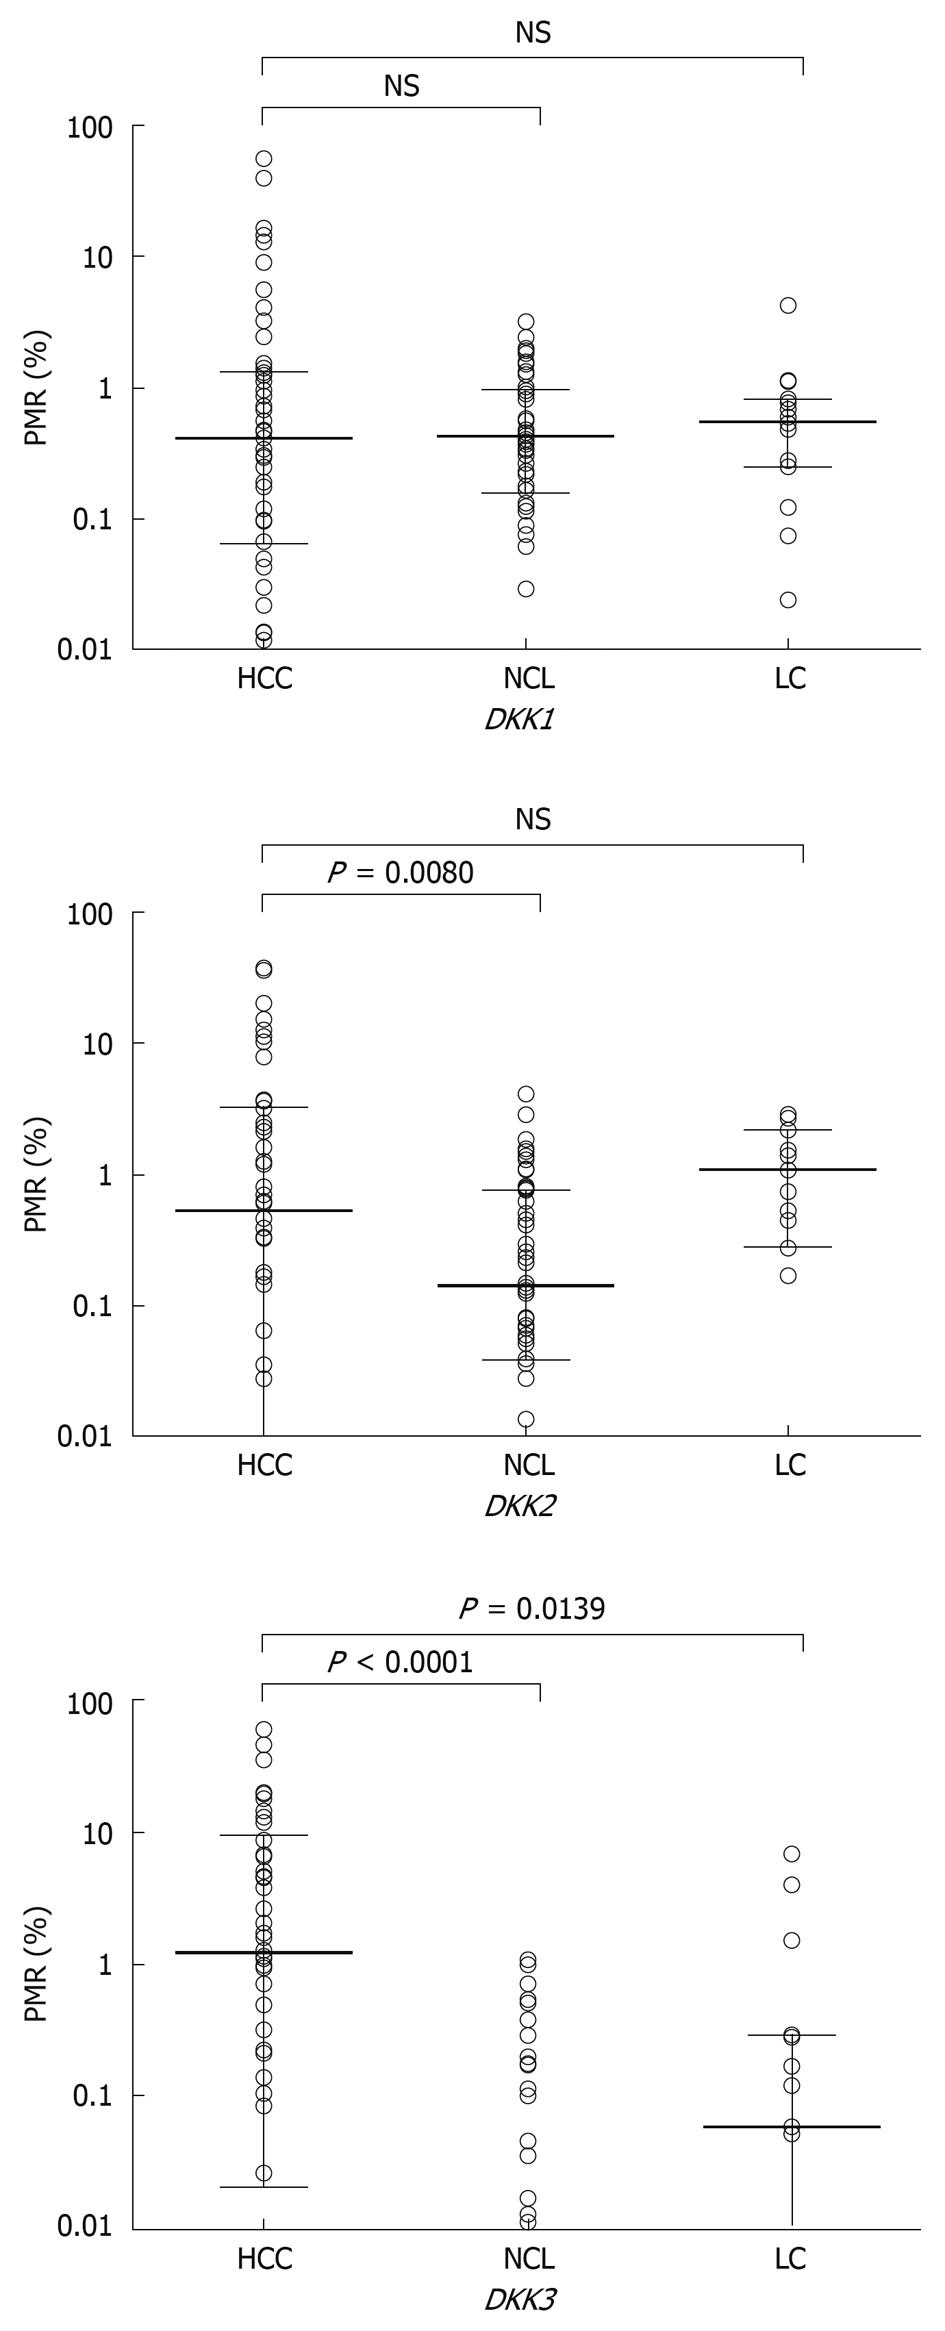
Figure 2 Methylation levels of DKK family genes in hepatocellular carcinoma (HCC) and corresponding noncancerous cirrhotic liver (NCL) tissue samples and liver cirrhosis (LC) biopsy samples.
Horizontal bar denotes the median PMR value, and range indicates 25%-75% quartile.
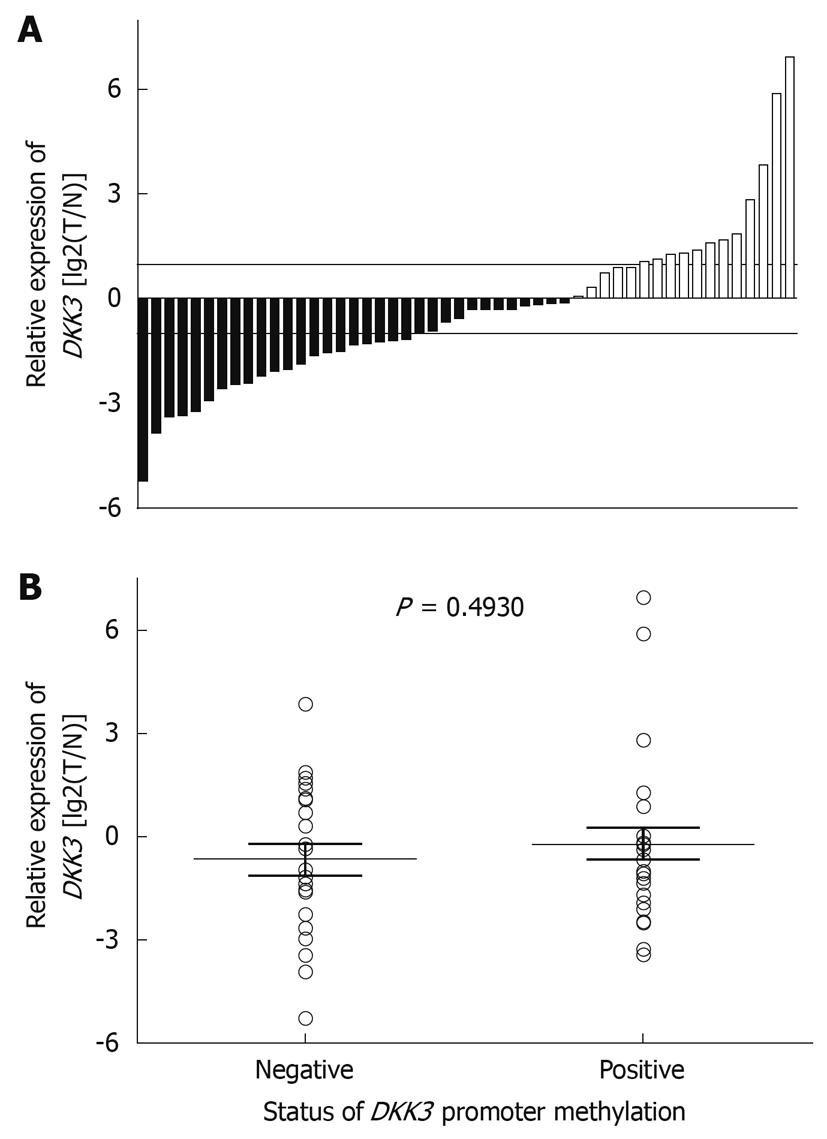
Figure 3 Expression of DKK3 mRNA in HCC (A) and NCL (B) tissue samples.
Horizontal lines represent the median FC value, and range indicates 25%-75% quartile.
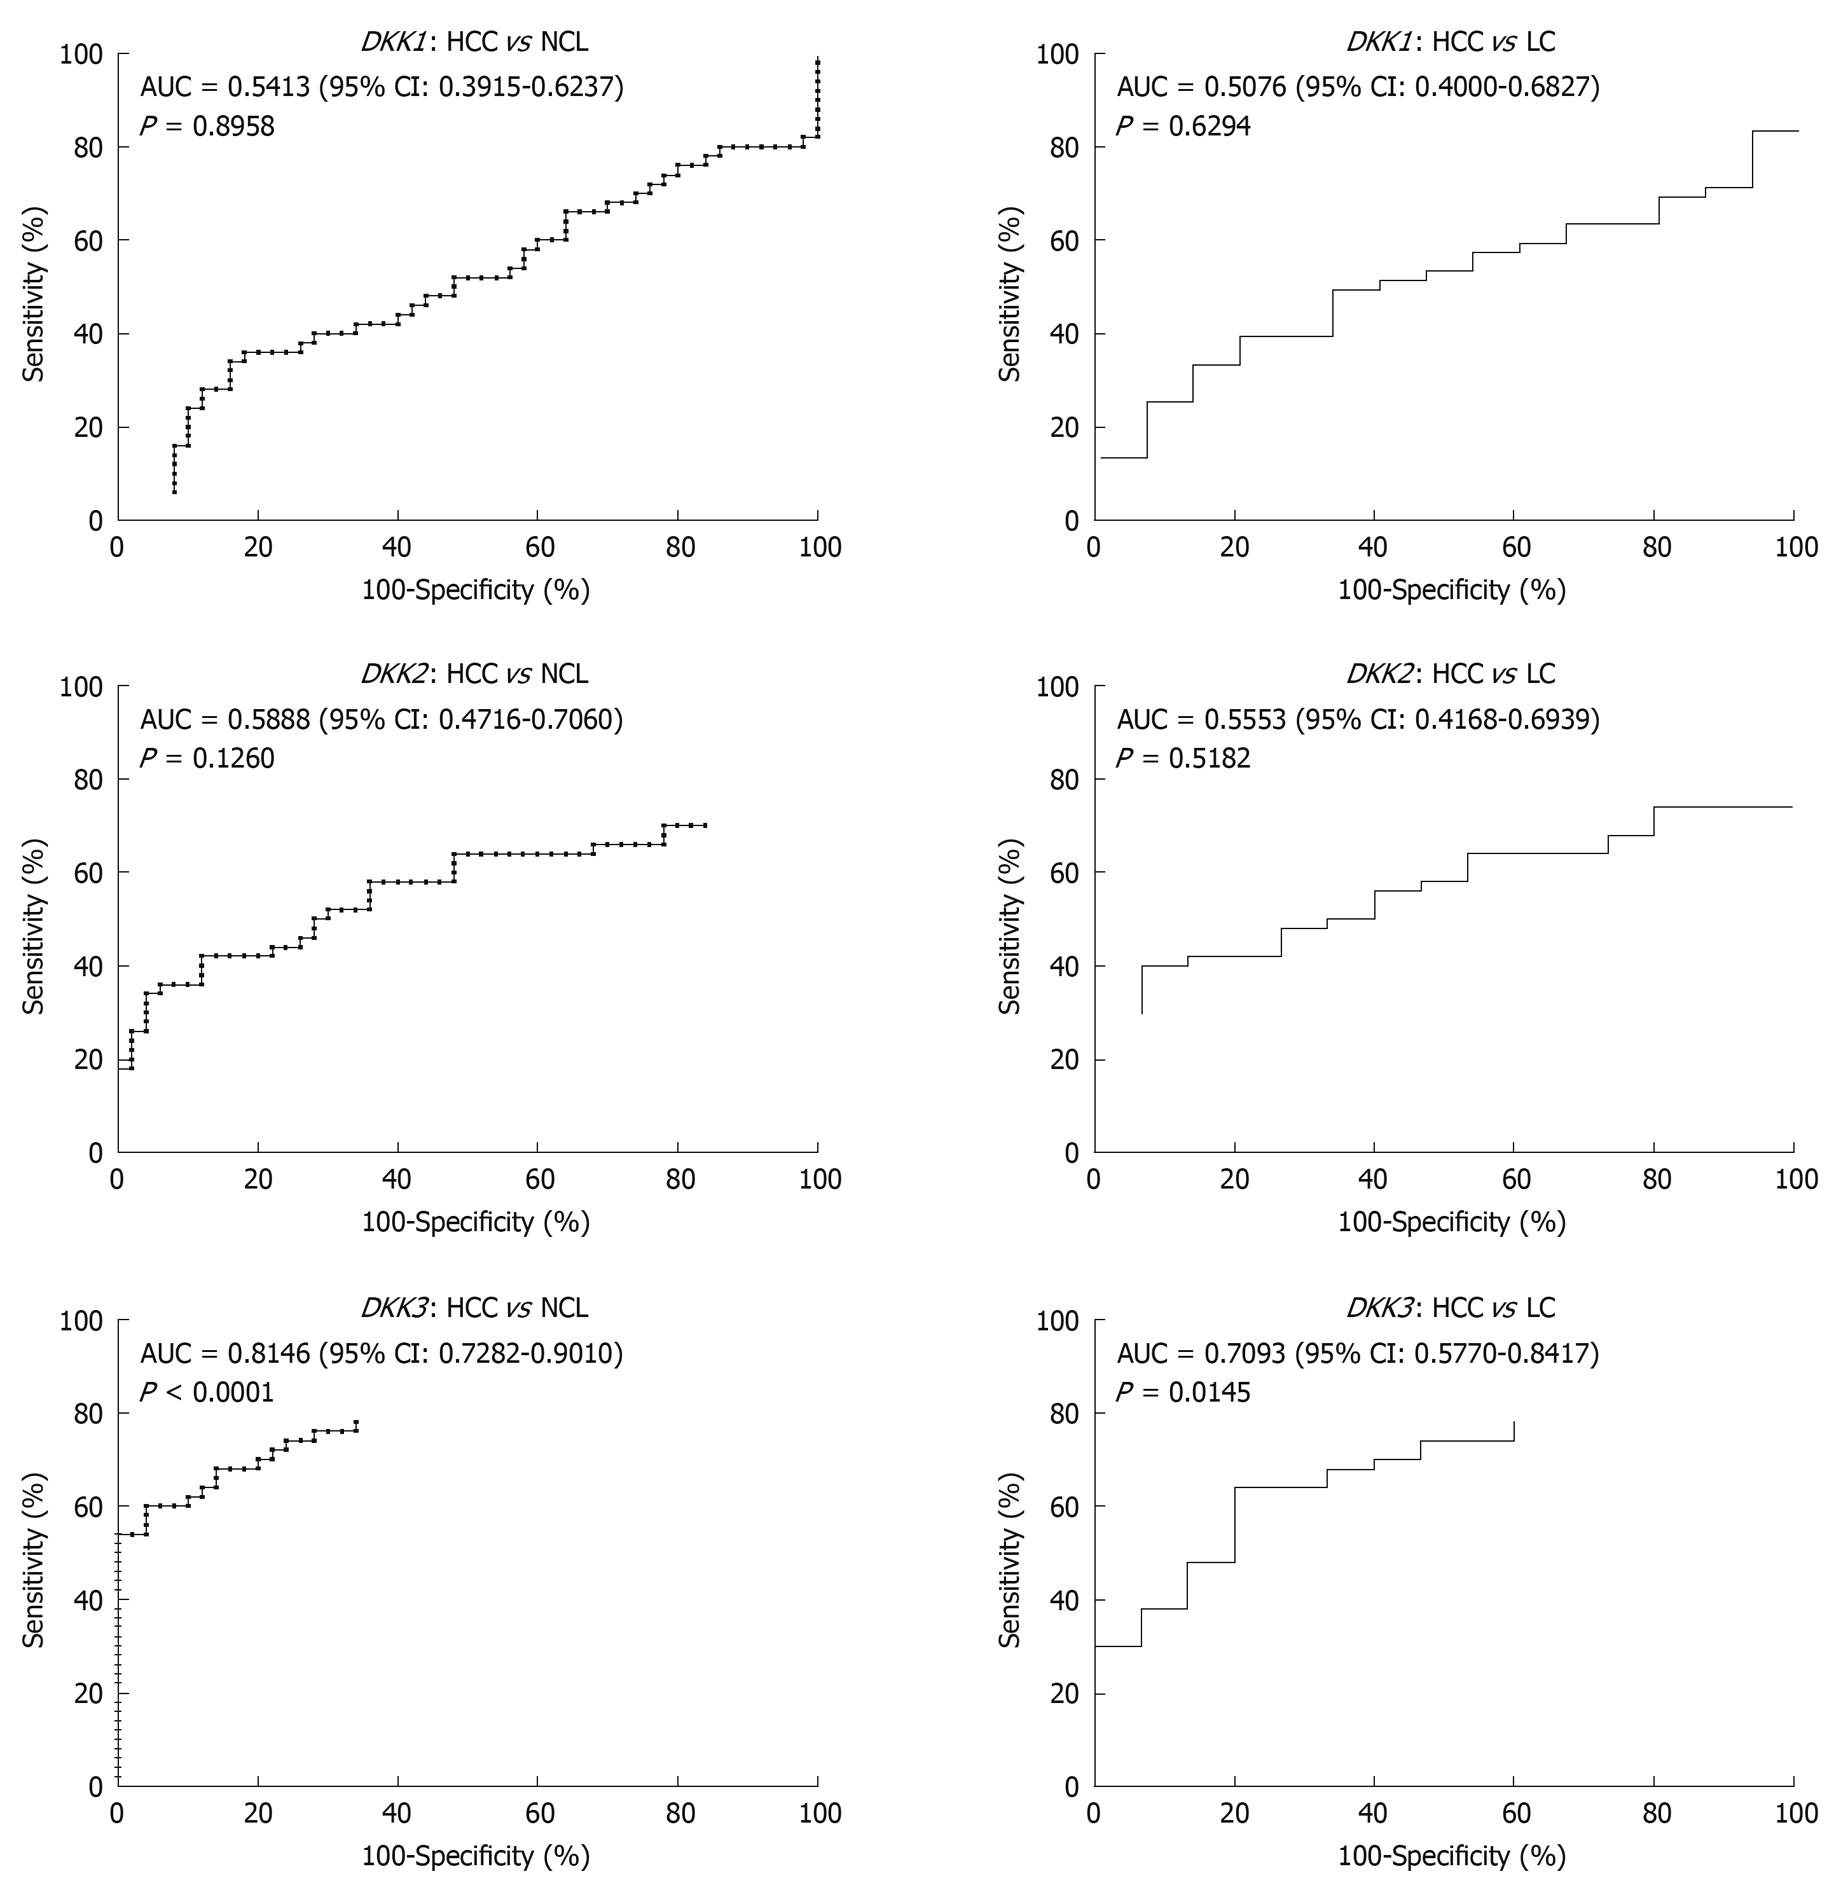
Figure 4 ROC curves for DKK genes used to evaluate the ability of methylation levels to distinguish tumor tissue samples from cirrhotic tissue samples.
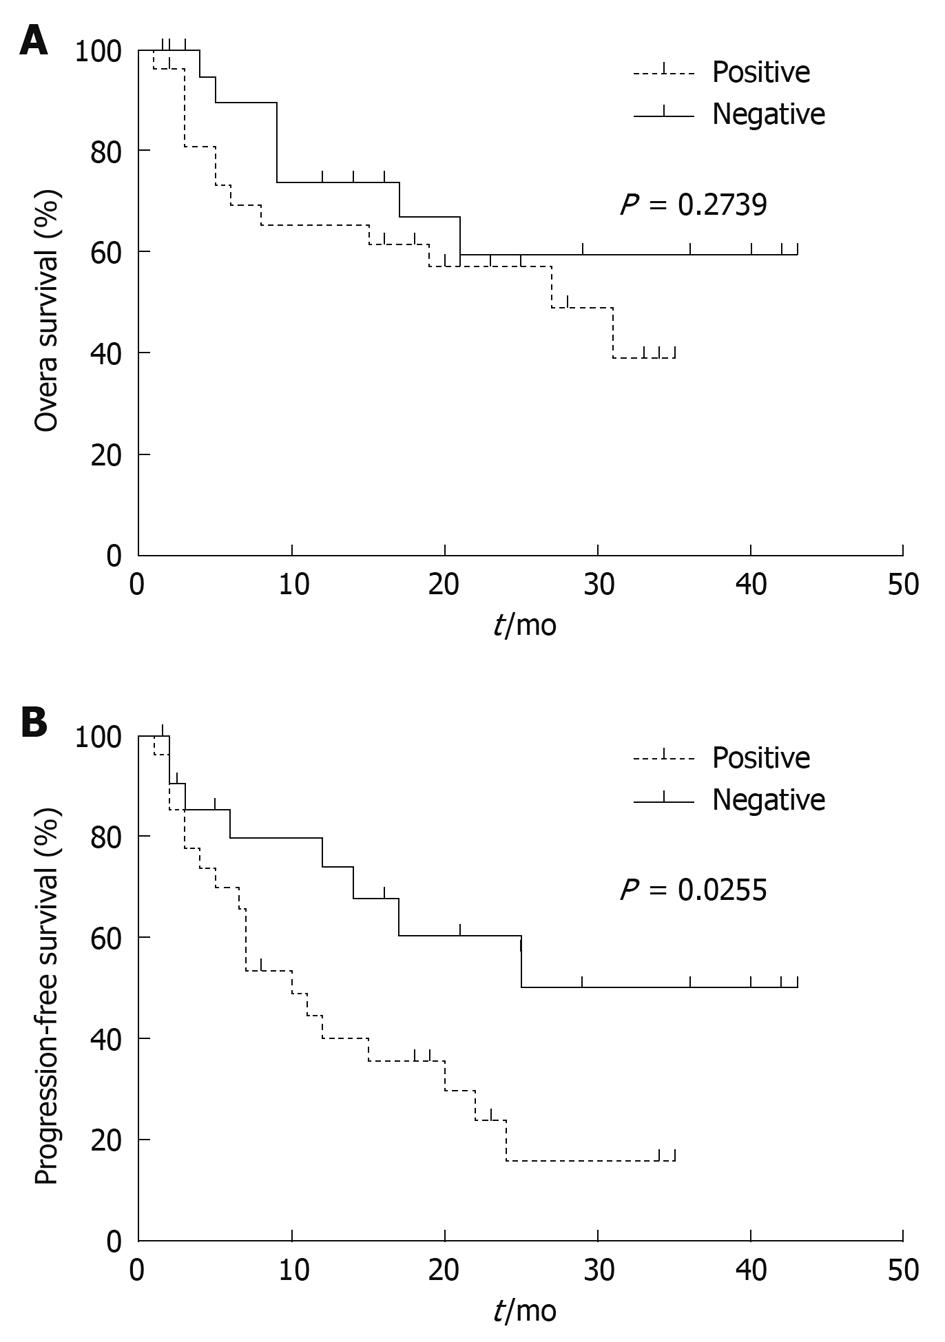
Figure 5 Overall (A) and progression-free (B) survival analysis of patients with different DKK3 methylation levels.
-
Citation: Yang B, Du Z, Gao YT, Lou C, Zhang SG, Bai T, Wang YJ, Song WQ. Methylation of
Dickkopf-3 as a prognostic factor in cirrhosis-related hepatocellular carcinoma. World J Gastroenterol 2010; 16(6): 755-763 - URL: https://www.wjgnet.com/1007-9327/full/v16/i6/755.htm
- DOI: https://dx.doi.org/10.3748/wjg.v16.i6.755


