Copyright
©2010 Baishideng.
World J Gastroenterol. Feb 14, 2010; 16(6): 713-722
Published online Feb 14, 2010. doi: 10.3748/wjg.v16.i6.713
Published online Feb 14, 2010. doi: 10.3748/wjg.v16.i6.713
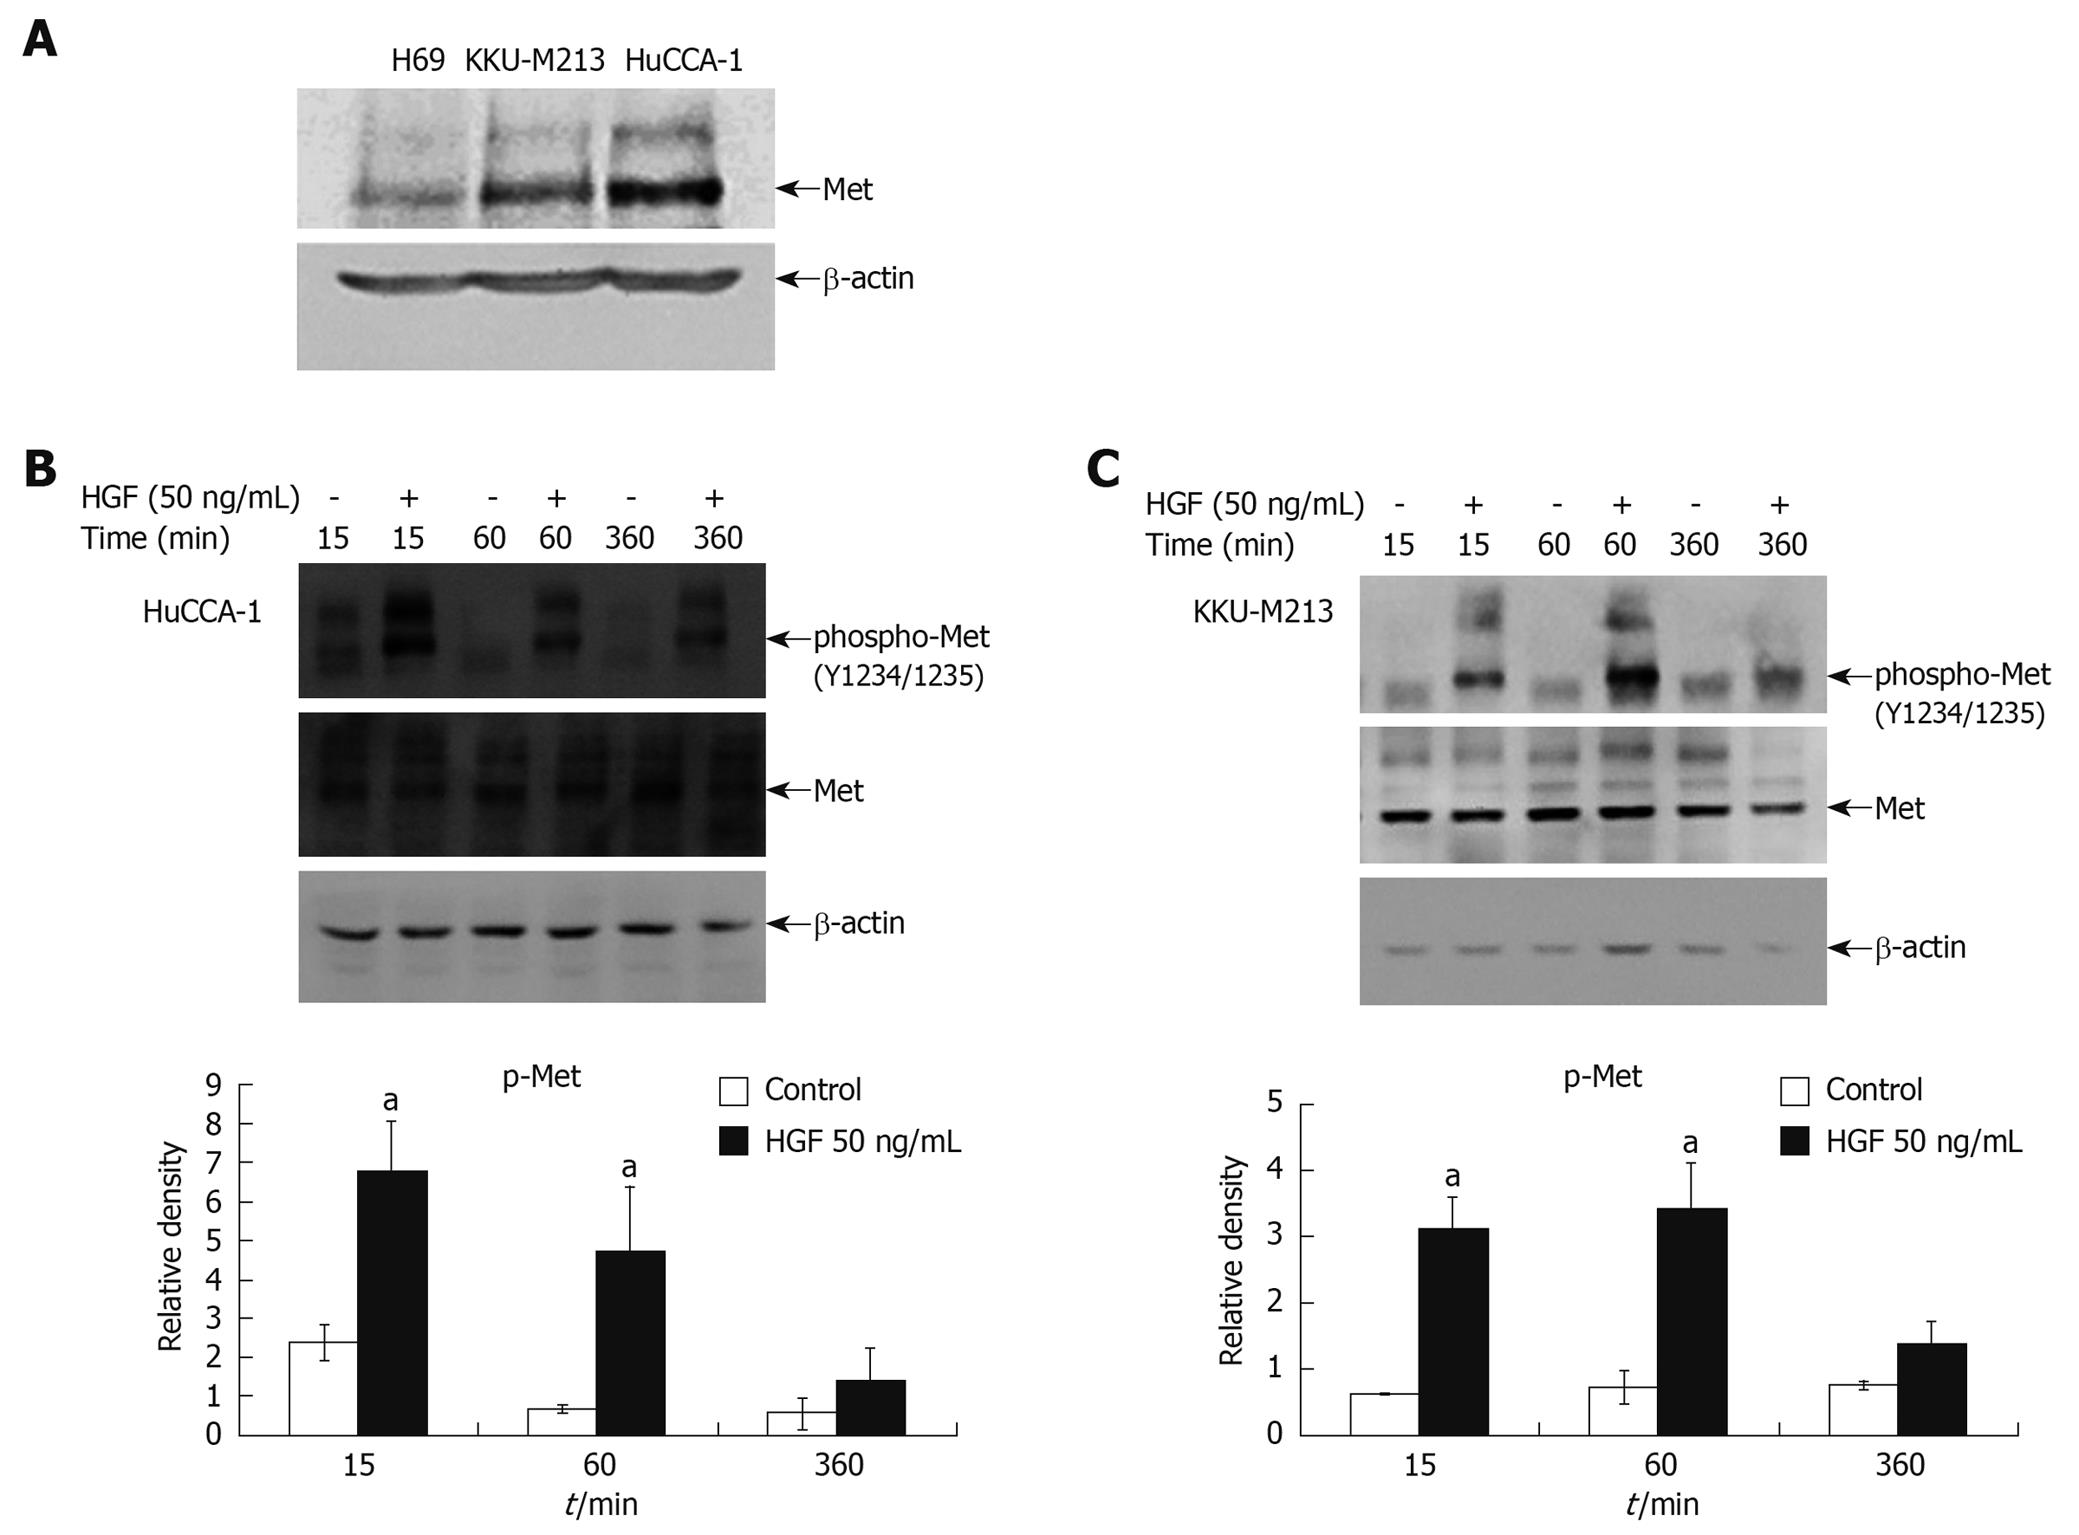
Figure 1 Steady state level of Met expression in cholangiocarcinoma cell lines and activation by hepatocyte growth factor (HGF).
Cell lysates from 80% confluent cells cultured in 10% fetal bovine serum (FBS) medium were examined for Met expression by Western blotting analysis (A). Lysates from HuCCA-1 (B) and KKU-M213 (C) cells treated with or without 50 ng/mL HGF for various times were analyzed by Western blotting for levels of Met and phospho-Met (pY1234/1235). The graphs show band densities of phospho-Met relative to those at zero time points. Data are presented as mean ± SE of results obtained from three independent experiments. aP < 0.05 vs untreated control.
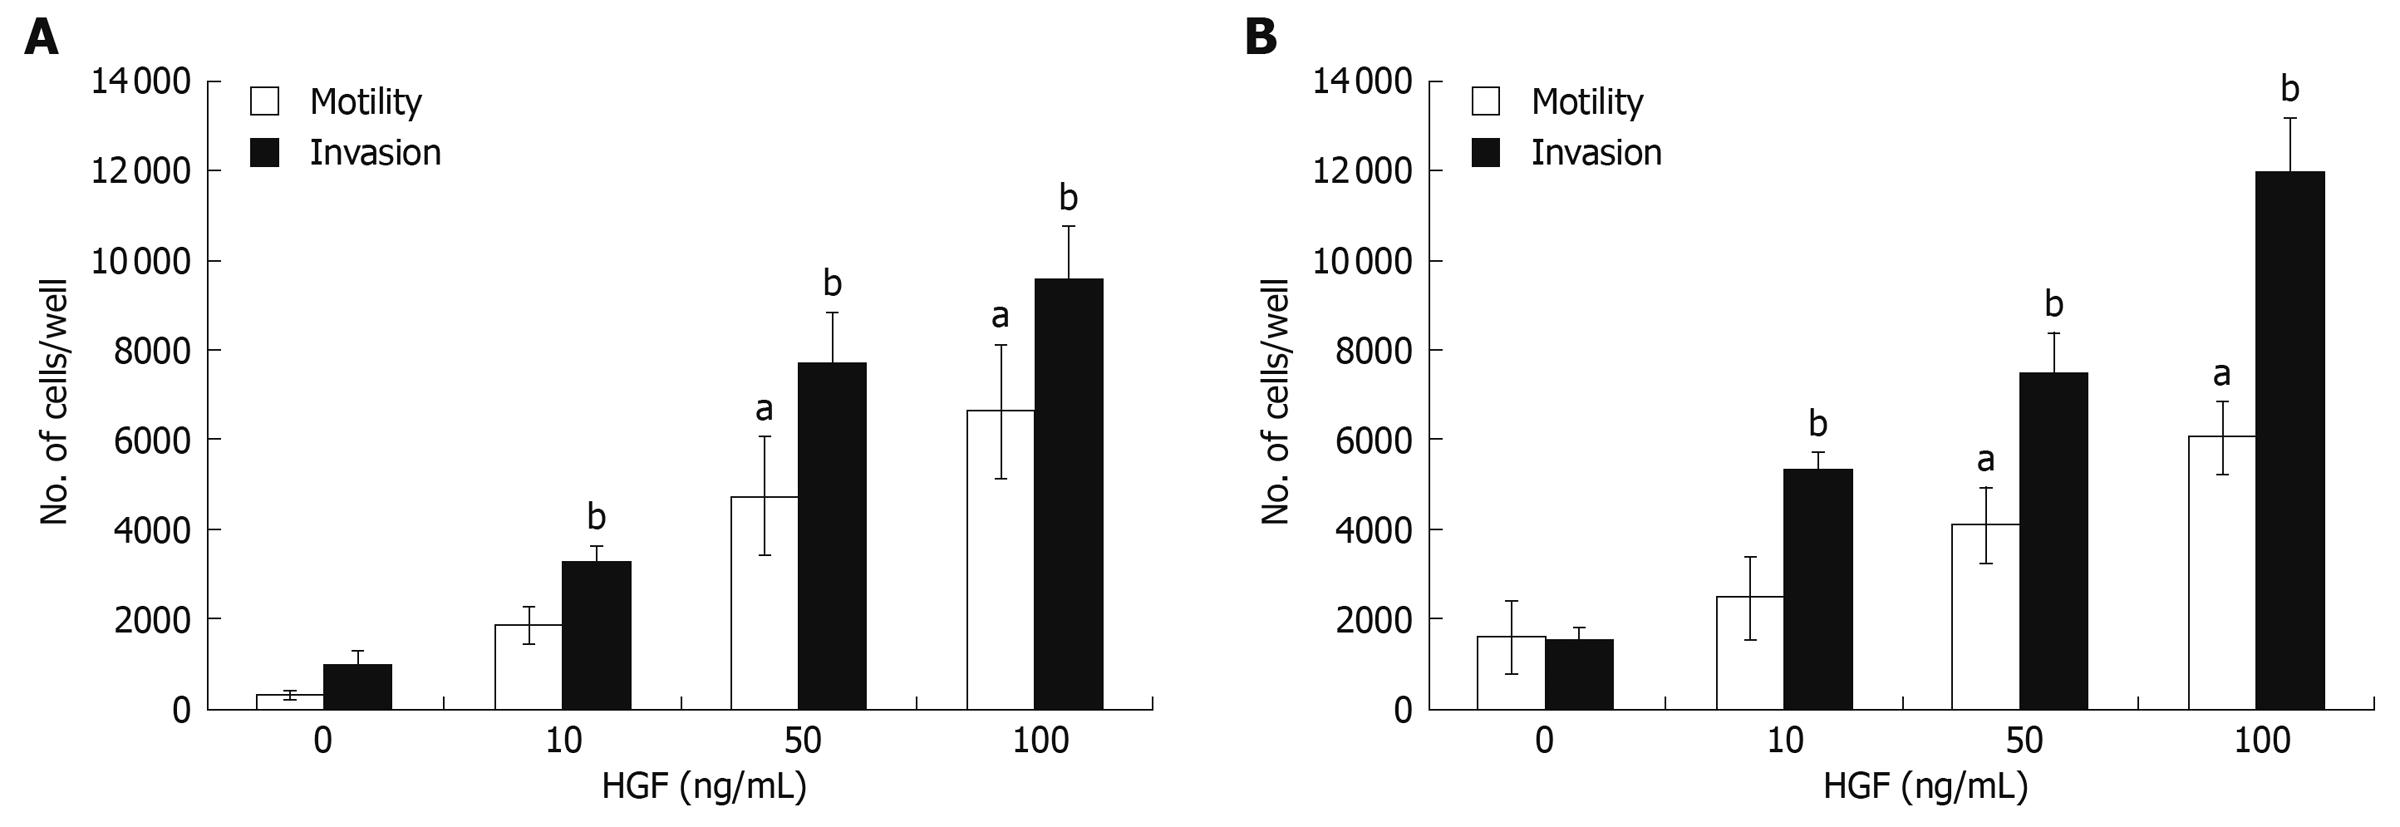
Figure 2 HGF induction of cholangiocarcinoma motility and invasiveness.
In vitro invasion and motility assays of HuCCA-1 (A) and KKU-M213 (B) cells were conducted in a Transwell unit coated with and without Matrigel. Cells (105) in serum-free medium were plated in the upper chamber of a Transwell unit and 0-100 ng/mL HGF added to the lower chamber. After 6 h of incubation, cells invading to the lower compartment of the Transwell unit were stained and counted. The numbers of invaded/motile cells are presented as mean ± SE of results obtained from three independent experiments. aP < 0.05, bP < 0.01, vs untreated control.
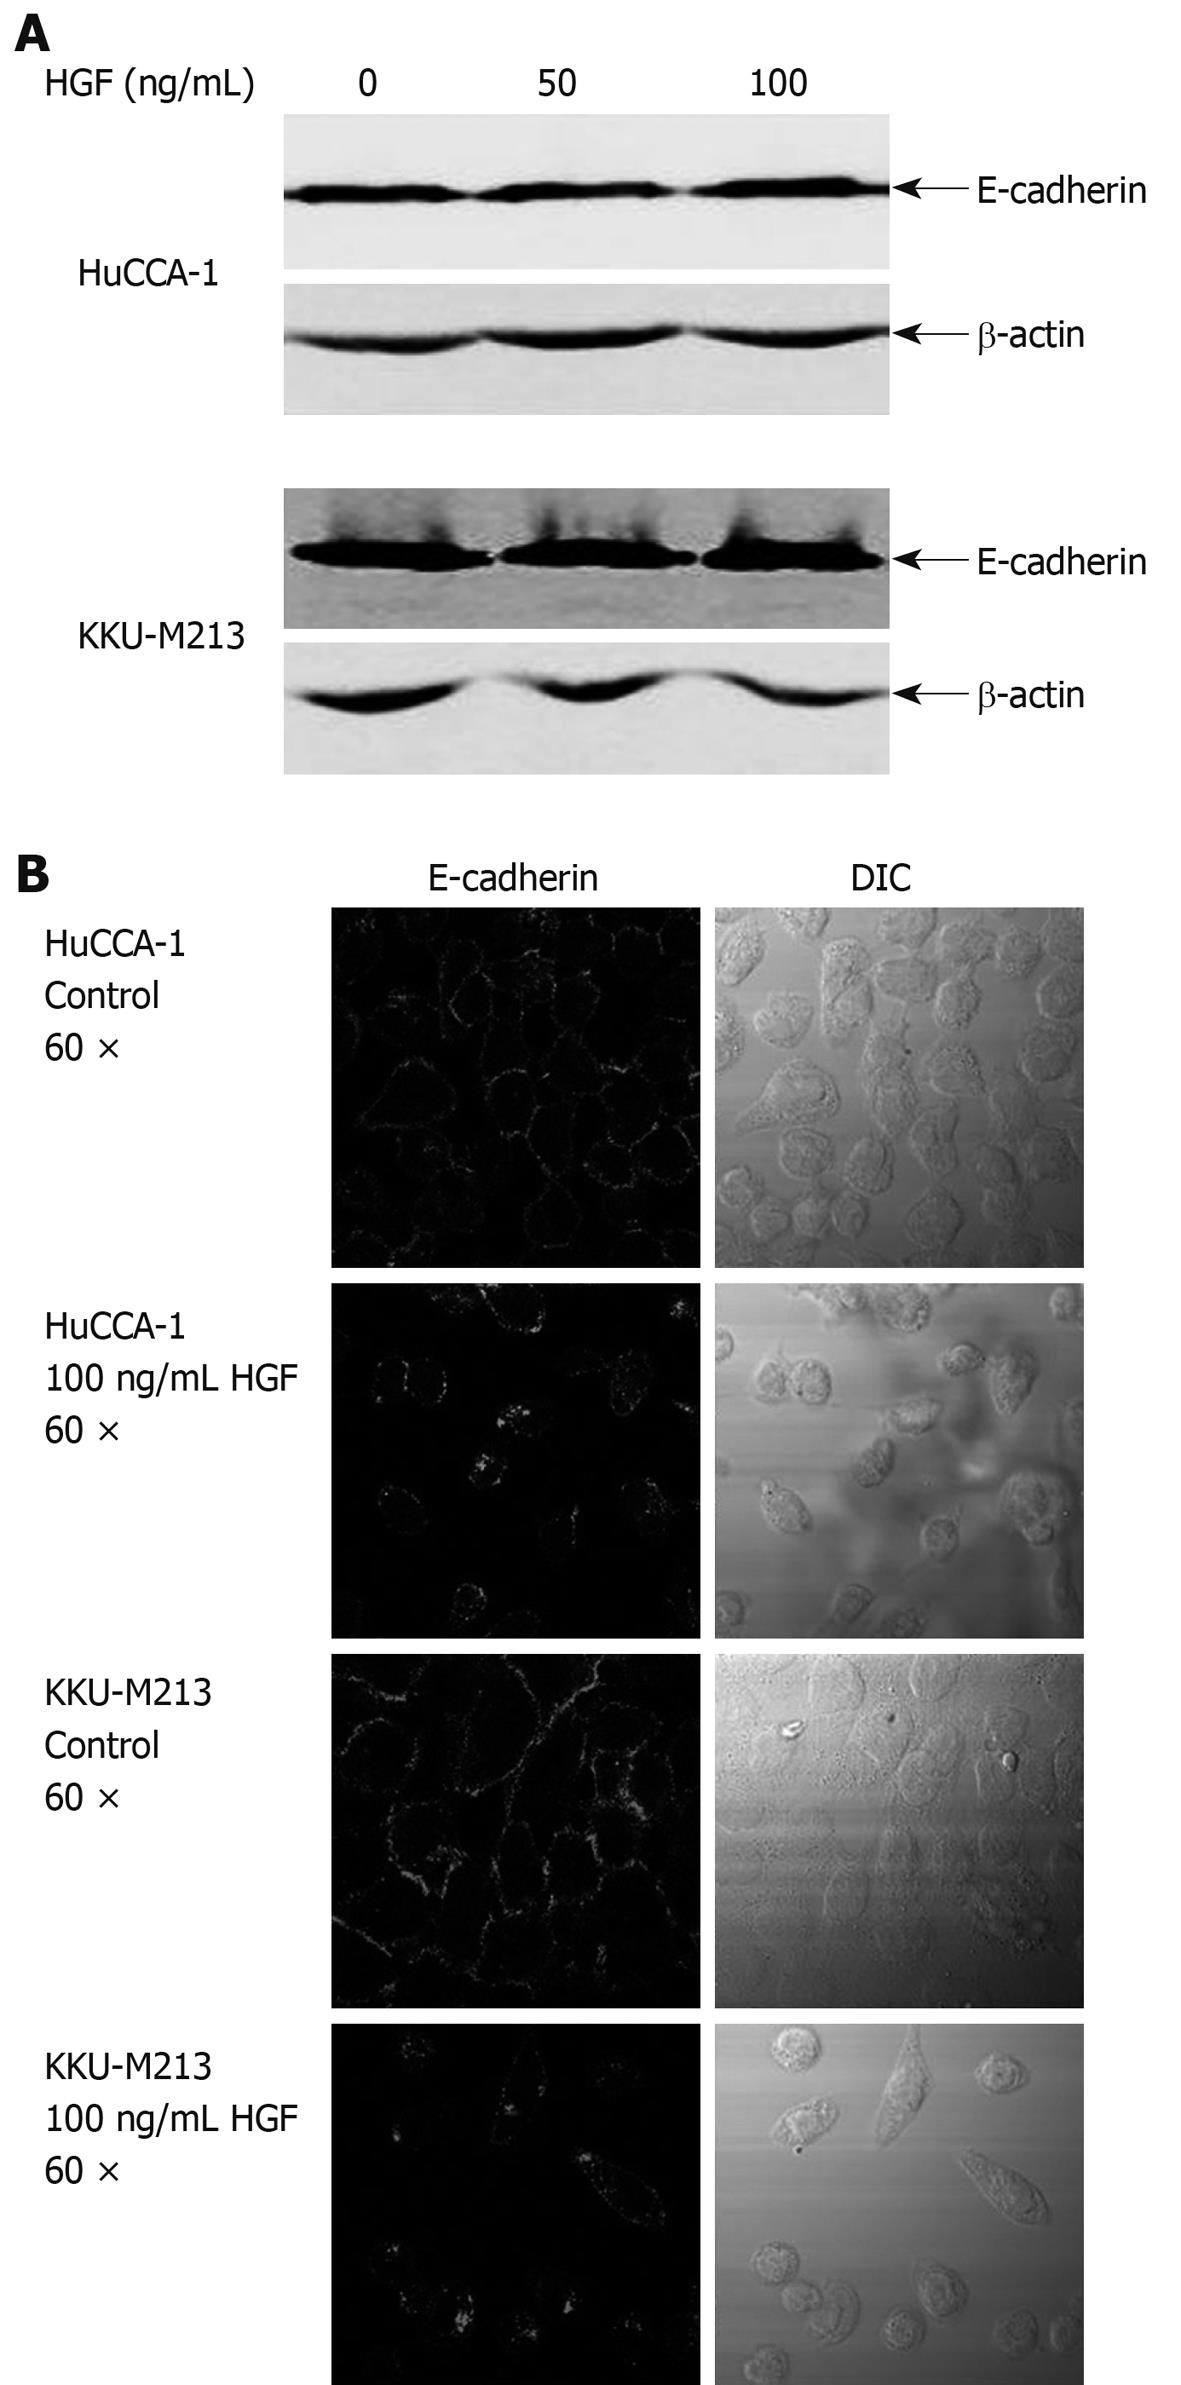
Figure 3 Effects of HGF on E-cadherin expression and localization.
A: cholangiocarcinoma (CCA) cells were treated with HGF for 6 h, then cell lysate was analyzed by Western blotting with anti-E-cadherin and -β-actin monoclonal antibodies; B: After treatment with 0 and 100 ng/mL HGF for 6 h, cells were analyzed by immunofluorescence using anti-E-cadherin antibody and visualized under confocal laser scanning microscopy (60 × objective magnification plus 2 × digital magnification).
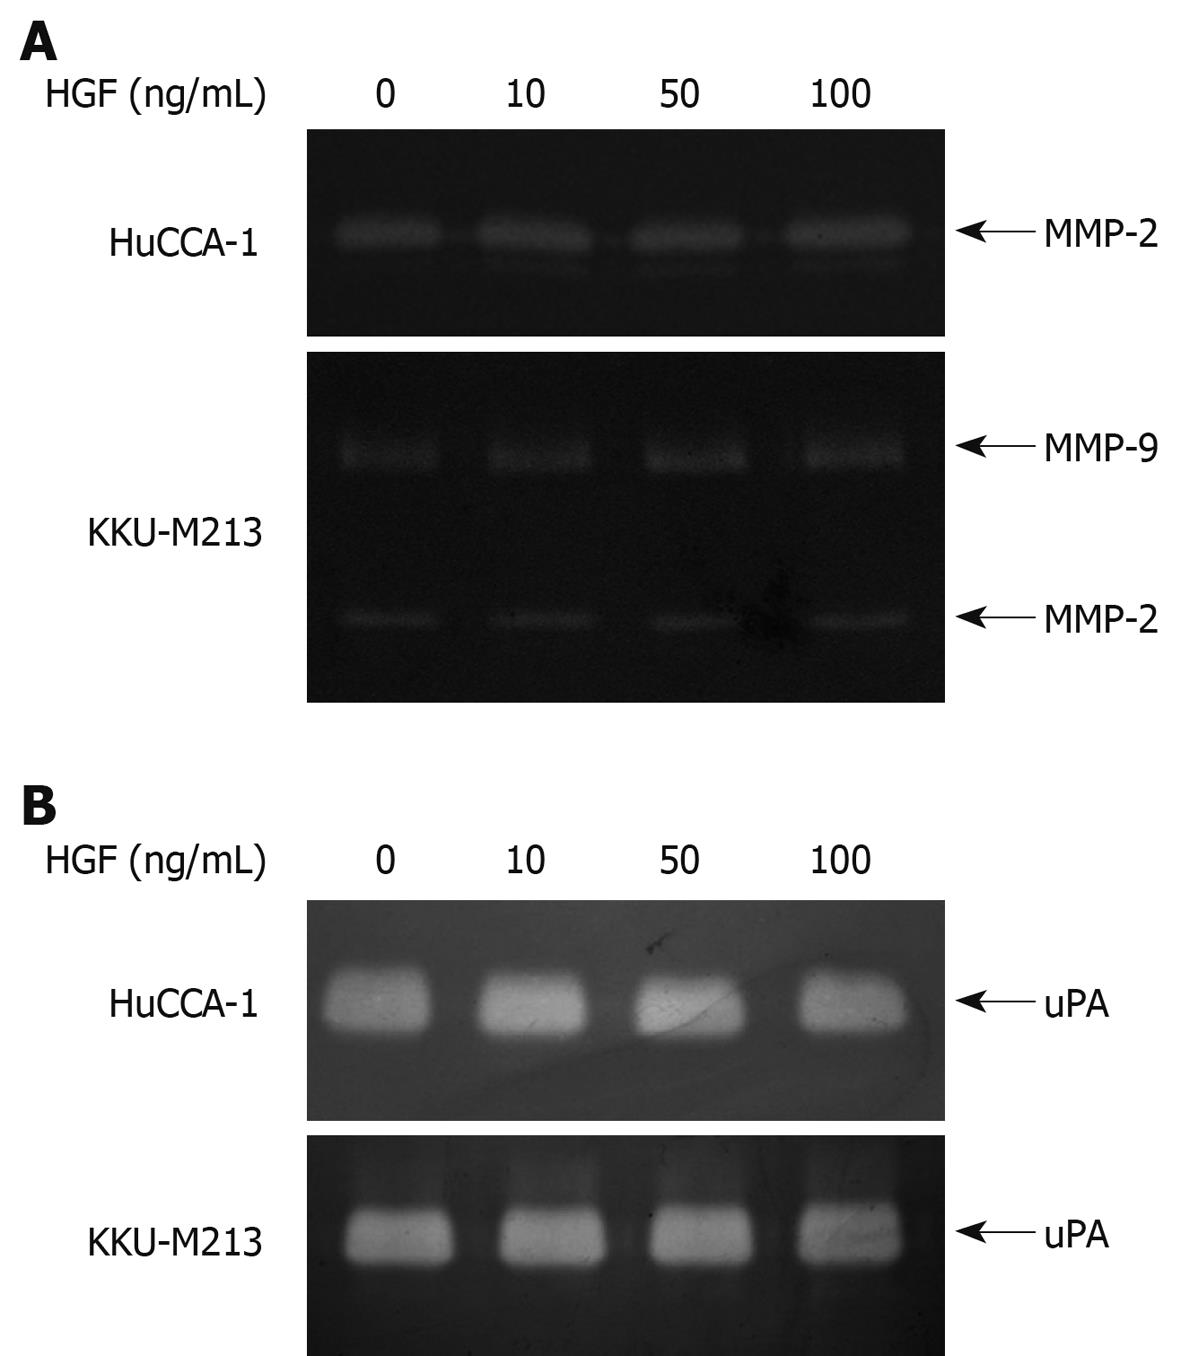
Figure 4 Effect of HGF on levels of secreted matrix degrading enzymes from cholangiocarcinoma HuCCA-1 and KKU-M213 cell lines.
Cells were treated with various concentrations of HGF (0-100 ng/mL) in serum-free medium for 6 h. Conditioned media were then analyzed for MMP-2 (approximate 65 kDa) and MMP-9 (approximate 85 kDa) gelatinolytic activity by gelatin zymography (A) and for uPA by plasminogen-gelatin zymography (B).
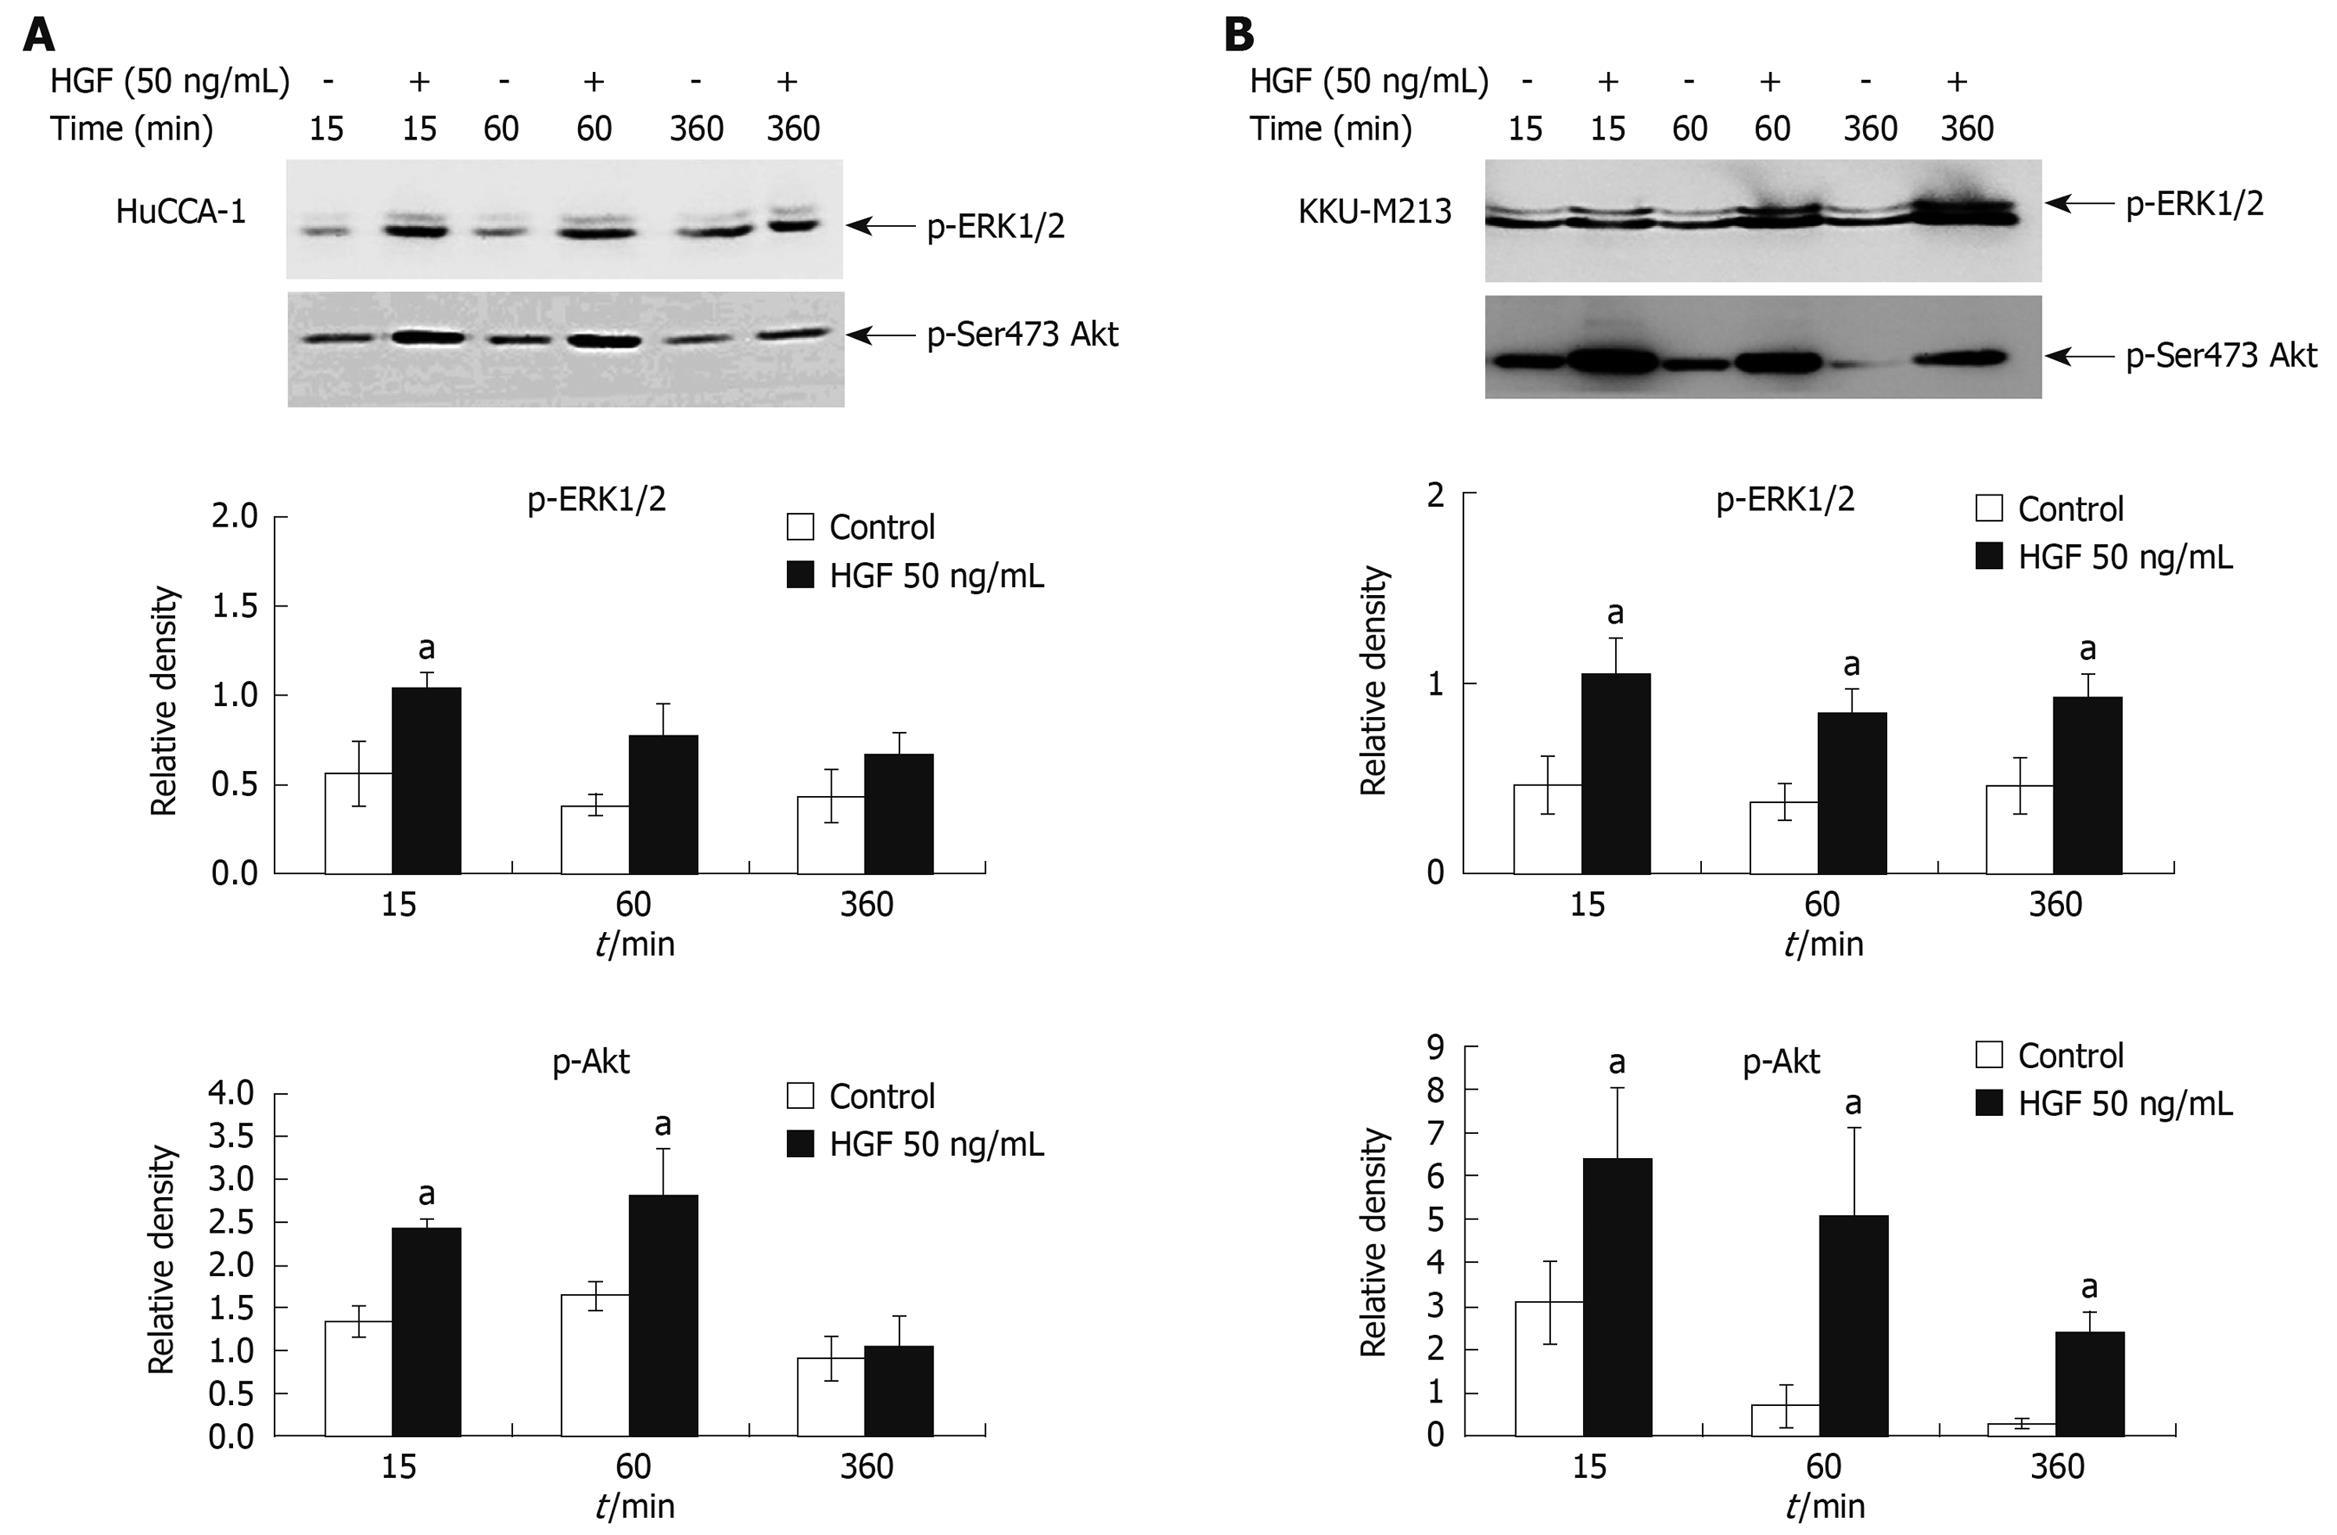
Figure 5 HGF induction of ERK1/2 and Akt phosphorylation in cholangiocarcinoma HuCCA-1 and KKU-M213 cell lines.
About 80% confluent cells were treated with 50 ng/mL HGF in serum-free medium for 15, 60, 360 min. Lysates from HuCCA-1 (A) and KKU-M213 (B) cells were assessed for total and phosphorylated forms of ERK1/2 and Akt by Western blotting assay. The graphs showed band densities of phospho-ERK1/2 and phospho-Akt relative to those at zero time points. Data are presented as mean ± SE of results obtained from three independent experiments. aP < 0.05 vs untreated control.
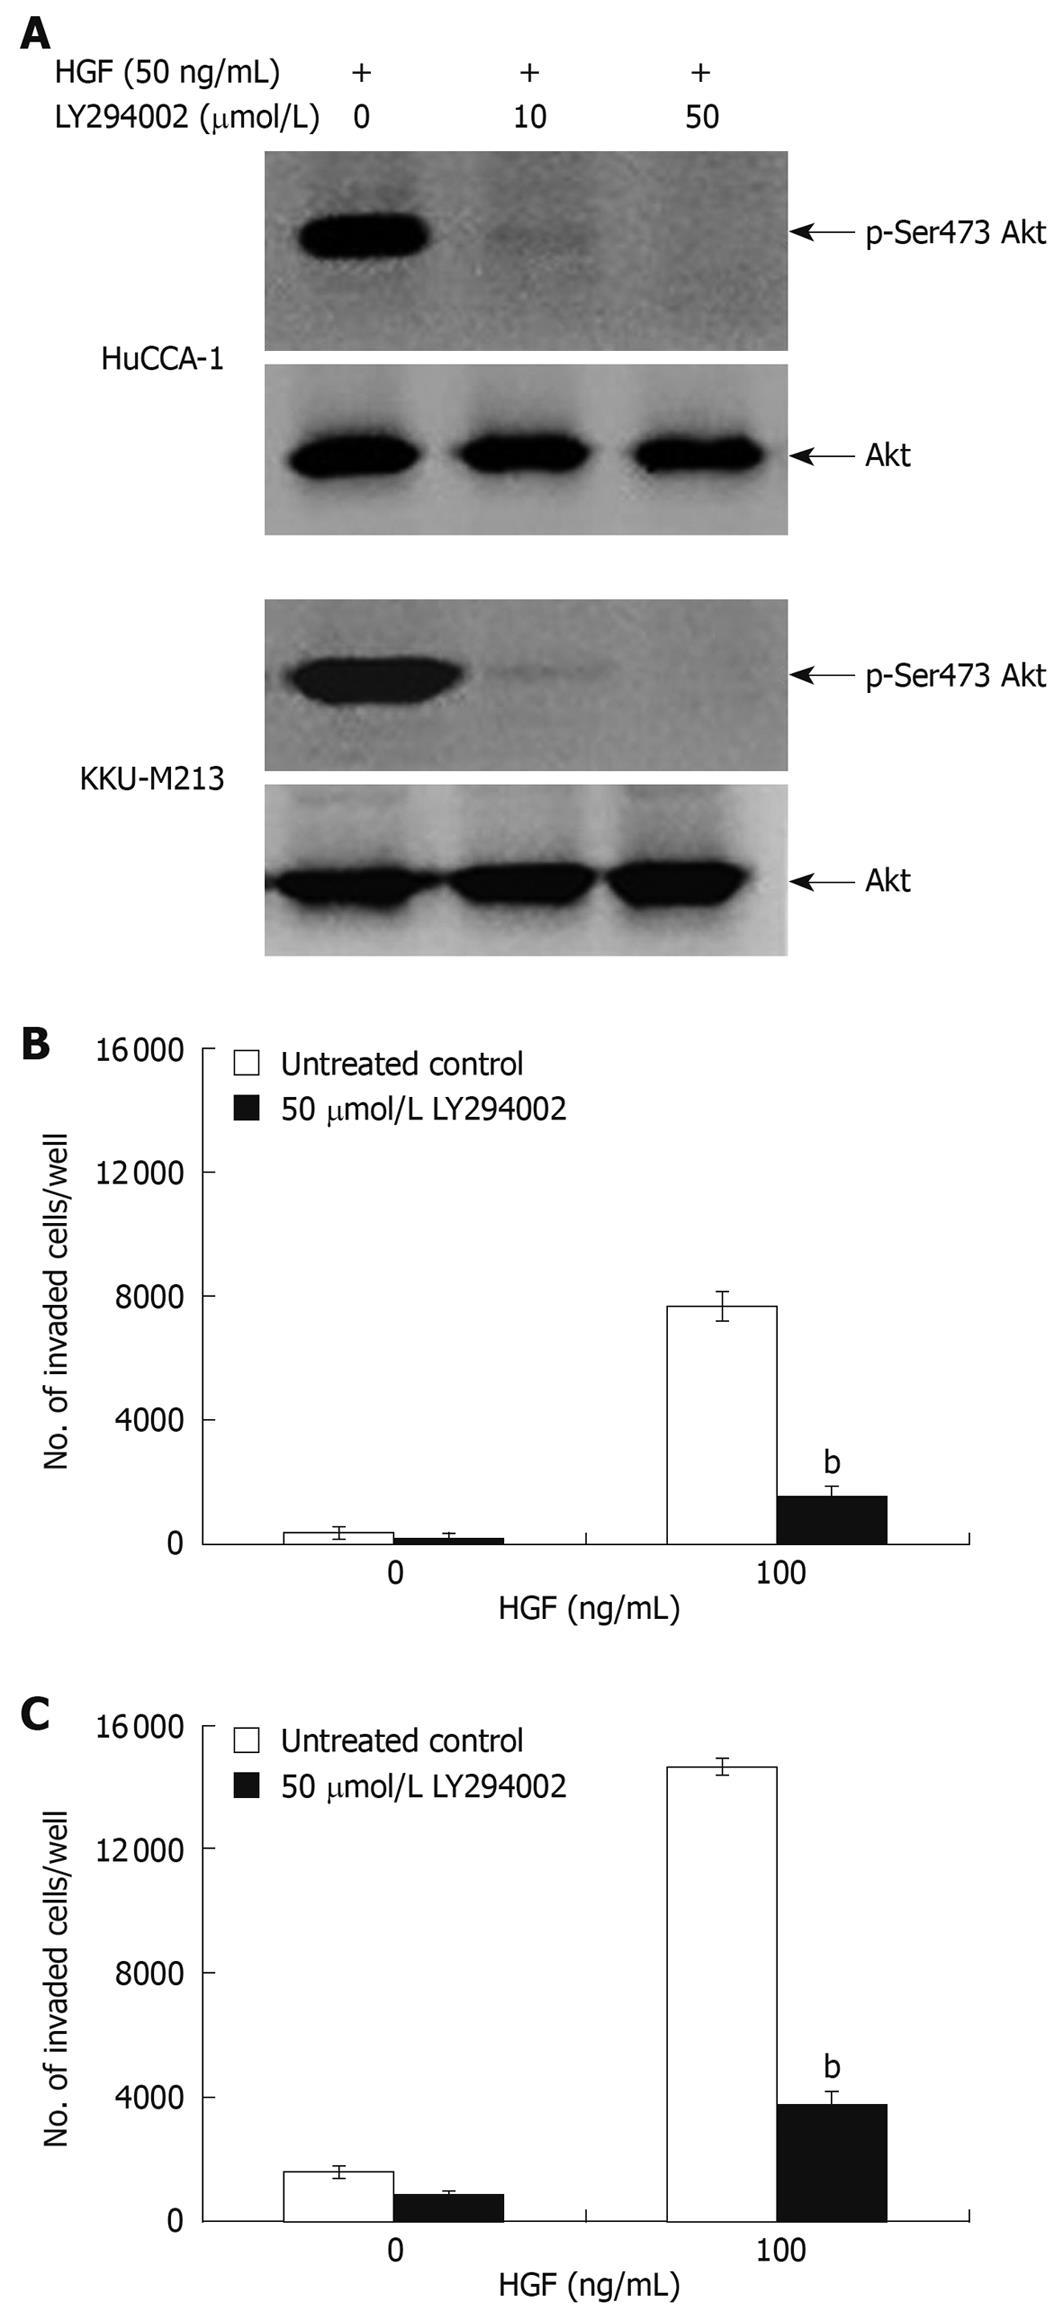
Figure 6 Suppression of HGF-induced cholangiocarcinoma cell invasiveness by PI3-kinase inhibitor, LY294002.
HuCCA-1 and KKU-M213 cells were treated with 50 ng/mL HGF in the absence (control) or presence of 10 and 50 μmol/L LY294002 for 6 h, and subsequently Akt phosphorylation was determined by Western blotting (A). In vitro invasion of HuCCA-1 (B) and KKU-M213 (C) cells was evaluated in the absence or presence of HGF with or without 50 μmol/L LY294002. Numbers of invaded cells are presented as mean ± SE of results obtained from three independent experiments. bP < 0.01 vs control.
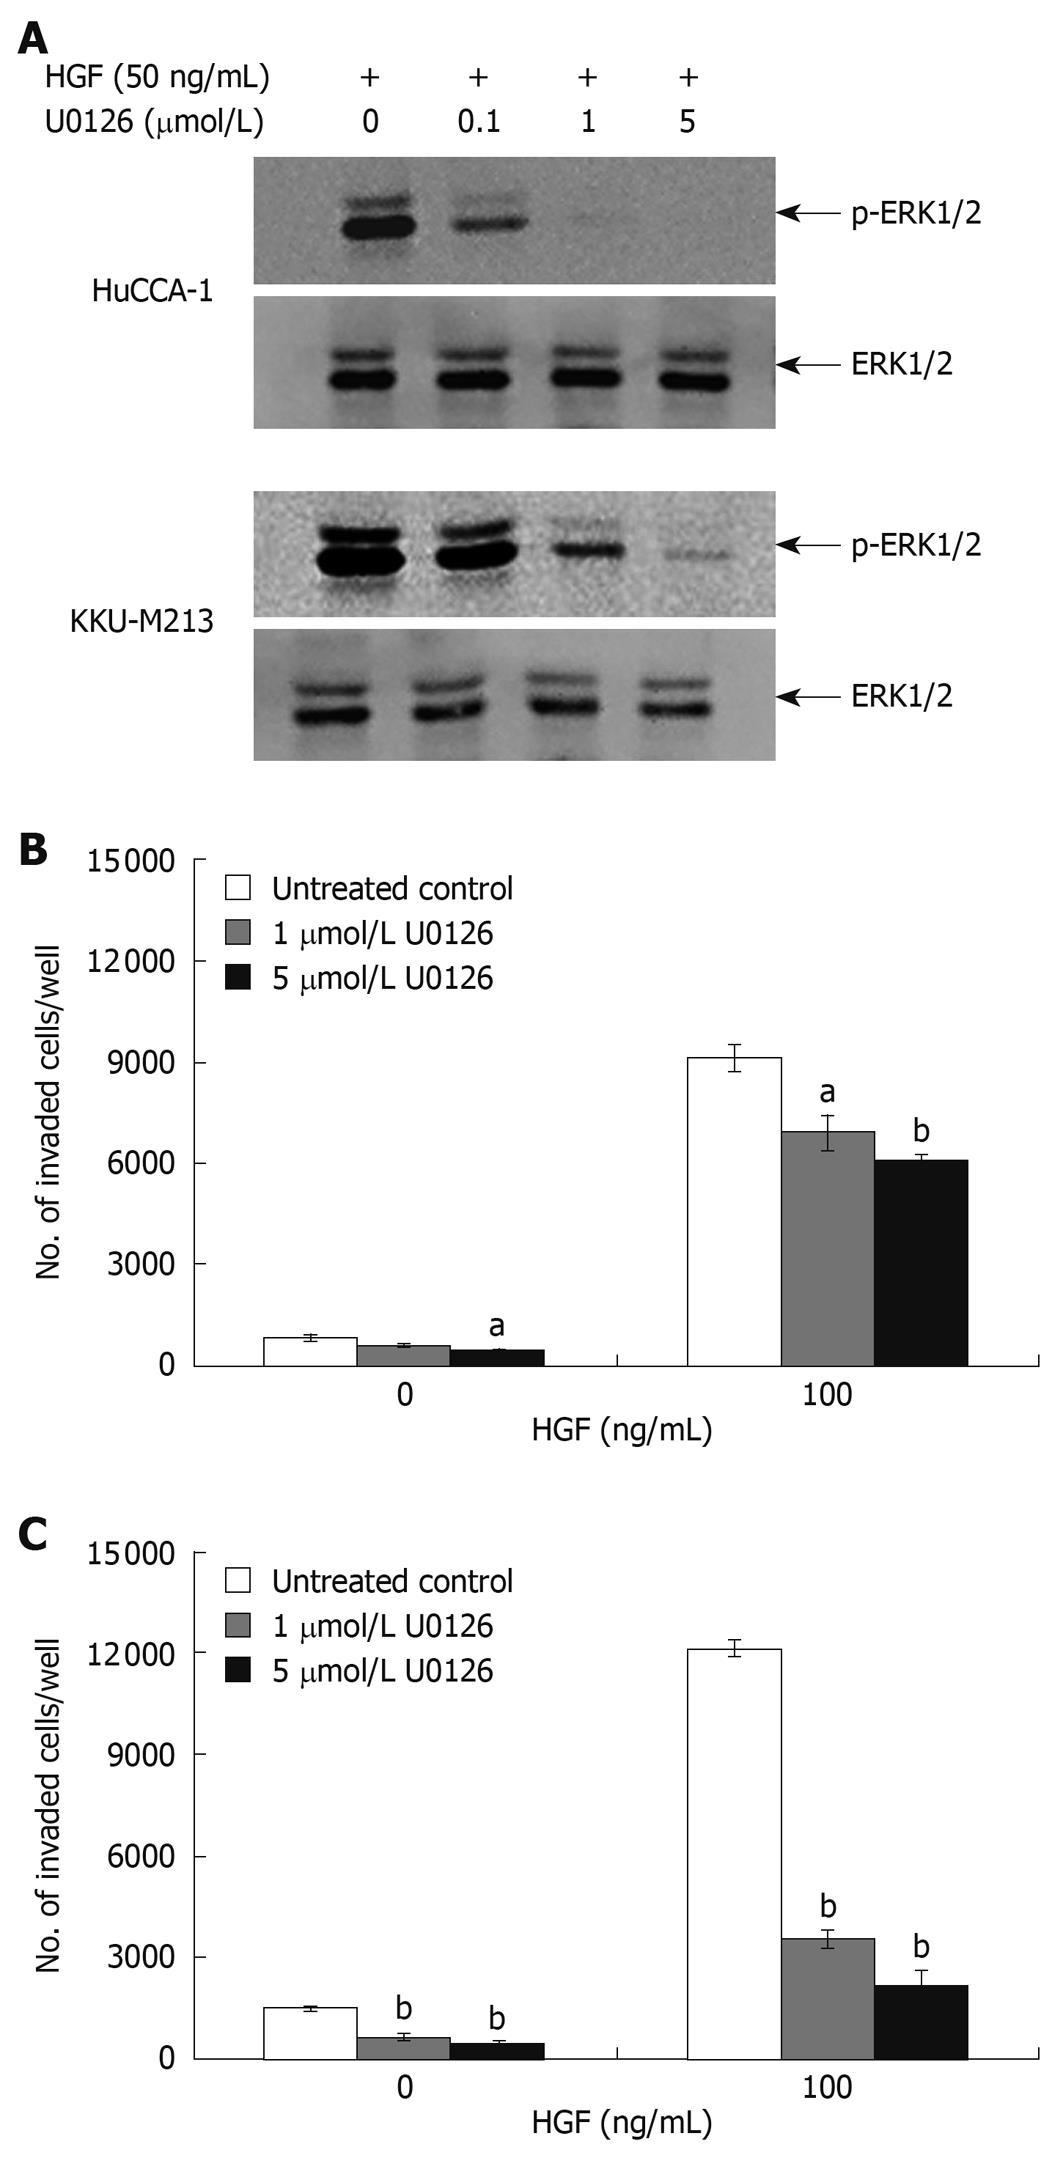
Figure 7 Suppression of HGF-induced cholangiocarcinoma cell invasiveness by MEK1 inhibitor, U0126.
HuCCA-1 and KKU-M213 cells were treated with 50 ng/mL HGF in the absence (control) or presence of 0.1, 1 and 5 μmol/L U0126 for 6 h, and subsequently ERK1/2 phosphorylation was determined by Western blotting (A). In vitro invasion of HuCCA-1 (B) and KKU-M213 (C) cells was evaluated in the absence or presence of HGF with or without 1 and 5 μmol/L U0126. Numbers of invaded cells are presented as mean ± SE of results obtained from three independent experiments. aP < 0.05 and bP < 0.01 vs control.
- Citation: Menakongka A, Suthiphongchai T. Involvement of PI3K and ERK1/2 pathways in hepatocyte growth factor-induced cholangiocarcinoma cell invasion. World J Gastroenterol 2010; 16(6): 713-722
- URL: https://www.wjgnet.com/1007-9327/full/v16/i6/713.htm
- DOI: https://dx.doi.org/10.3748/wjg.v16.i6.713


