Copyright
©2010 Baishideng.
World J Gastroenterol. Feb 7, 2010; 16(5): 563-570
Published online Feb 7, 2010. doi: 10.3748/wjg.v16.i5.563
Published online Feb 7, 2010. doi: 10.3748/wjg.v16.i5.563
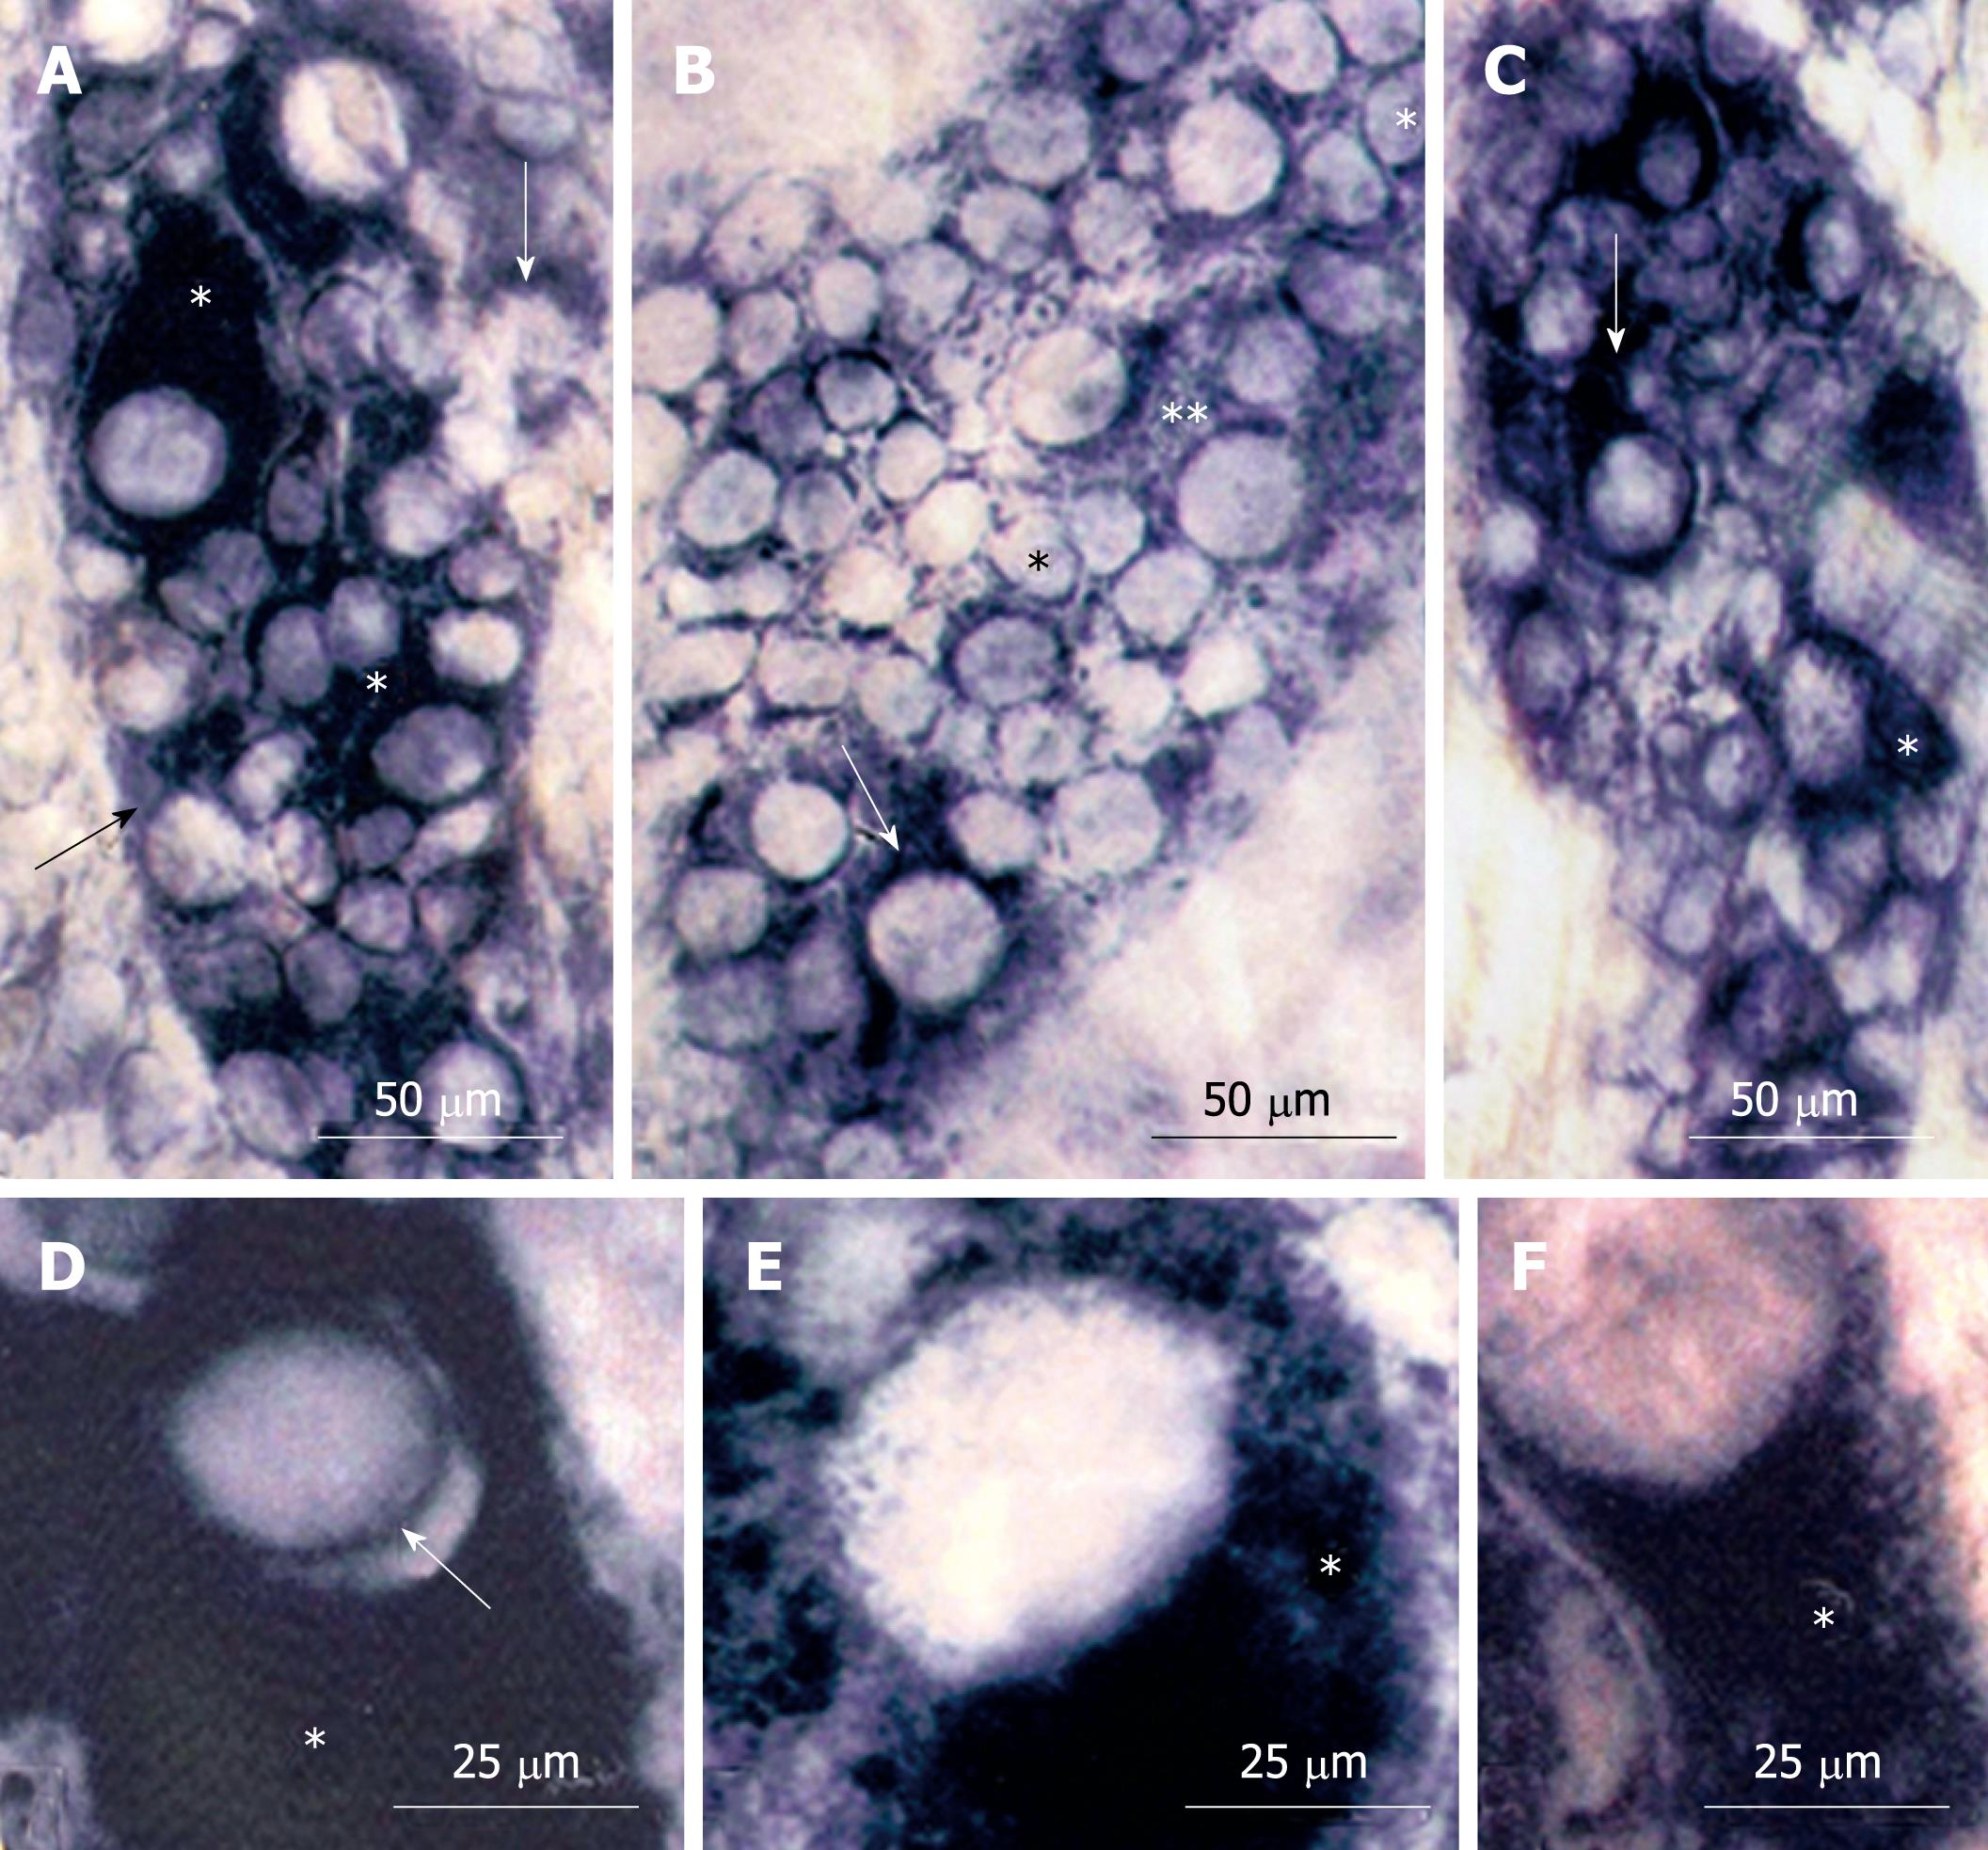
Figure 1 NADH-diaphorase reaction.
A: N42 group. Myenteric neurons of large and medium sizes with intensely reactive cytoplasm (*) and neurons of diverse size weakly reactive (arrows); B: D42 group. Nuclei of small neurons (*). The cytoplasm of large neurons had low (**) or diffuse (arrow) reactivity; C: R42 group. Note large neurons with intense (arrow) and diffuse (*) cytoplasmic reactivity; D-F: Large neurons, respectively from N42 (D), D42 (E) and R42 (F) groups. The well-delineated nucleus (arrow) from N42 was not clearly detected in malnourished and protein-recovered animals. Compare the patterns of reactivity of the cytoplasm (*).
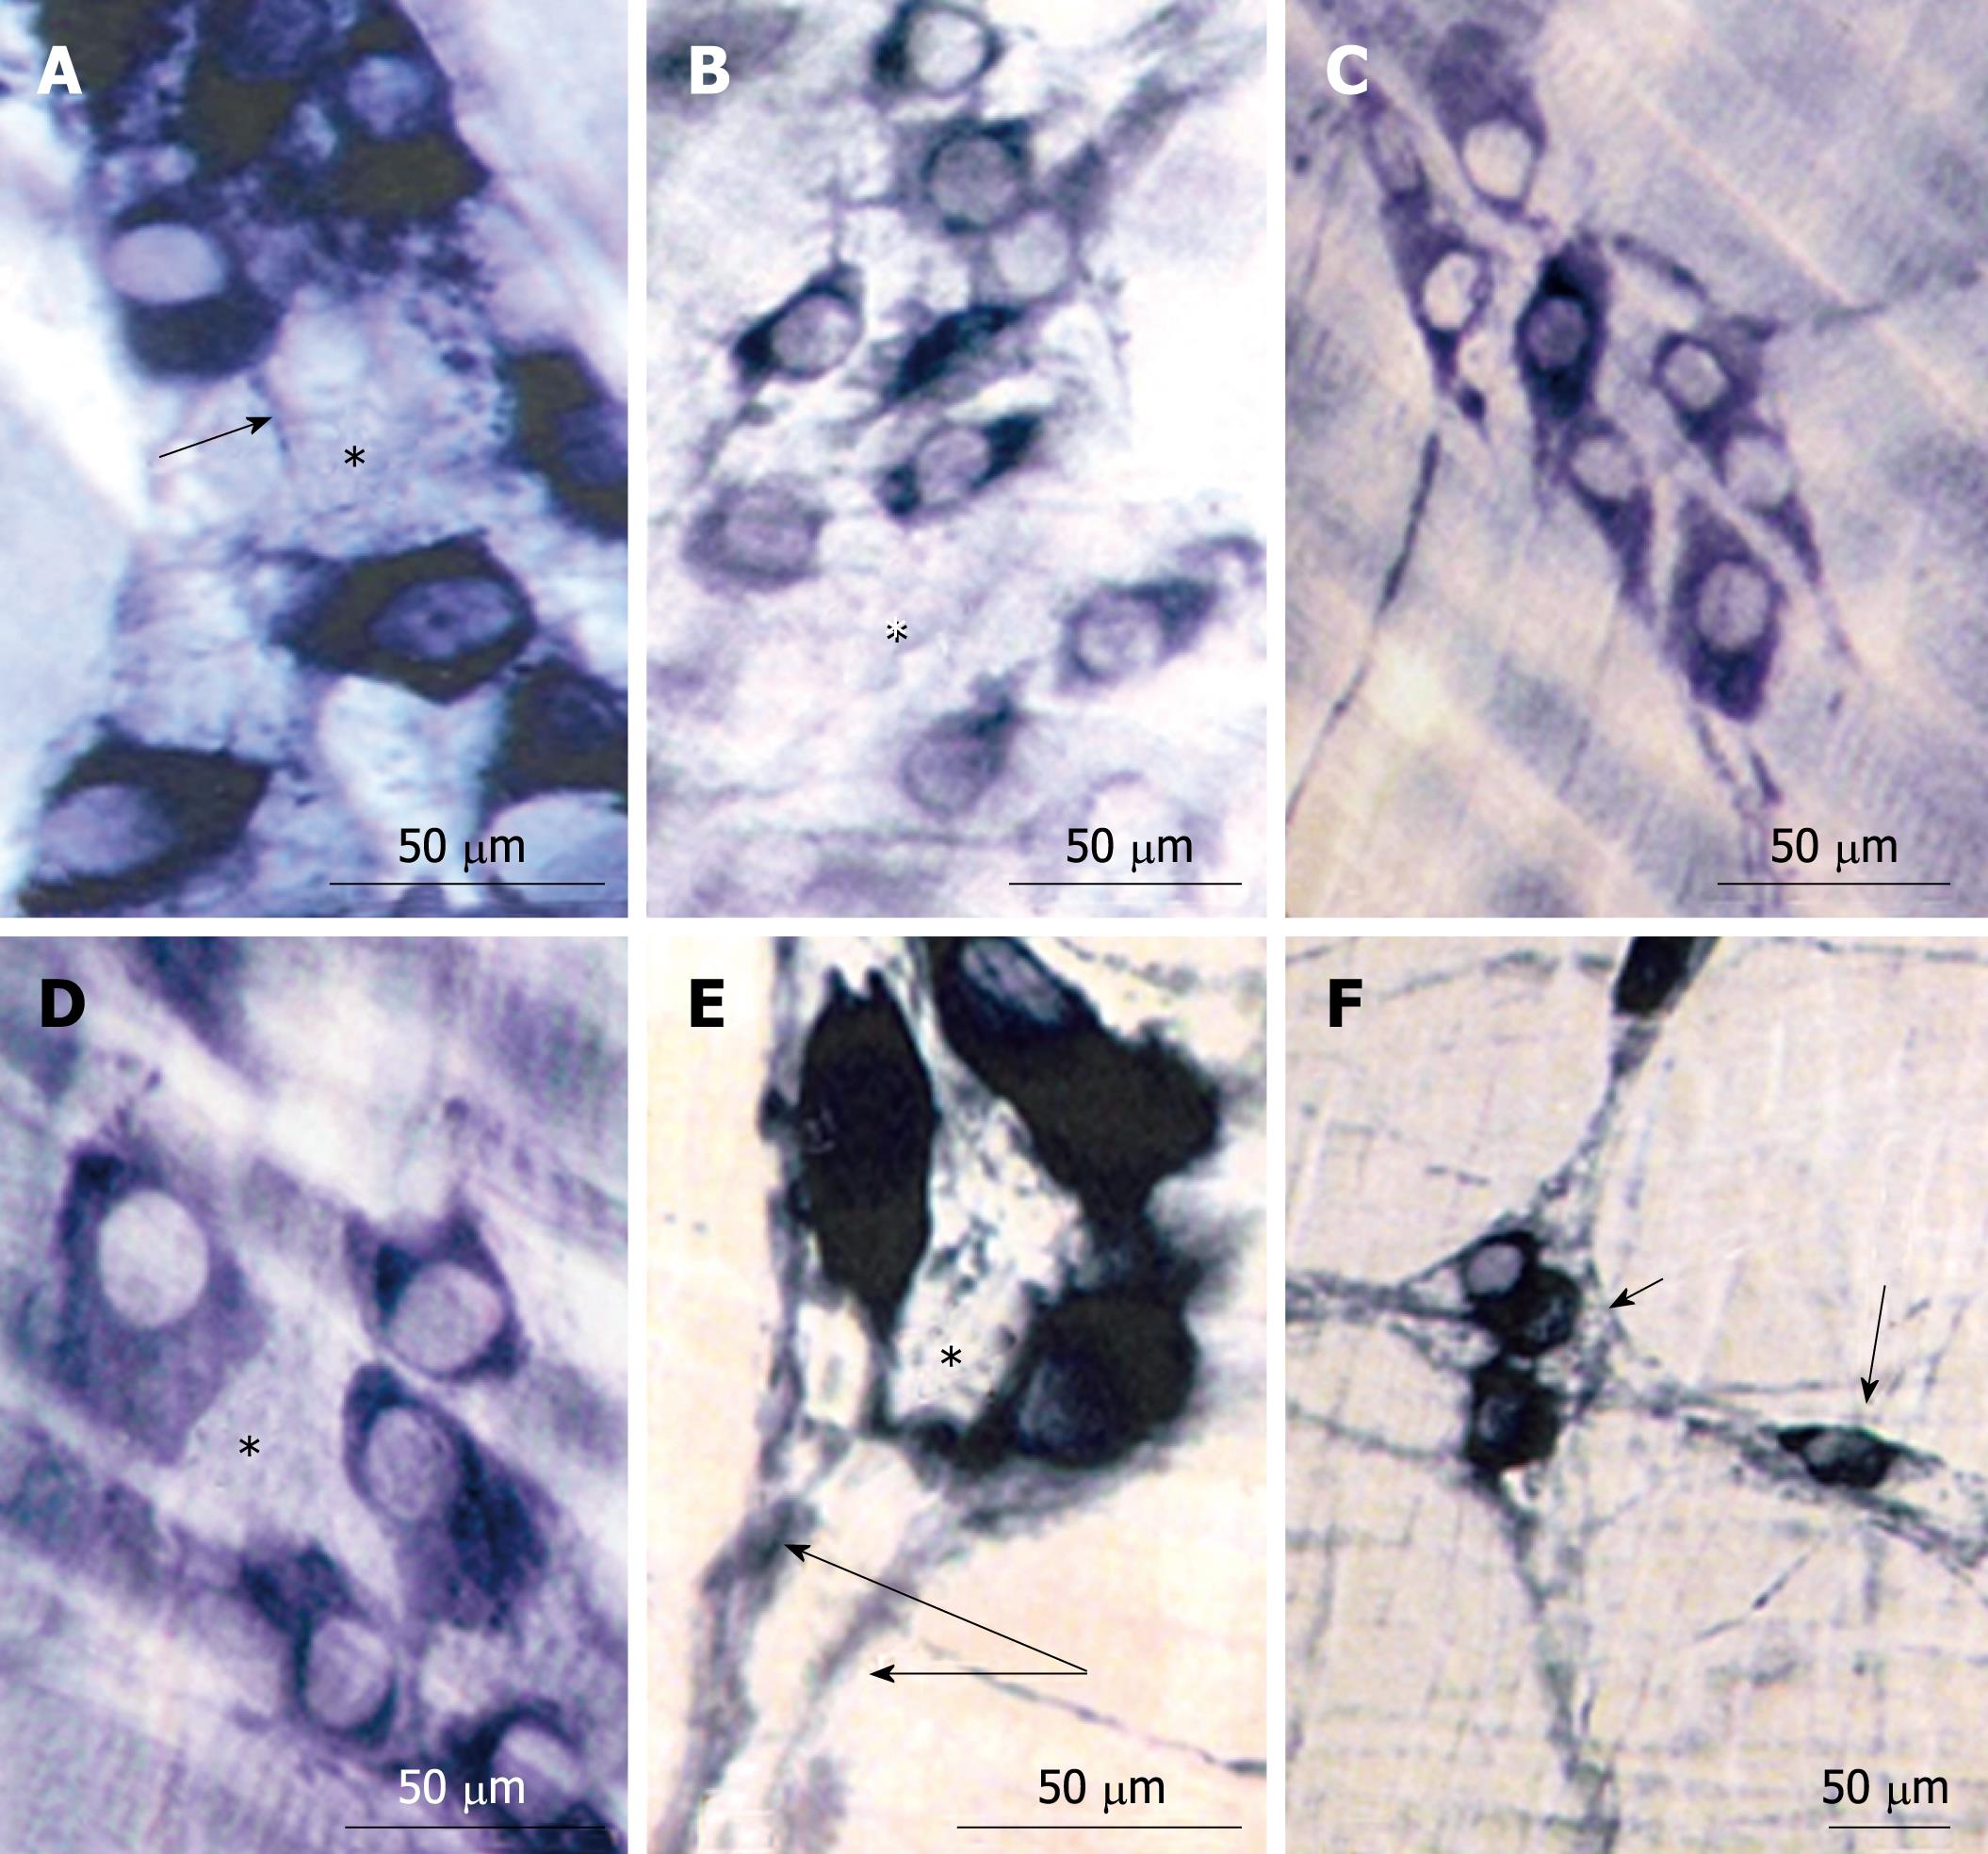
Figure 2 NADPH¨Cdiaphorase reaction.
A and D: N42 group. Note that most of the myenteric neurons were intensely reactive and spaces inside the ganglia (*) are surrounded by thin neuronal branches (arrow); B and E: D42 group. Neurons with diverse intensities of reaction, spaces inside the ganglia (*) and thick neuronal meshes (double-arrow) were evident; C and F: R42 group. Neuronal meshes surrounded the ganglion (small arrow). Some neurons were detected inside the meshes (large arrow).
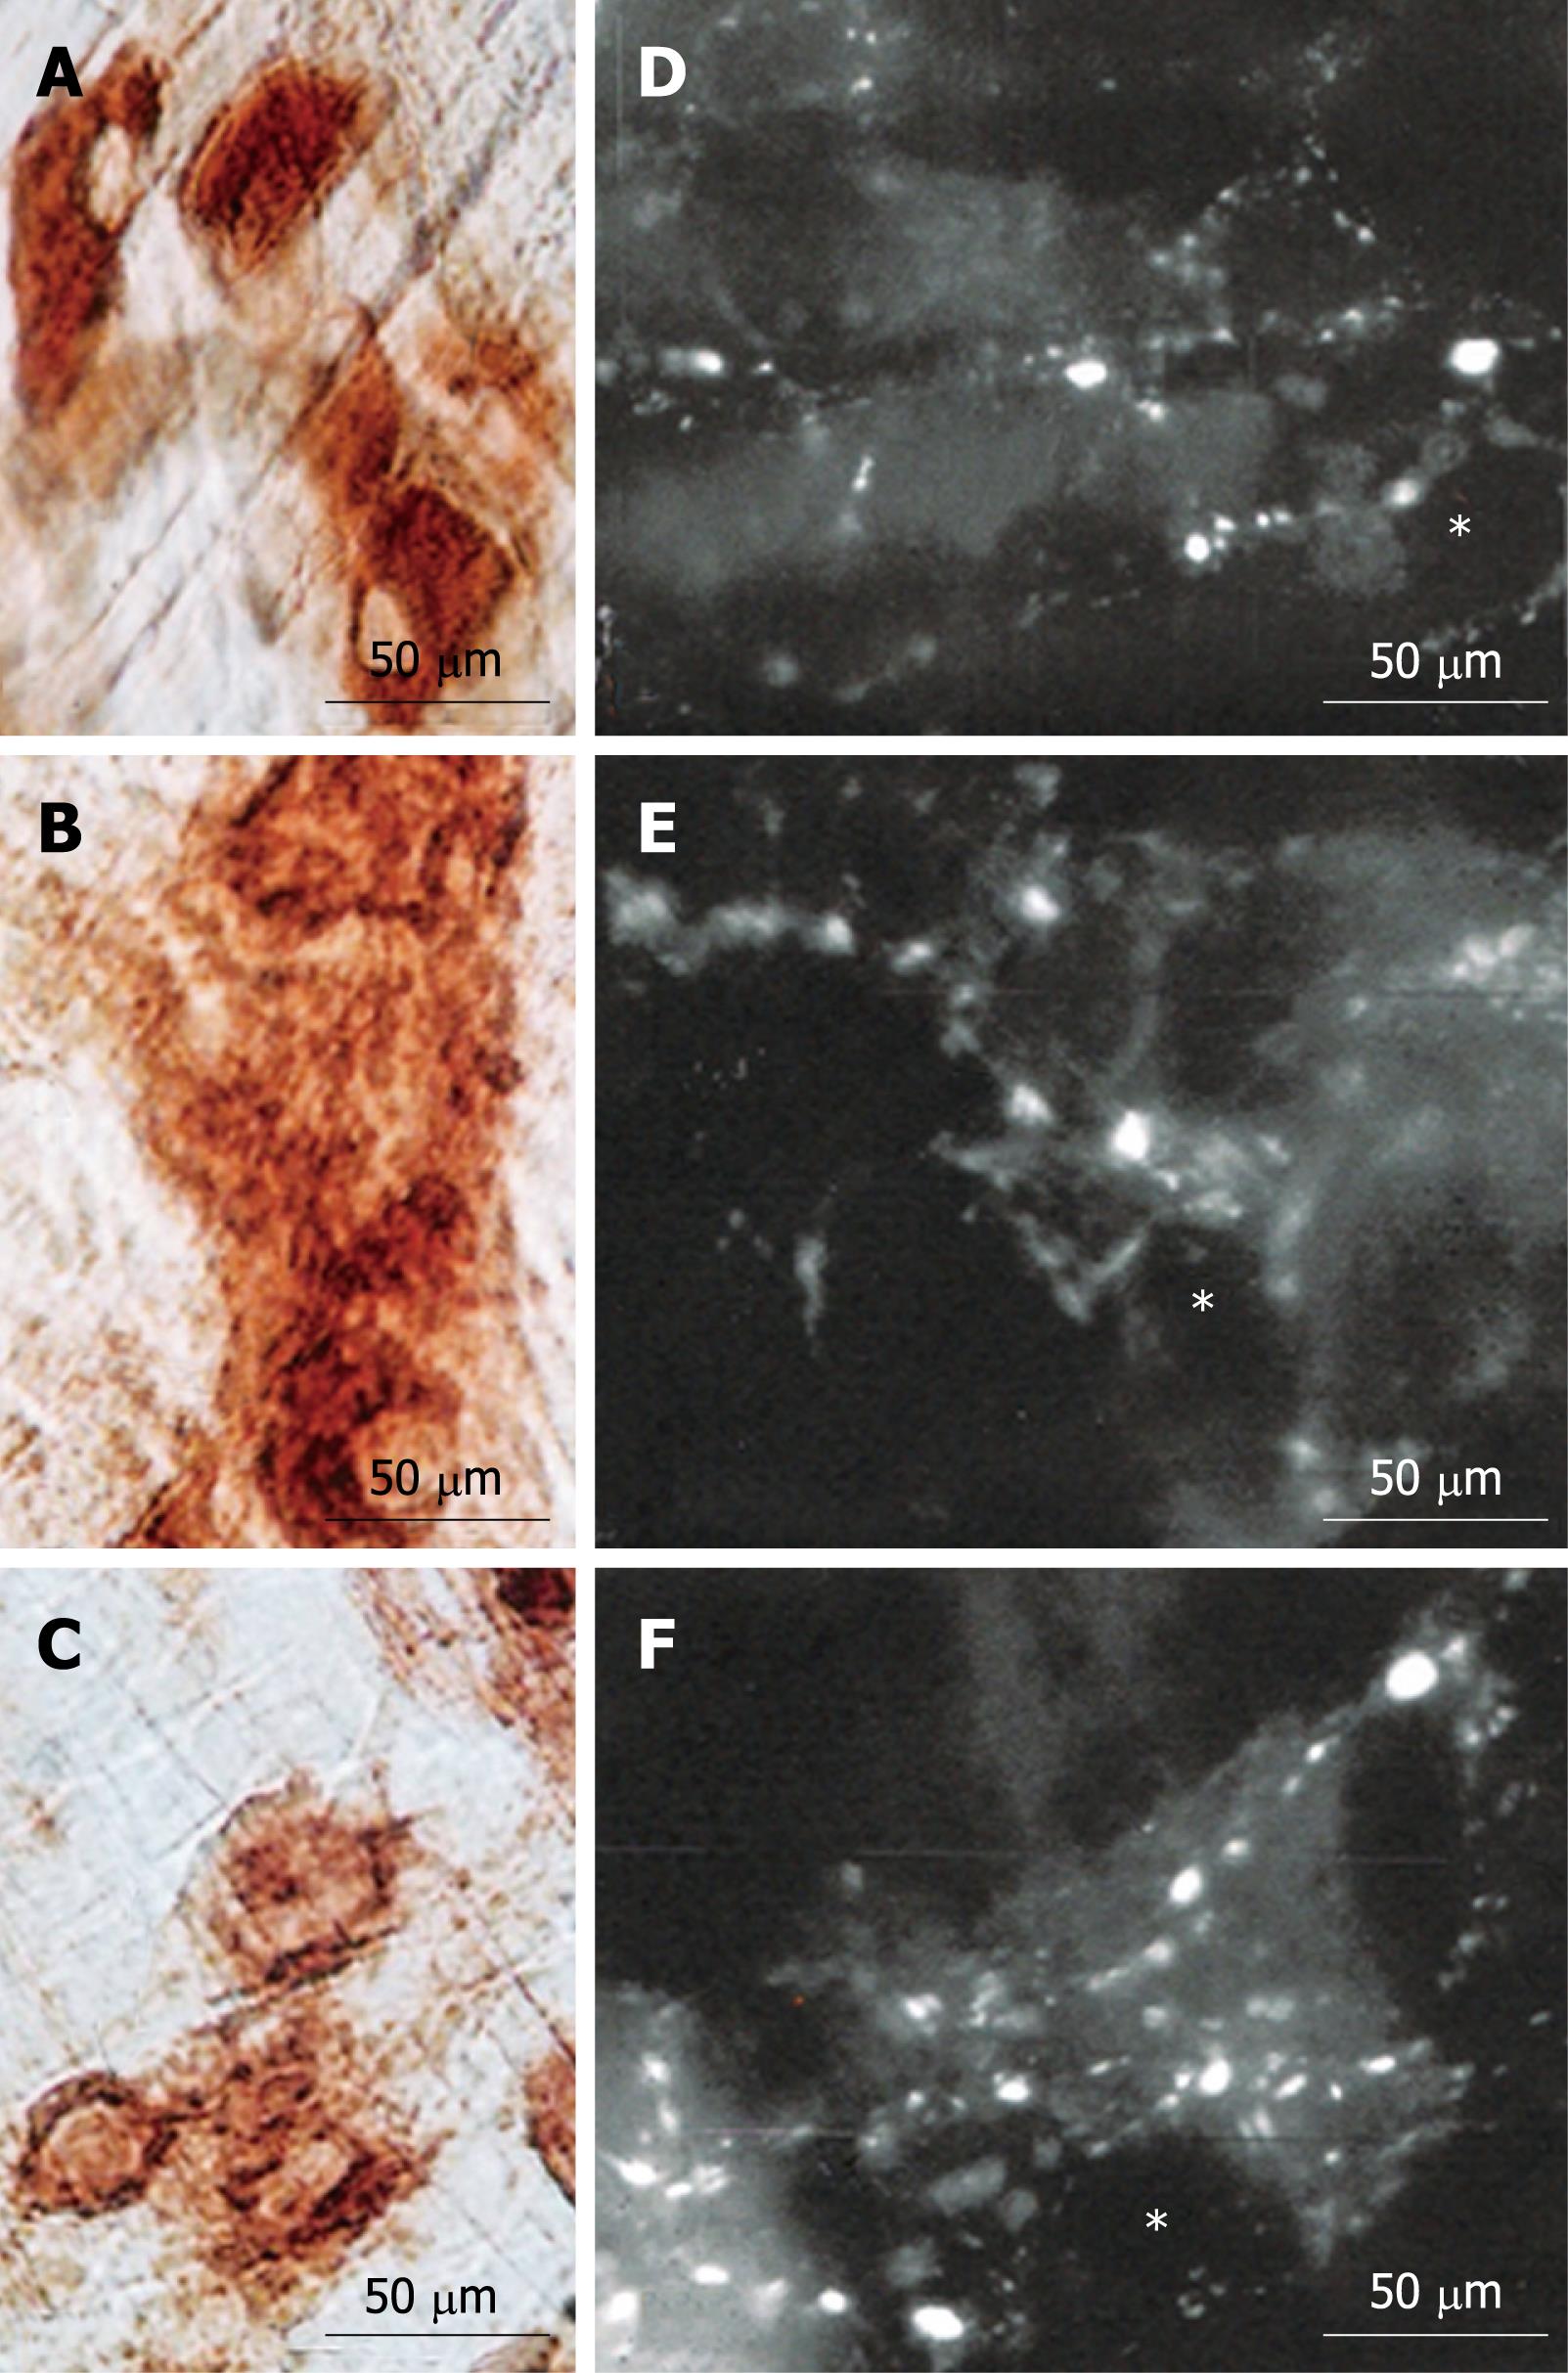
Figure 3 AChE reactive (A, C and E) and VIP immunoreactive (B, D and F) myenteric neurons.
Intensely (large arrows) and weakly (small arrows) reactive neurons were observed in N42 (A), D42 (C) and R42 (E) groups. Large and small varicosities (respectively, large and small arrows) were present around the neurons (*) in the N42 (B), D42 (D) and R42 (F) groups. Apparently, the varicosities were more abundant in the N42 and R42 groups.
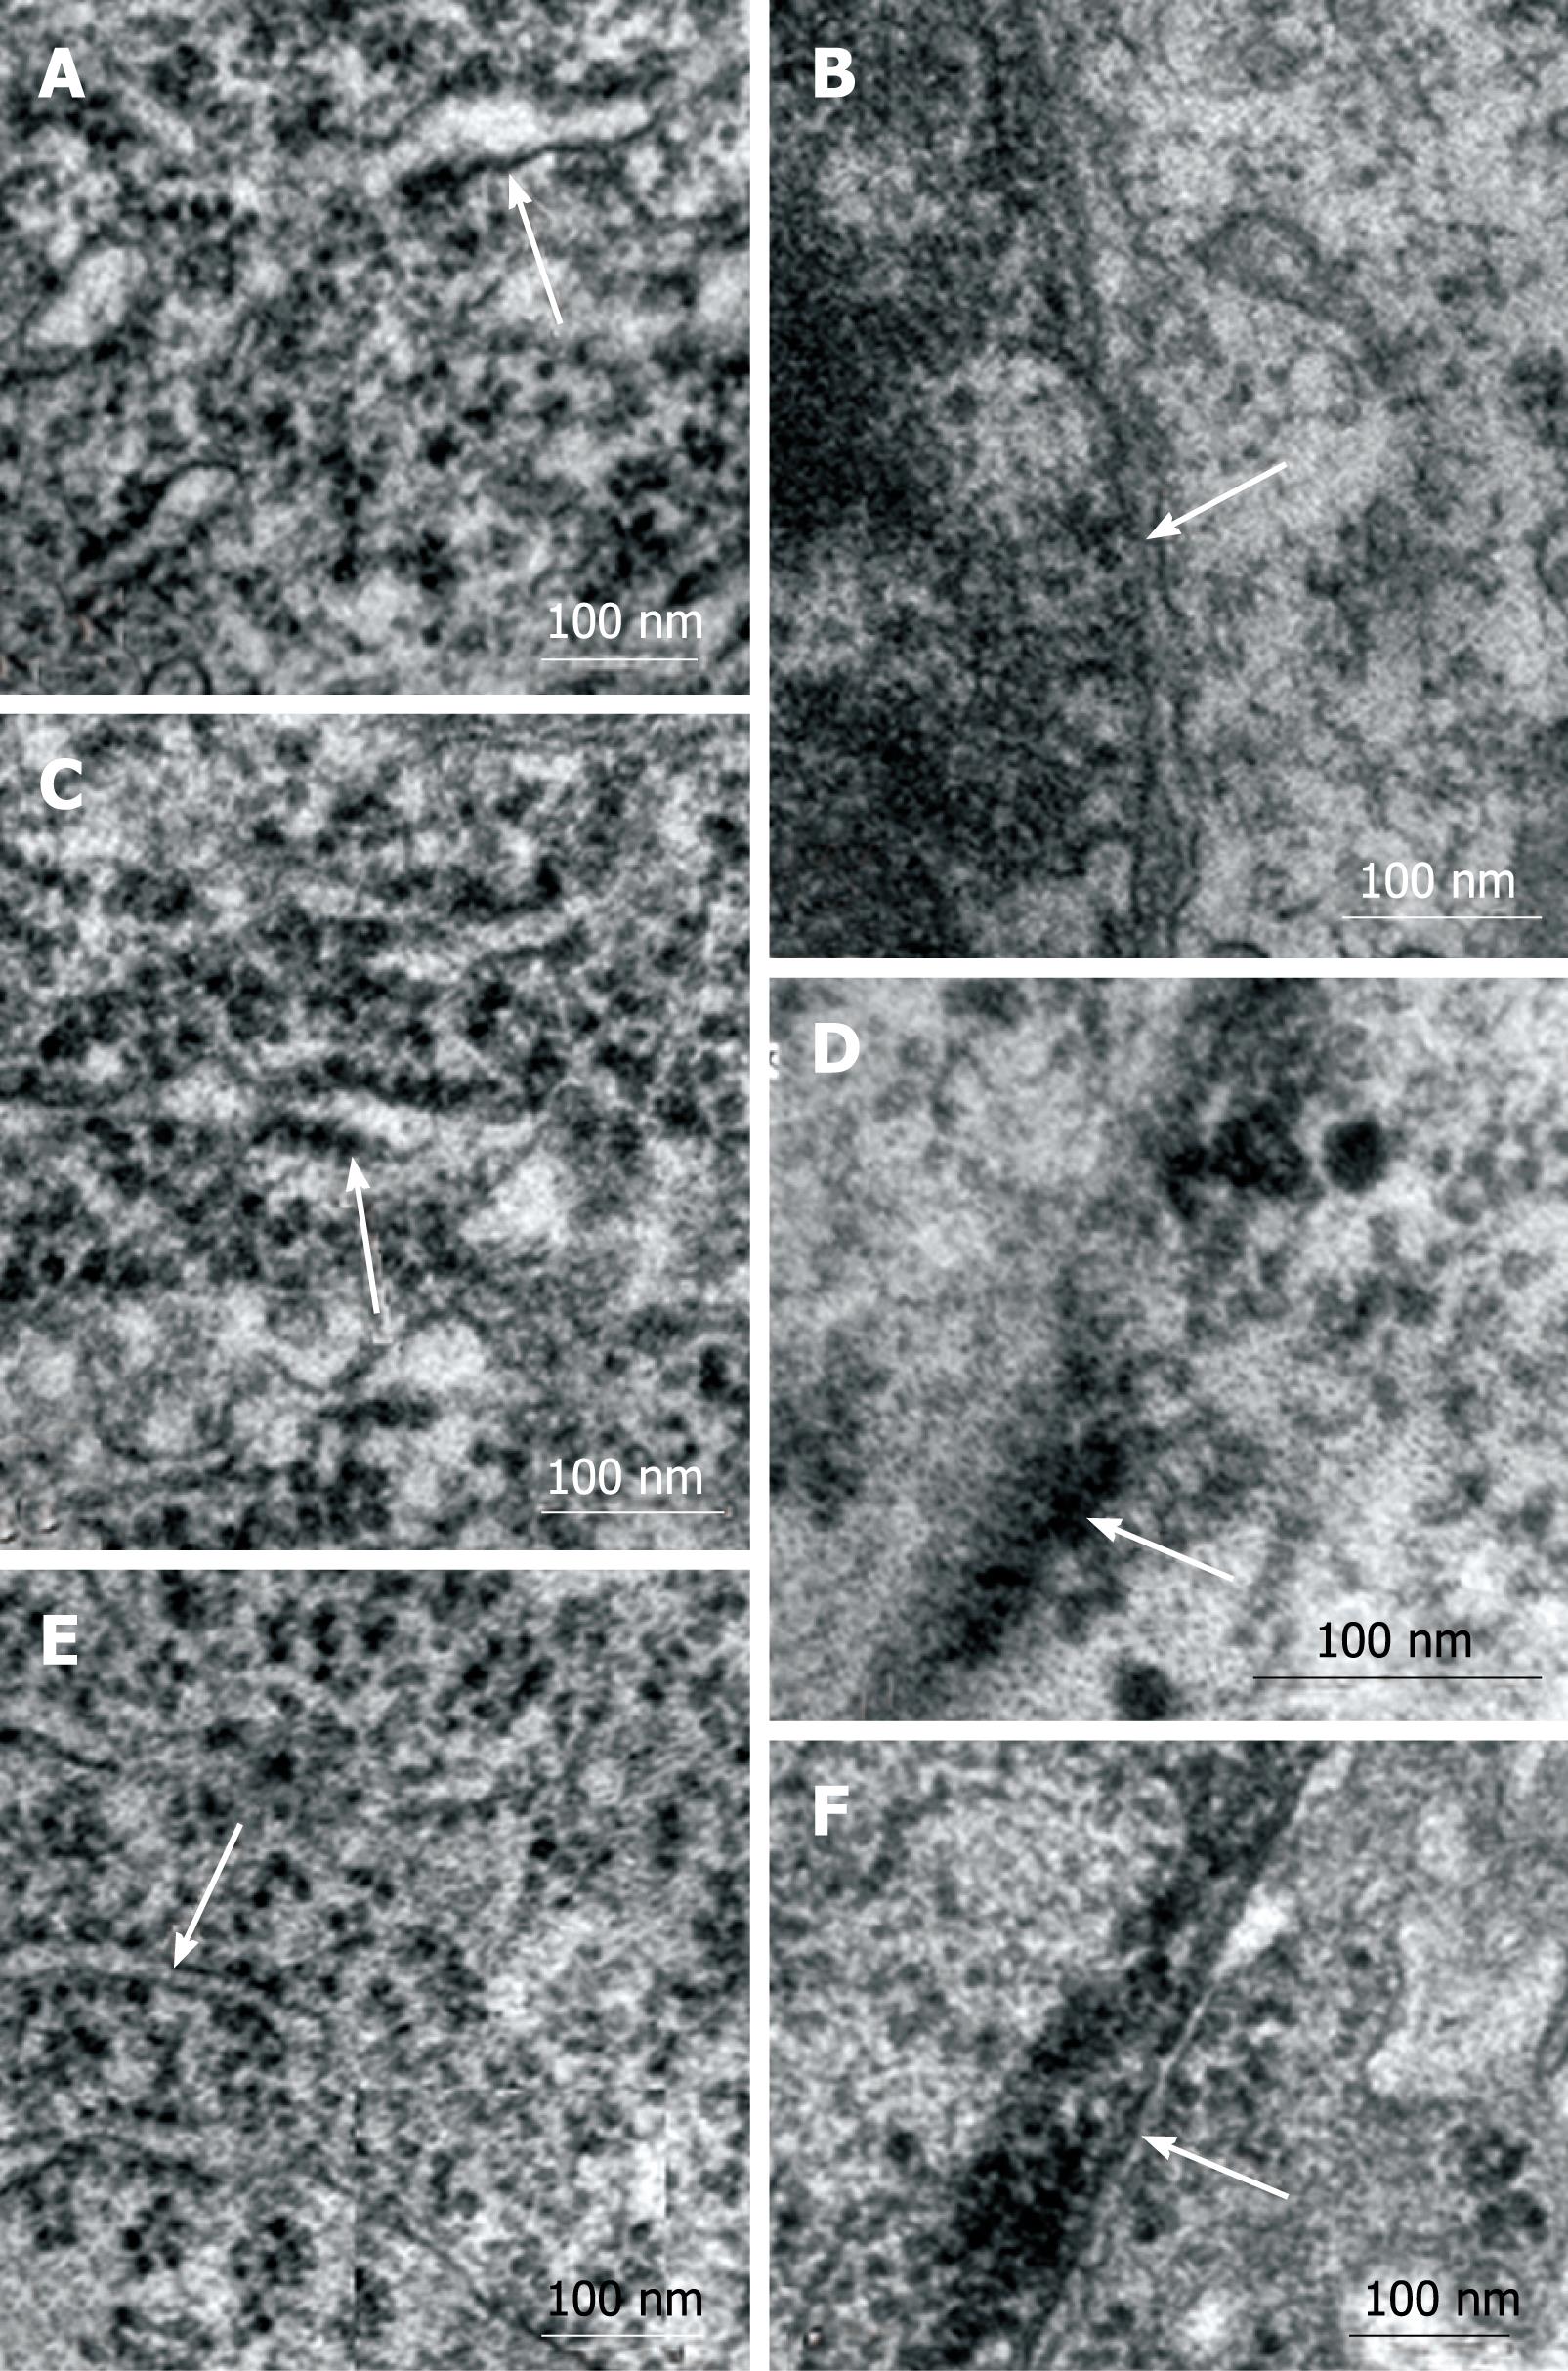
Figure 4 Electron micrographs of myenteric neurons from N42 (A and B), D42 (C and D), and R42 (E and F) groups.
A: In all groups, the granular reticulum showed that the ribosomes were aligned on the outer surface of the regularly arranged membrane (arrows). A well-defined nuclear double membrane and perinuclear cisterna were observed in neurons from N42 (B) and R42 (F) rats. Note that these structures were not delineated in the neurons of malnourished animals (D).
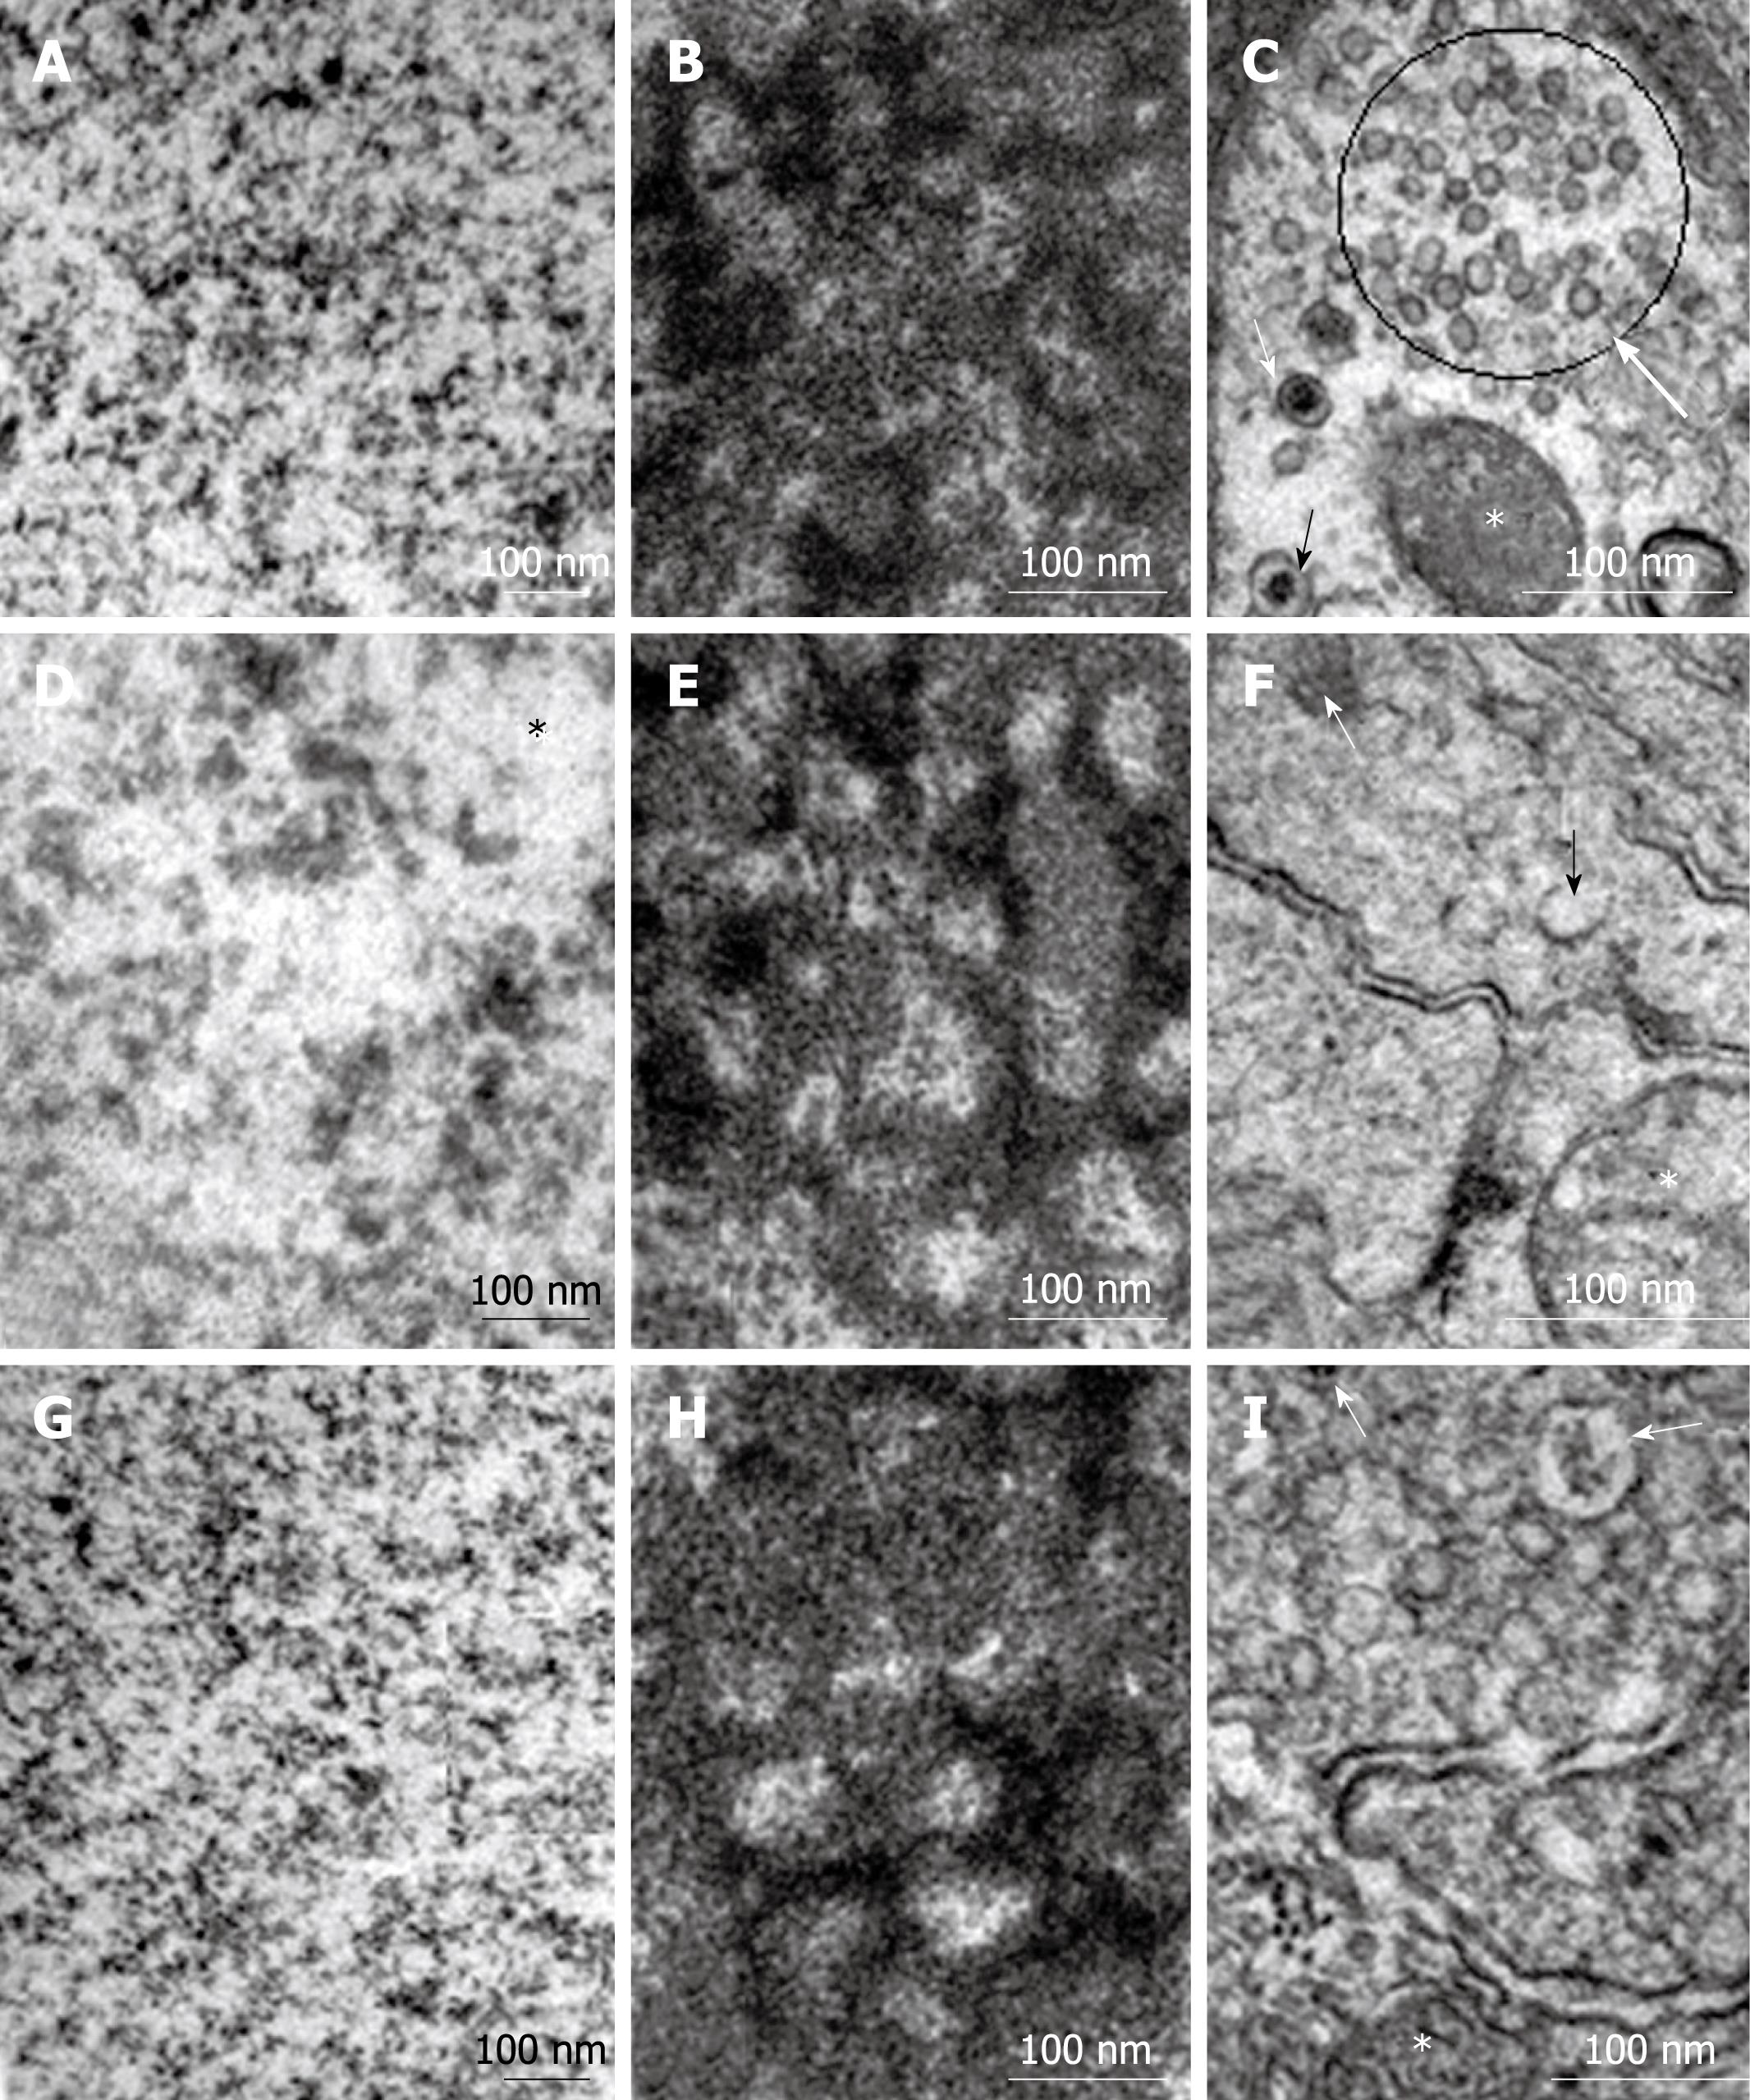
Figure 5 Electron micrographs of myenteric neurons.
A, D and G: Nuclear chromatin (*) homogeneously distributed; B, E and H: Granular and fibrillar parts of the nucleolus were similarly arranged; C, F and I: Many small vesicles (circle) were detected in neurons from all groups. Compare the intensity of large granular vesicles among the groups (arrows) (* mitochondria).
- Citation: Greggio FM, Fontes RB, Maifrino LB, Castelucci P, Souza RR, Liberti EA. Effects of perinatal protein deprivation and recovery on esophageal myenteric plexus. World J Gastroenterol 2010; 16(5): 563-570
- URL: https://www.wjgnet.com/1007-9327/full/v16/i5/563.htm
- DOI: https://dx.doi.org/10.3748/wjg.v16.i5.563


