Copyright
©2010 Baishideng Publishing Group Co.
World J Gastroenterol. Dec 28, 2010; 16(48): 6111-6118
Published online Dec 28, 2010. doi: 10.3748/wjg.v16.i48.6111
Published online Dec 28, 2010. doi: 10.3748/wjg.v16.i48.6111
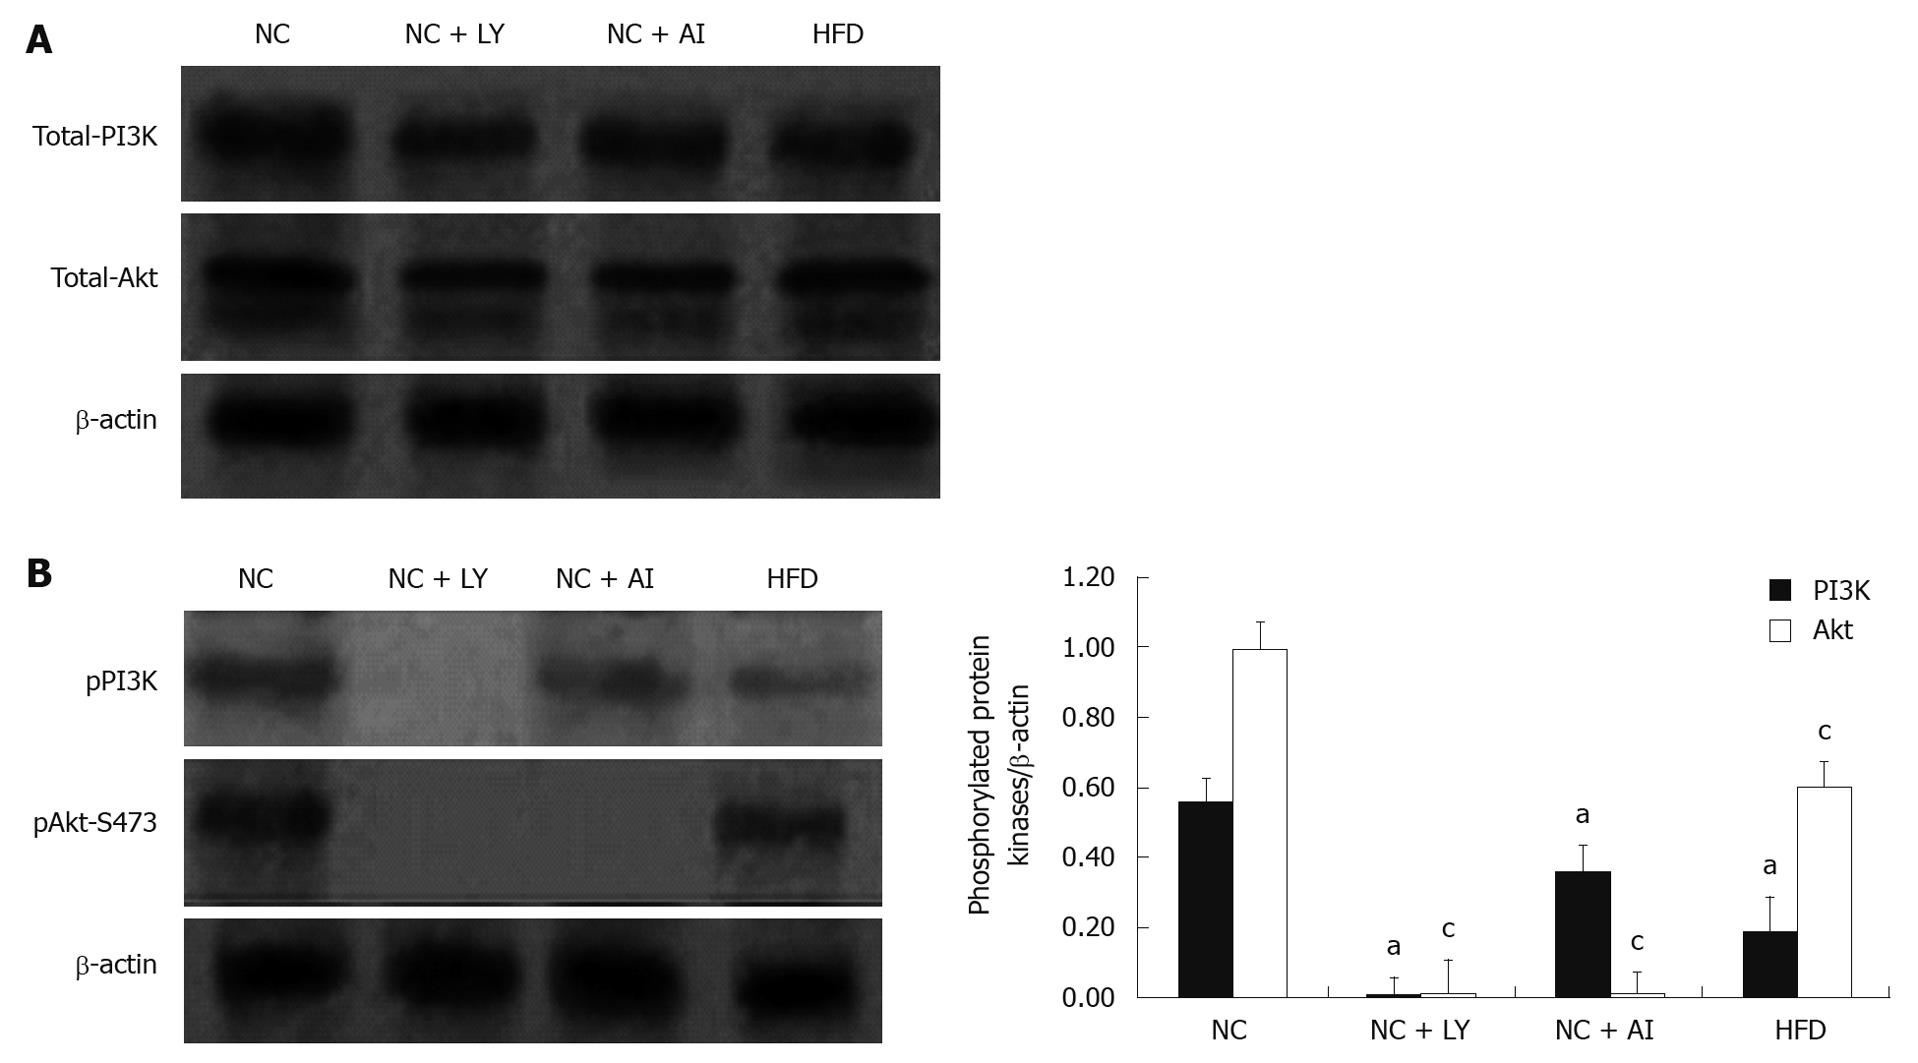
Figure 1 Western blotting analysis of phosphatidylinositol 3-kinase and protein kinase B in hepatocytes.
A: Western blotting analysis of total phosphatidylinositol 3-kinase (PI3K) and protein kinase B (Akt). The protein expression levels of total PI3K and Akt showed no significant difference among the four groups; B: Western blotting analysis of phosphorylated PI3K and Akt. Left: In high-fat fed groups (HFD), the protein expression levels of both phosphorylated PI3K and Akt decreased compared with the normal control (NC) group. In PI3K blocker groups (NC + LY), pPI3K and pAkt showed no expression. In AKT blocker groups (NC + AI), pPI3K was normally expressed and pAkt showed no expression. Right: Band density values are compared with those of the β-actin loading control. a,cP < 0.05 vs NC group.
Figure 2 Ultrastructural changes in hepatocellular mitochondria.
A: Mitochondria (a) in normal diet group; B: Enlarged mitochondria (b) and lipid droplet (c) in high-fat diet group; C and D: Animals treated with either phosphatidylinositol 3-kinase blocker (C) or protein kinase B blocker (D) showed similar changes in mitochondrial shape, size (d, f) and lipid droplet (e, g) to those of the high-fat group. Magnification × 18 000.
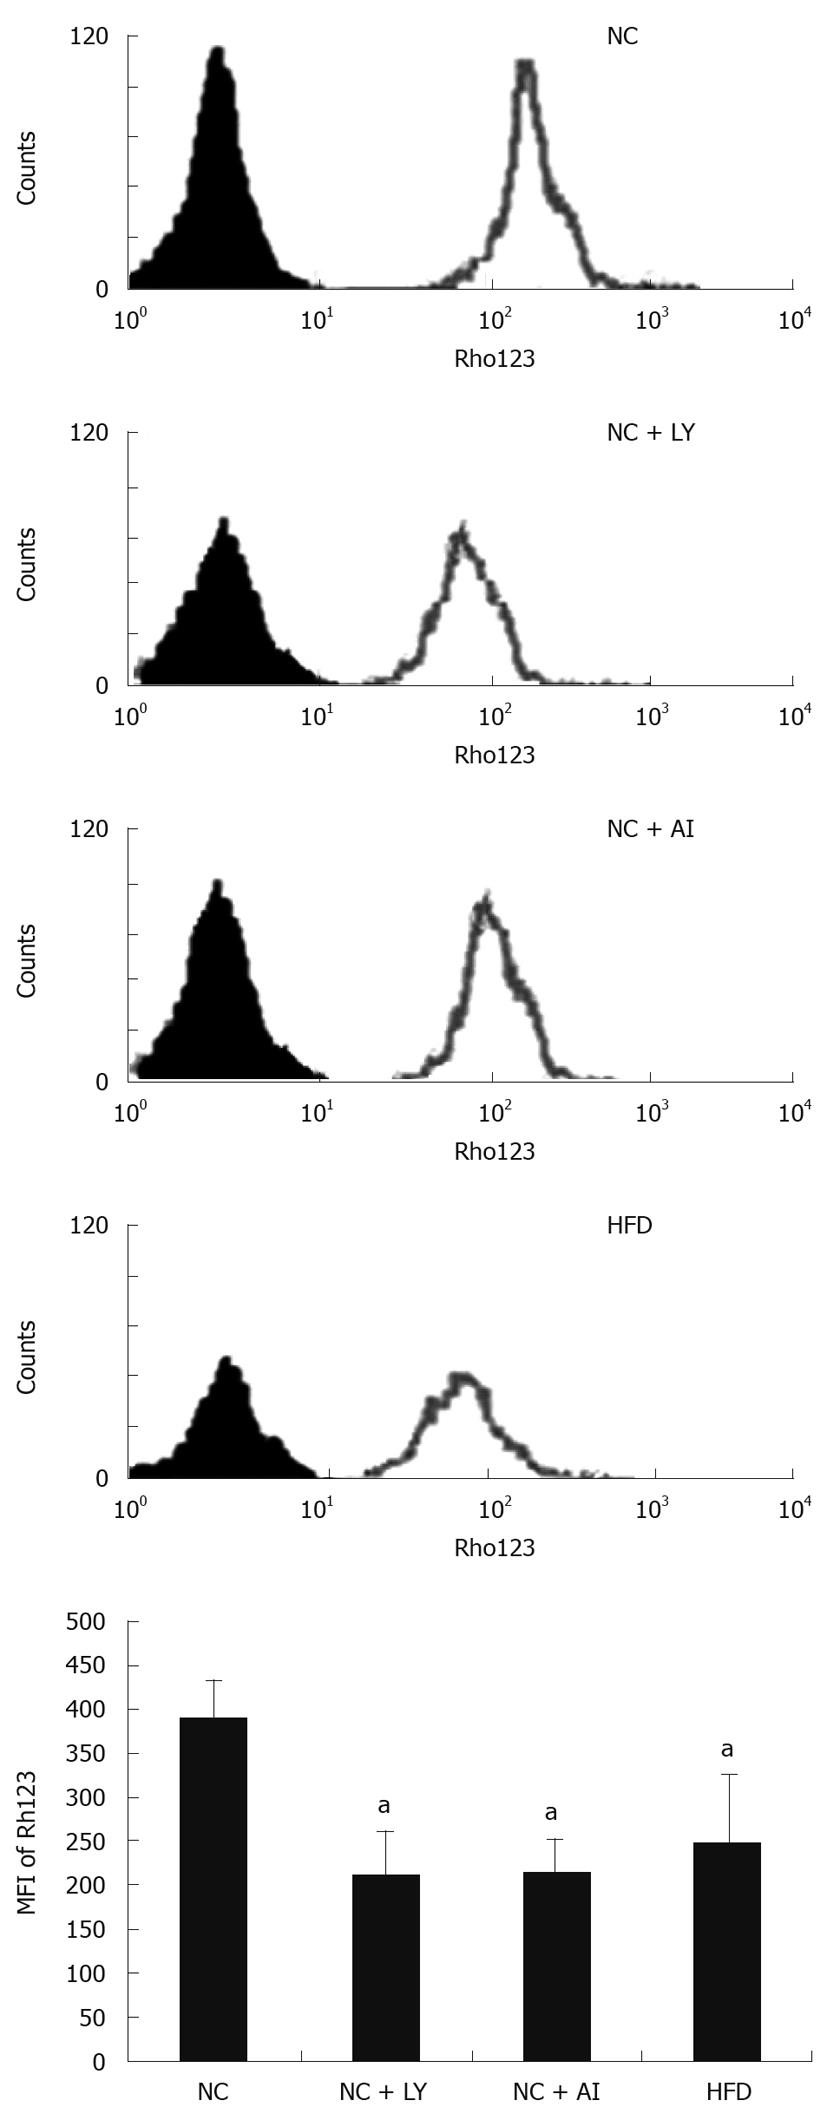
Figure 3 Changes in the membrane potential of hepatocyte mitochondria.
Fluorescence intensity (MFI) of Rh123 was 389.385% ± 18.612% in the normal control (NC) group, but decreased to 268.326% ± 13.526% in the high-fat group (HFD); and in PI3K and Akt blocker groups, MFI had a very similar change (211.326% ± 12.114%, 214.326% ± 13.321%, respectively), indicating a decrease in the mitochondrial membrane potential (Dym) in high-fat, PI3K and Akt blocker groups. aP < 0.05 vs NC group.
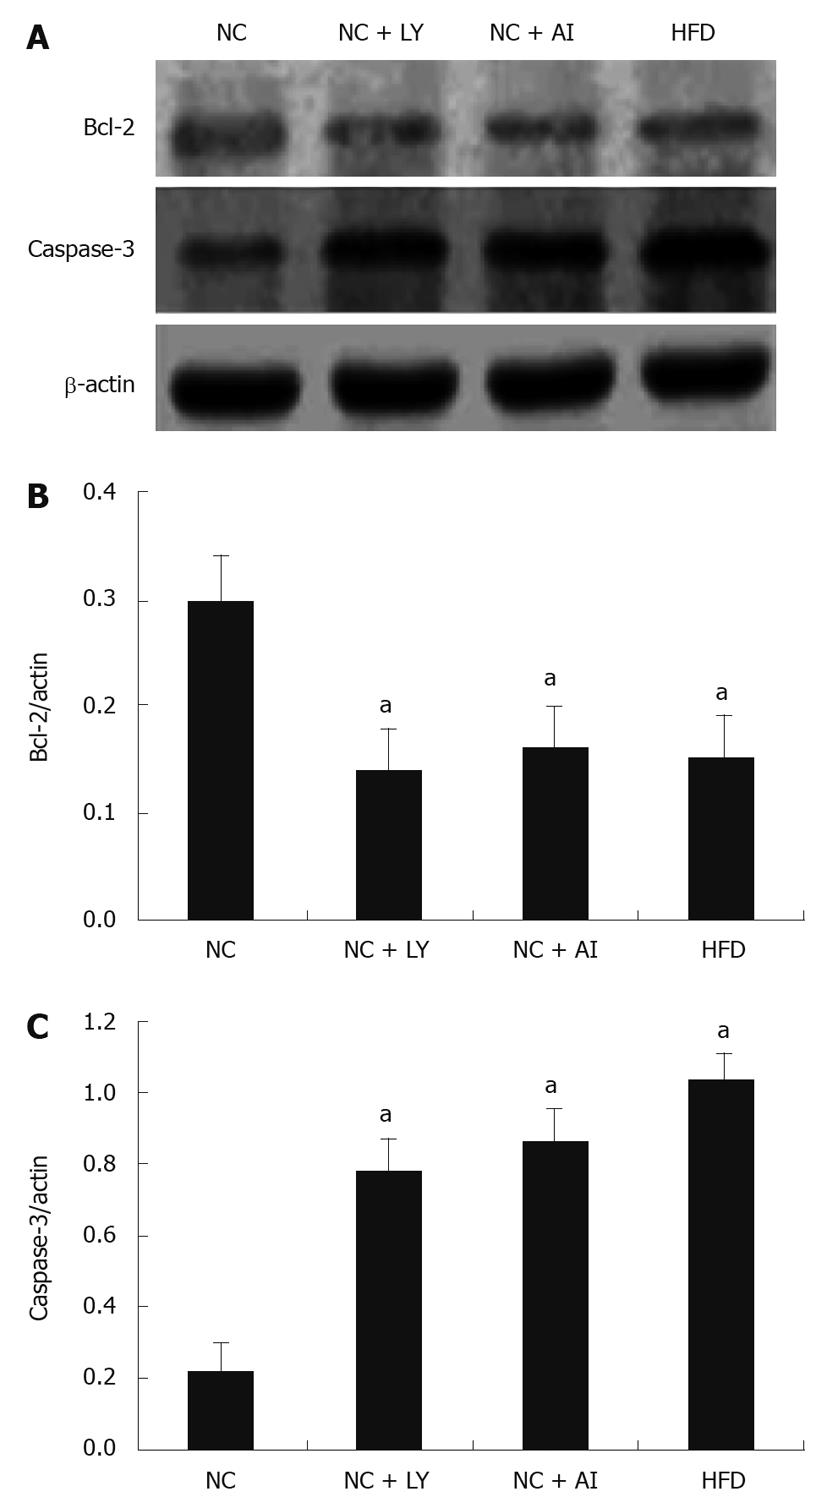
Figure 4 Western blotting analysis of caspase-3 and Bcl-2 in hepatocytes.
A: Compared with control values [normal control (NC) group, lane 1], the expression levels of Bcl-2 protein decreased in the phosphatidylinositol 3-kinase (PI3K), protein kinase B (Akt)-blocker and high-fat groups (lanes 2-4). In contrast, caspase-3 expression was equally elevated in each of the three treatment groups compared with the control value; B, C: Band density values are compared with those of the β-actin loading control. aP < 0.05 vs NC group.
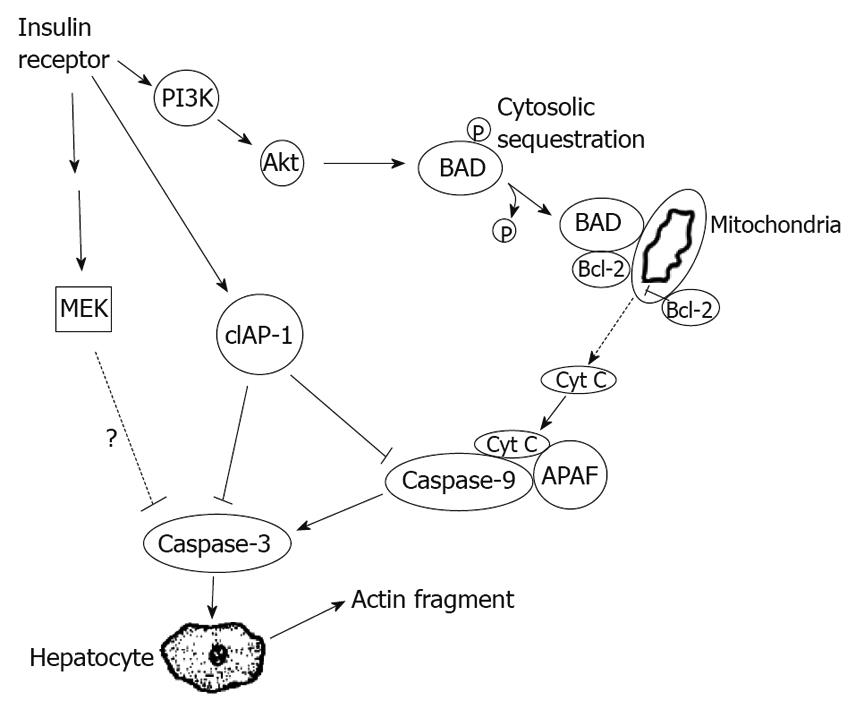
Figure 5 Simulation diagram of the relationship between insulin signaling pathway and hepatocyte apoptosis.
PI3K: Phosphatidylinositol 3-kinase; Akt: Protein kinase B; BAD: Bcl2-associated agonist of cell death; MEK: Mitogen-activated protein kinase kinase; clAP-1: Cell inhibitors of apoptosis protein-1; Cyt C: Cytochrome c; APAF: Apoptotic peptidase activating factor.
- Citation: Han JW, Zhan XR, Li XY, Xia B, Wang YY, Zhang J, Li BX. Impaired PI3K/Akt signal pathway and hepatocellular injury in high-fat fed rats. World J Gastroenterol 2010; 16(48): 6111-6118
- URL: https://www.wjgnet.com/1007-9327/full/v16/i48/6111.htm
- DOI: https://dx.doi.org/10.3748/wjg.v16.i48.6111


