Copyright
©2010 Baishideng Publishing Group Co.
World J Gastroenterol. Nov 14, 2010; 16(42): 5297-5305
Published online Nov 14, 2010. doi: 10.3748/wjg.v16.i42.5297
Published online Nov 14, 2010. doi: 10.3748/wjg.v16.i42.5297
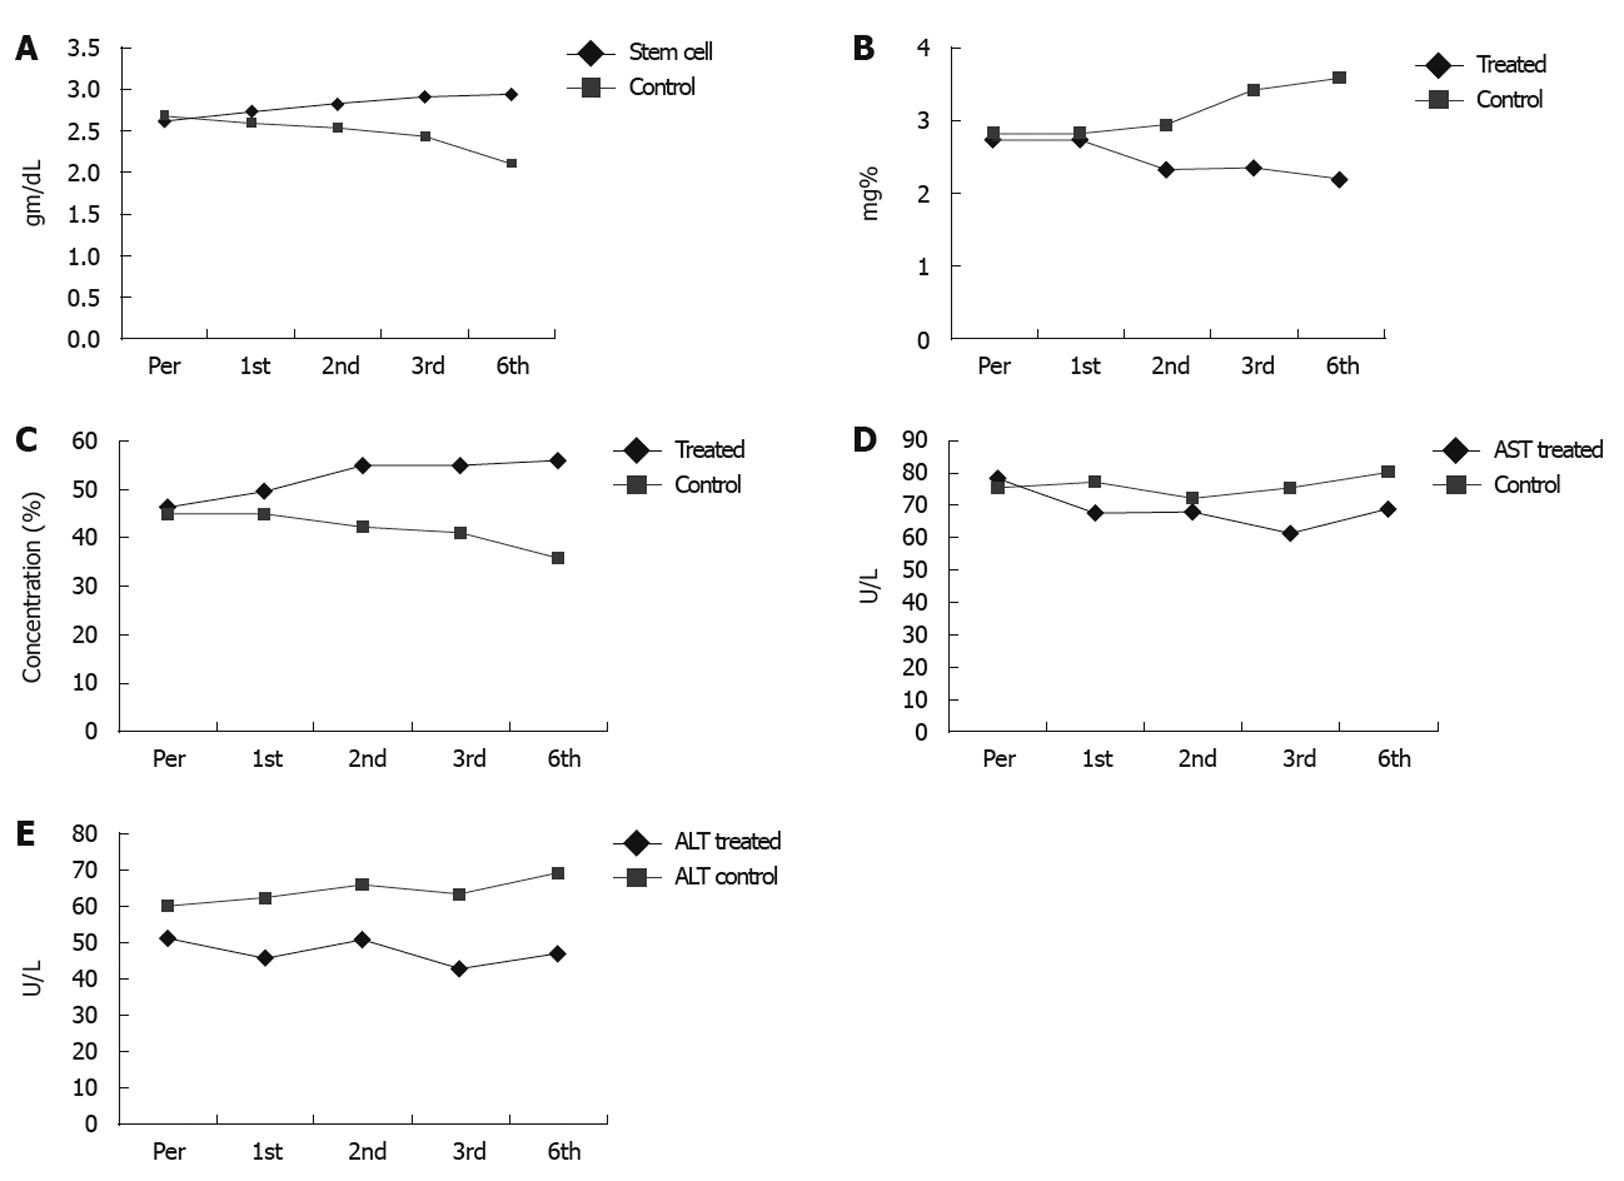
Figure 1 Changes in serum albumin (A), serum bilirubin (B), prothrombin concentration (C), aspartate transaminase values (D) and alanine transaminase values (E) in both control and treated groups.
Per: Pre-treatment; 1st: First month; 2nd: Second month; 3rd: Third month; 6th: Sixth month after treatment.
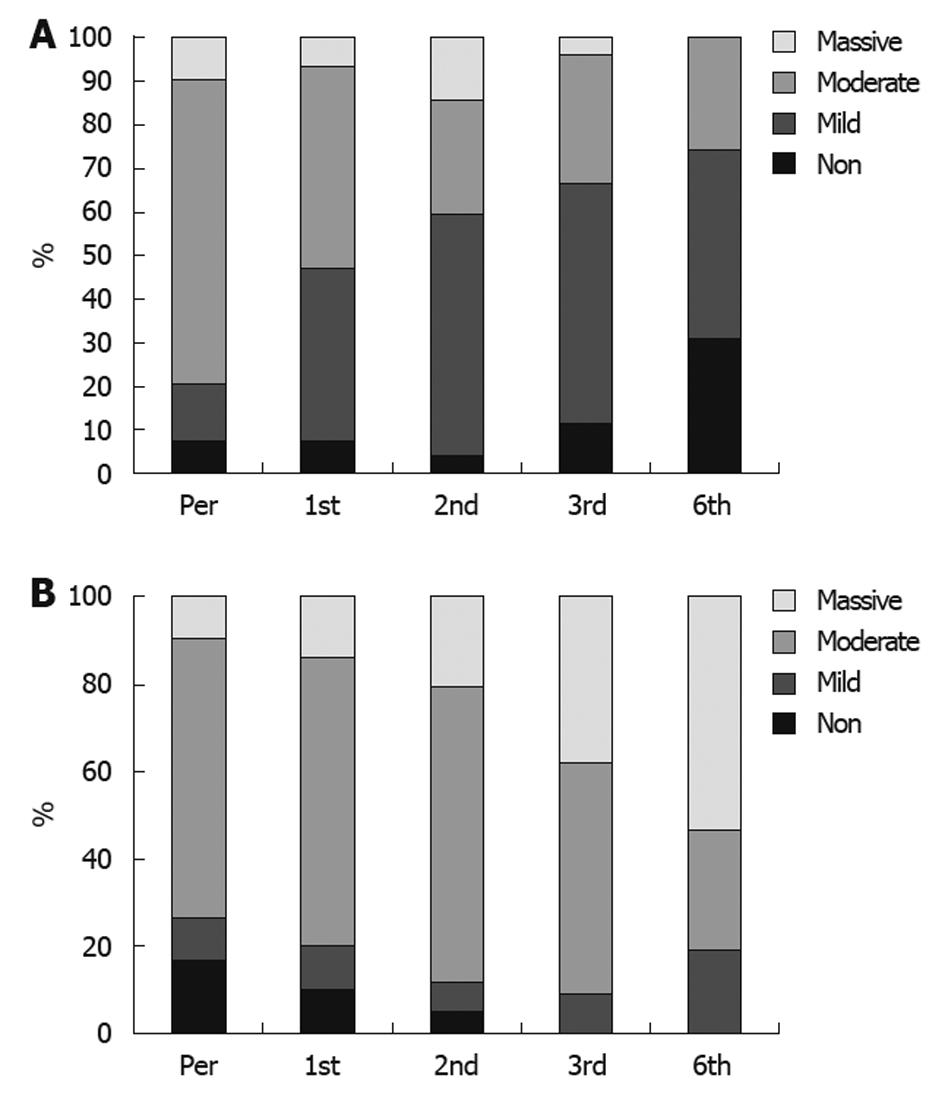
Figure 2 Degree of ascites in the study population (A) and control group (B).
Per: Pre-treatment; 1st: First month; 2nd: Second month; 3rd: Third month; 6th: Sixth month after treatment.
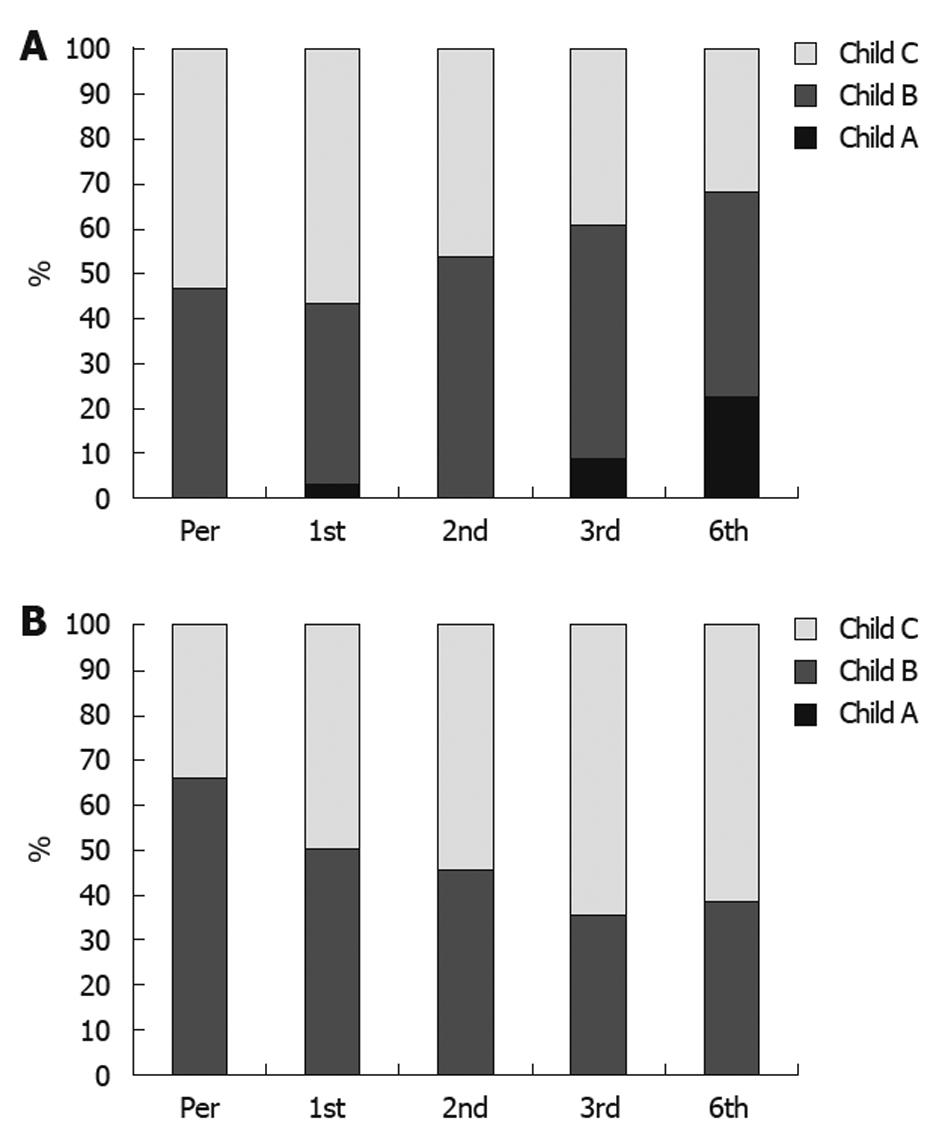
Figure 3 Child-Pugh scores in the study population (A) and control group (B).
Per: Pre-treatment; 1st: First month; 2nd: Second month; 3rd: Third month; 6th: Sixth month after treatment.
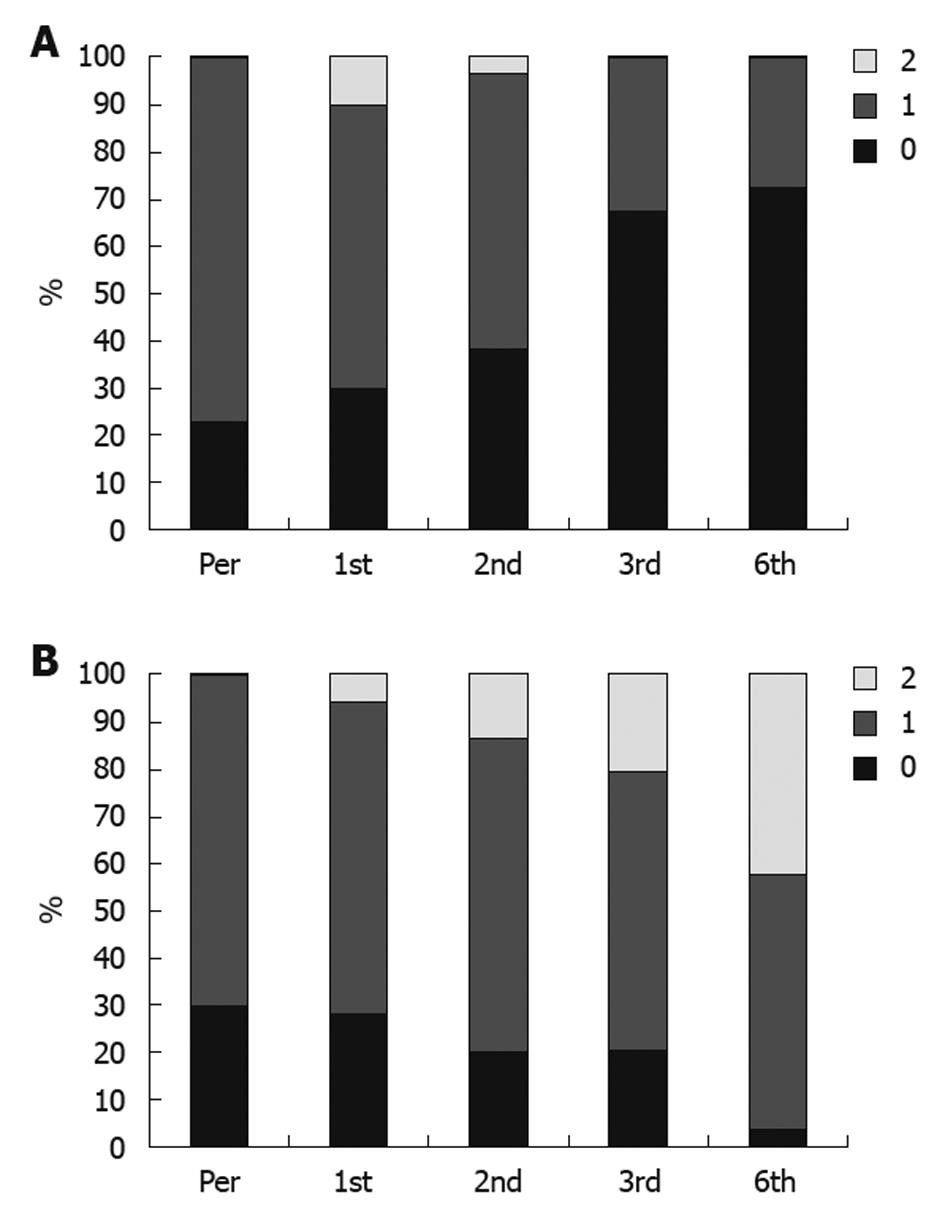
Figure 4 Performance scores in the study population (A) and control group (B).
Per: Pre-treatment; 1st: First month; 2nd: Second month; 3rd: Third month; 6th: Sixth month after treatment.
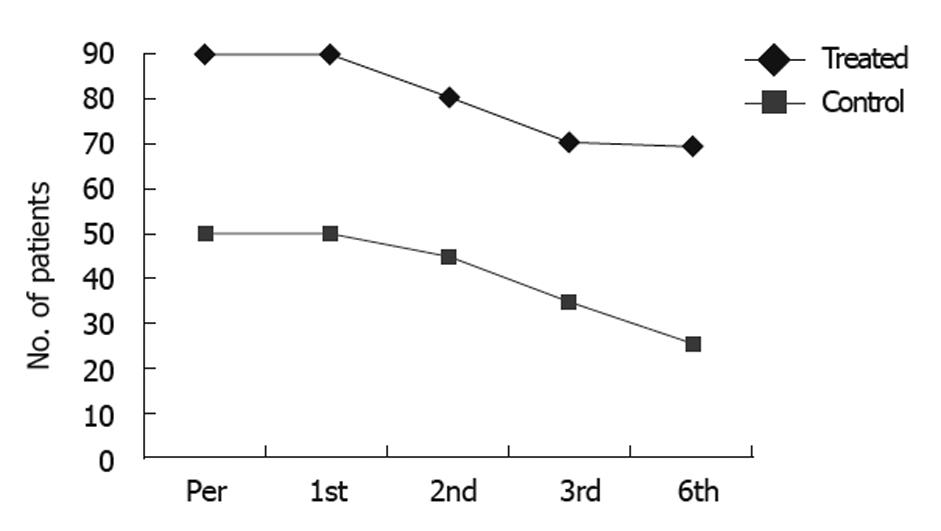
Figure 5 Survival rate in the treated vs control group.
Per: Pre-treatment; 1st: First month; 2nd: Second month; 3rd: Third month; 6th: Sixth month after treatment.
- Citation: Salama H, Zekri ARN, Bahnassy AA, Medhat E, Halim HA, Ahmed OS, Mohamed G, Alim SAA, Sherif GM. Autologous CD34+ and CD133+ stem cells transplantation in patients with end stage liver disease. World J Gastroenterol 2010; 16(42): 5297-5305
- URL: https://www.wjgnet.com/1007-9327/full/v16/i42/5297.htm
- DOI: https://dx.doi.org/10.3748/wjg.v16.i42.5297


