Copyright
©2010 Baishideng Publishing Group Co.
World J Gastroenterol. Oct 28, 2010; 16(40): 5092-5103
Published online Oct 28, 2010. doi: 10.3748/wjg.v16.i40.5092
Published online Oct 28, 2010. doi: 10.3748/wjg.v16.i40.5092
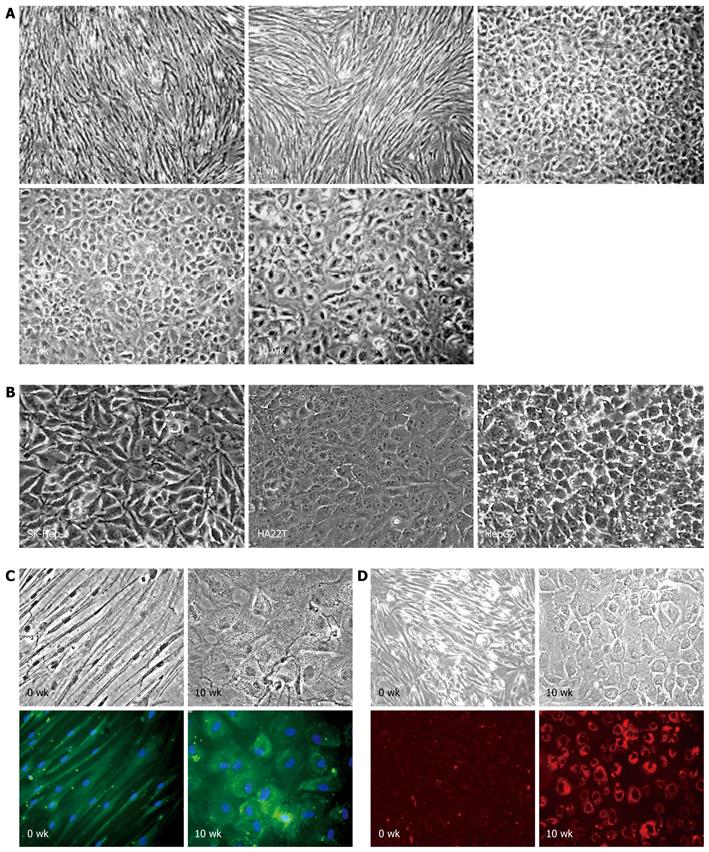
Figure 1 Hepatic differentiation of human bone marrow-derived mesenchymal stem cells.
A: Morphological characterization of differentiated mesenchymal stem cells (MSCs) under hepatic induction. 0 wk: Undifferentiated MSCs; 1 wk: 1 wk post-induction; 4 wk: 4 wk post-induction; 7 wk: 7 wk post-induction; and 10 wk: 10 wk post-induction (original magnification, × 50); B: Morphology of human hepatoma cell lines: SK-Hep-1, HA22T/VGH, and HepG2 (original magnification, × 100); C: Production of albumin (green color) in differentiated MSCs after 10 wk induction (10 wk) and counterstained with Hoechst (blue color). The undifferentiated MSCs (0 wk) were used as negative control cells (original magnification, × 200); D: Uptake of low-density lipoprotein (red color) in differentiated MSCs after 10 wk induction (10 wk). The undifferentiated MSCs (0 wk) were used as negative control cells (original magnification, × 100).
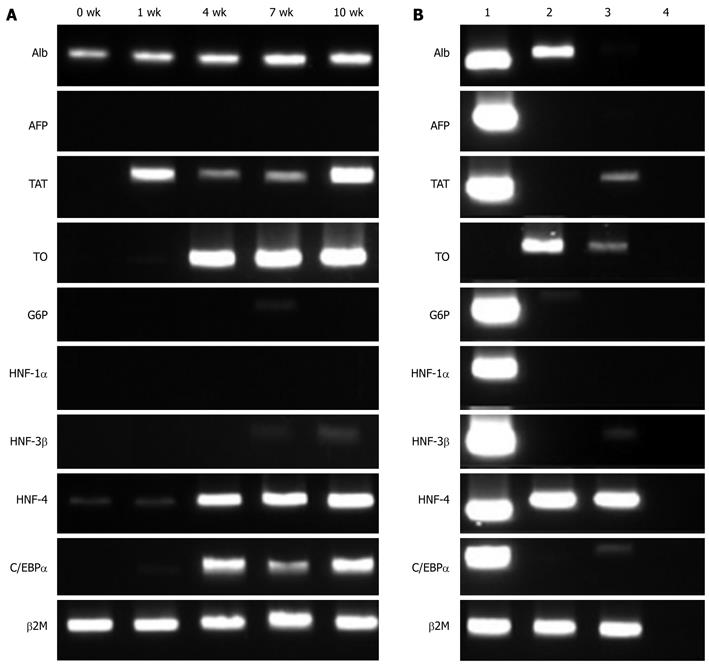
Figure 2 Detection of liver-specific genes and liver-enriched transcription factors in induced mesenchymal stem cells by reverse transcription-polymerase chain reaction.
A: Induced mesenchymal stem cells at the indicated time point: 0, 1, 4, 7 and 10 wk post-induction; B: Human hepatoma cell lines: 1, HepG2; 2, HA22T/VGH; 3, SK-Hep-1; and 4, negative control. Expression of β2M was used as the control for adjustment of sample amount. Alb: Albumin; AFP: α-fetoprotein; TAT: Tyrosine-aminotransferase; TO: Tryptophan 2,3-dioxygenase; G6P: Glucose 6-phosphatase; β2M: β-2-microglobulin.
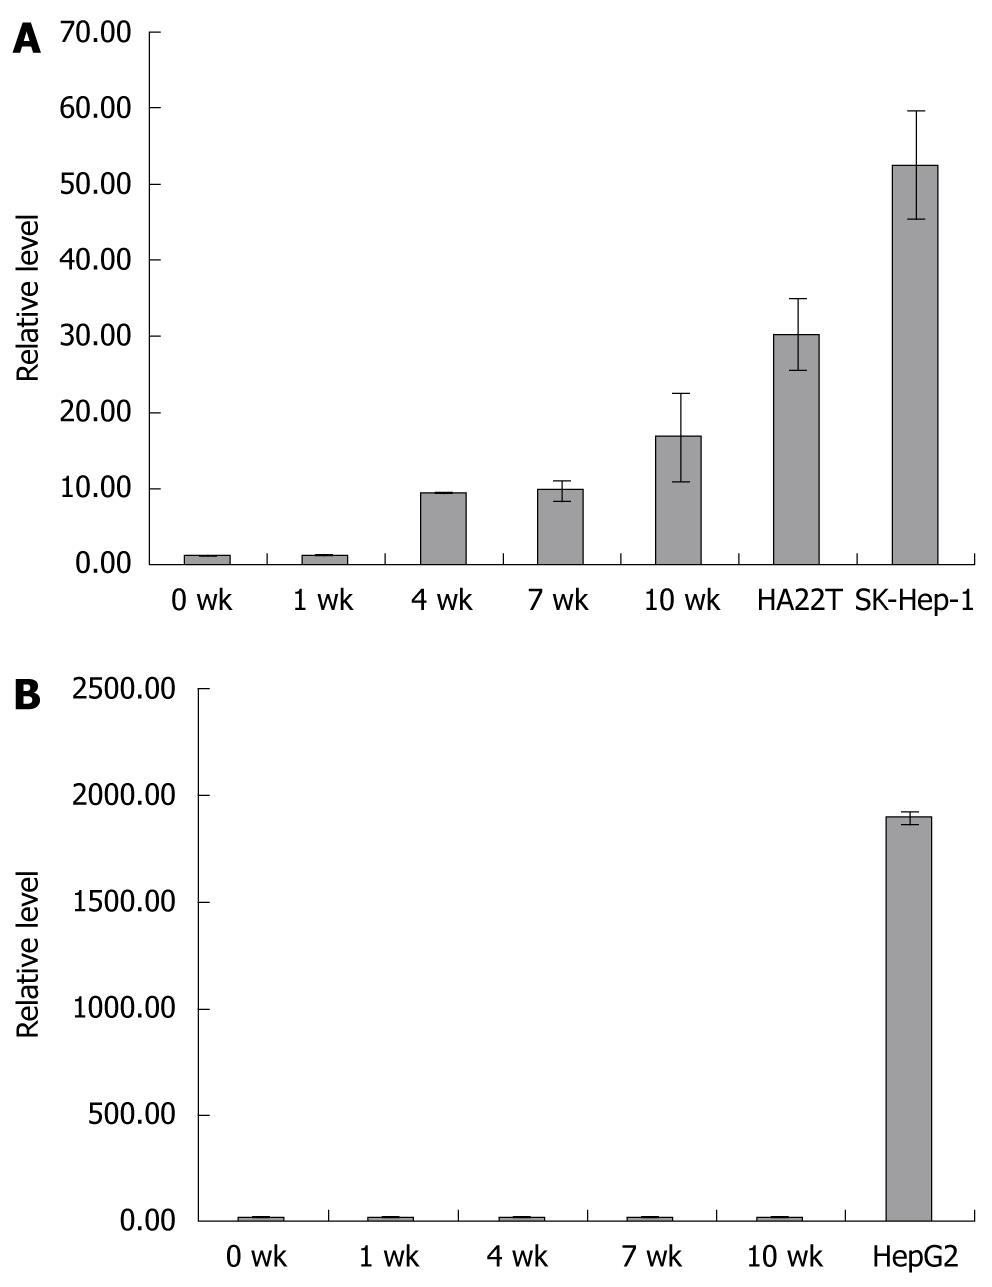
Figure 3 Detection of hepatocyte nuclear factor-4 isoforms in induced mesenchymal stem cells and human hepatoma cell lines by real-time reverse transcription-polymerase chain reaction.
A: The relative level of hepatocyte nuclear factor (HNF)-4γ in induced mesenchymal stem cells (MSCs) at the indicated time point (0, 1, 4, 7 and 10 wk post-induction), HA22T/VGH and SK-Hep-1 cells; B: The relative level of HNF-4α in induced MSCs at the indicated time point (0, 1, 4, 7 and 10 wk post-induction) and HepG2 cells. The relative level at 0 wk was set to 1. The amount of input RNA was normalized using the housekeeping gene β2M. Each column represents the mean ± SD of three independent experiments.
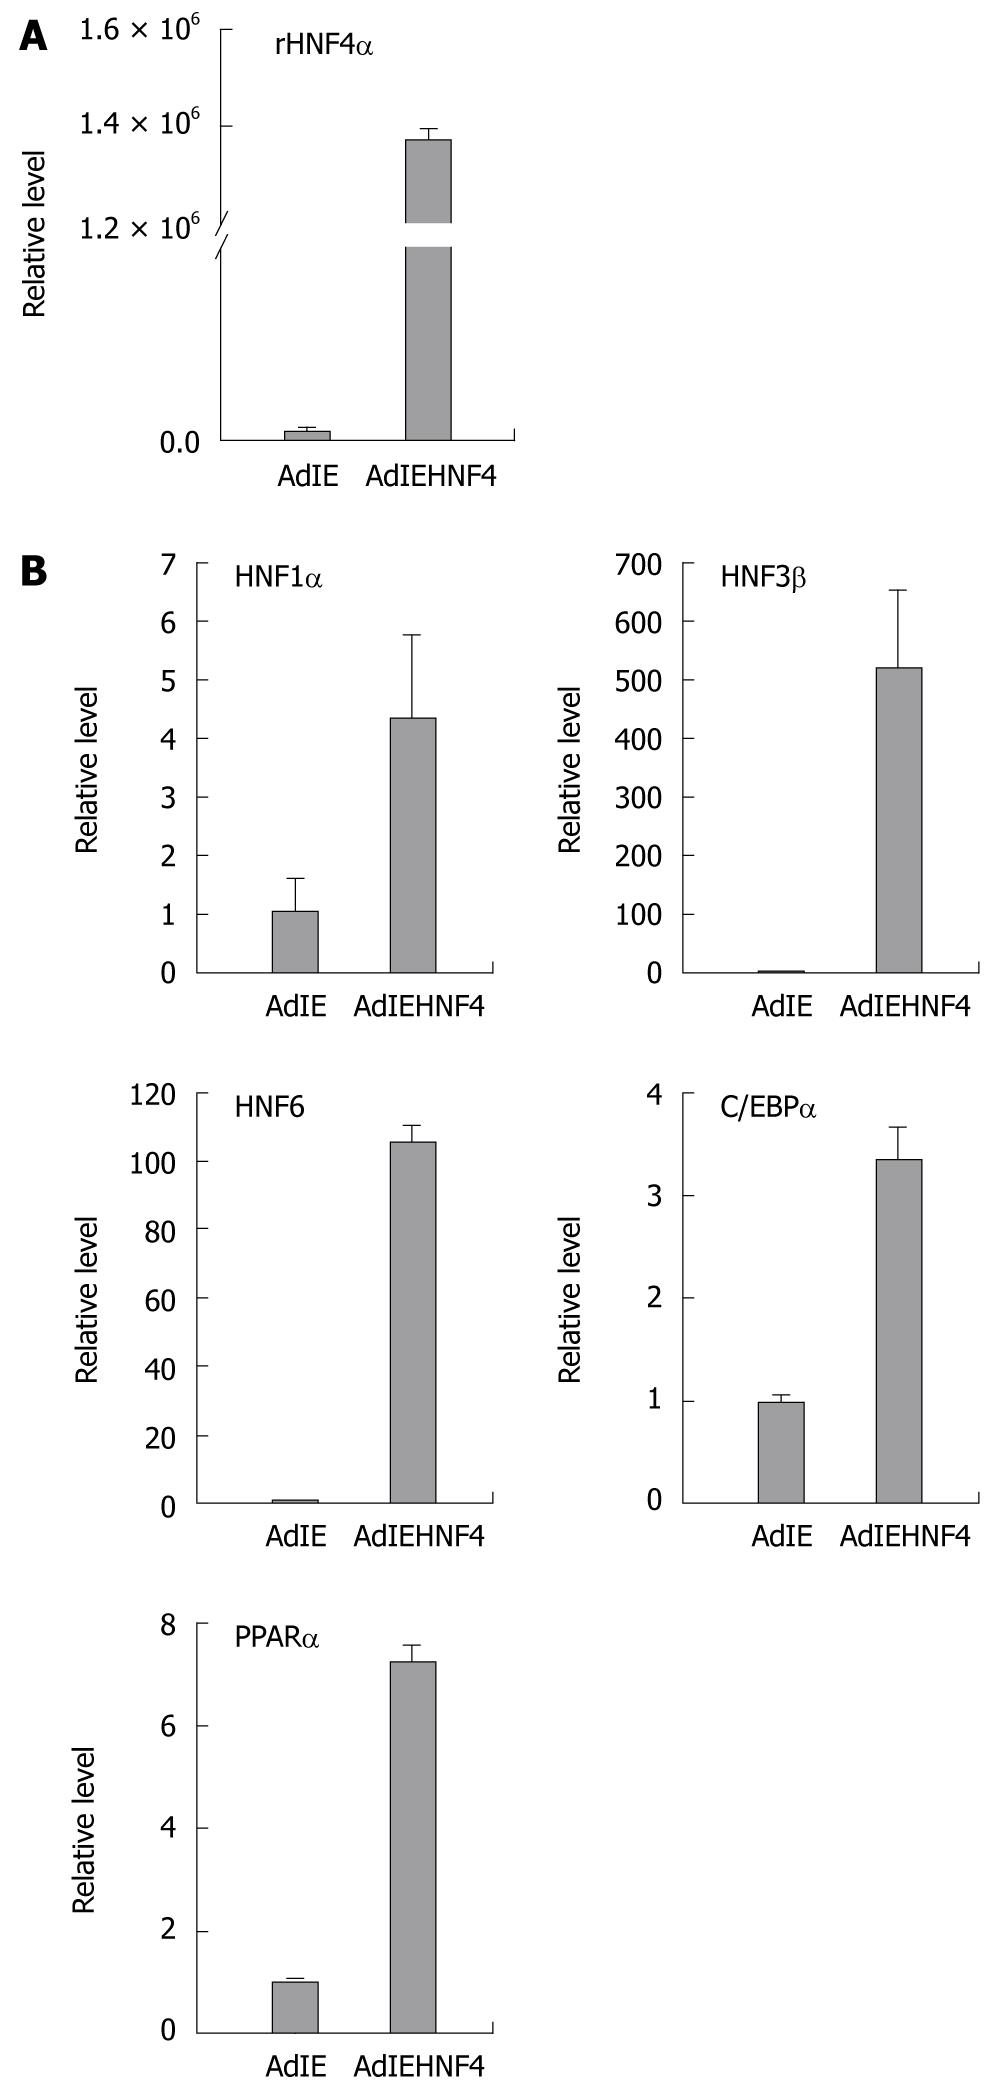
Figure 4 Detection of liver-enriched transcription factors in hepatocyte nuclear factor-4α overexpressing induced mesenchymal stem cells by real-time reverse transcription-polymerase chain reaction.
The induced mesenchymal stem cells (8 wk post-induction) were infected with adenovirus containing rHNF-4α gene (Ad/HNF4α-IRES-EGFP) (indicated as AdIEHNF4) or parental control adenovirus (Ad-IRES-EGFP) (indicated as AdIE). The relative level in the control group was set to 1. A: The overexpression of rHNF4α was demonstrated in the Ad/HNF4α-IRES-EGFP infected cells; B: The induction effect of HNF-4α on the expression of liver-enriched transcription factors was represented as HNF1α, HNF3β, HNF6, C/EBPα and peroxisome proliferator-activated receptor α (PPARα), respectively. The amount of input RNA was normalized using the housekeeping gene hypoxanthine-guanine phosphoribosyltransferase. Each column represents the mean ± SD of three independent experiments and the induction fold for each gene was significant (P < 0.05). HNF: Hepatocyte nuclear factor.
Figure 5 Detection of liver-specific genes in hepatocyte nuclear factor-4α overexpressing induced mesenchymal stem cells by real-time reverse transcription-polymerase chain reaction.
The induced mesenchymal stem cells (8 wk post-induction) were infected with adenovirus containing rHNF-4α gene (indicated as AdIEHNF4) or parental control adenovirus (indicated as AdIE). The relative level of each gene in the control group was set to 1. The induction effect of HNF-4α on the expression of liver-specific genes was represented as Albumin, tyrosine-aminotransferase (TAT), and glucose 6-phosphatase (G6P), respectively. The amount of input RNA was normalized using the hypoxanthine-guanine phosphoribosyltransferase gene. Each column represents the mean ± SD of three independent experiments and the induction fold for each gene was significant (P < 0.05). HNF: Hepatocyte nuclear factor.
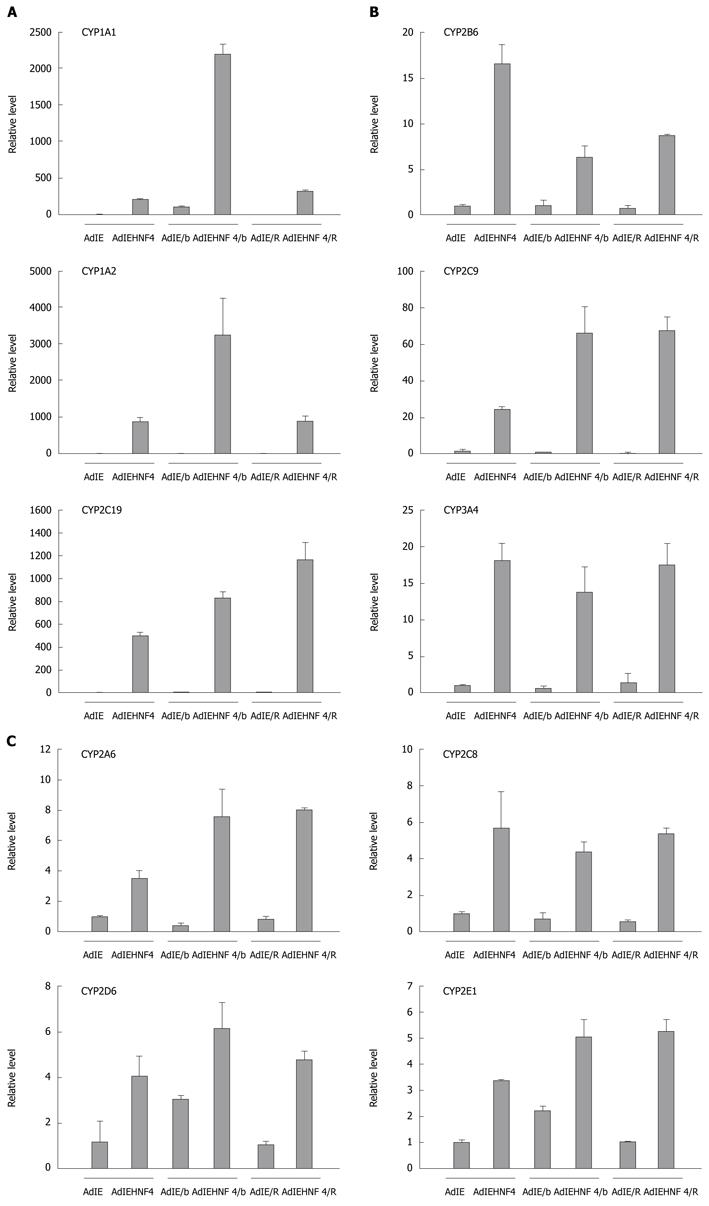
Figure 6 Detection of P450 genes in hepatocyte nuclear factor-4α overexpressing induced mesenchymal stem cells by real-time reverse transcription-polymerase chain reaction.
The induced mesenchymal stem cells (8 wk post-induction) were infected with adenovirus containing rHNF-4α gene (indicated as AdIEHNF4) or parental control adenovirus (indicated as AdIE). The infected cells were further treated with inducer B-naphthoflavone (indicated as AdIE/b or AdIEHNF4/b) or rifampicin (indicated as AdIE/R or AdIEHNF4/R) for 2 d. The relative level of each gene in the control group was set to 1. The induction effect of HNF-4α and/or inducer on the expression of P450 genes is represented as (A) CYP1A1, CYP1A2, and CYP2C19; (B) CYP2B6, CYP2C9, and CYP3A4; (C) CYP2A6, CYP2C8, CYP2D6, and CYP2E1, respectively. The amount of input RNA was normalized using the HPRT gene. Each column represents the mean ± SD of three independent experiments and the induction fold by HNF-4α overexpression for each gene was significant (P < 0.05). HNF: Hepatocyte nuclear factor.
- Citation: Chen ML, Lee KD, Huang HC, Tsai YL, Wu YC, Kuo TM, Hu CP, Chang C. HNF-4α determines hepatic differentiation of human mesenchymal stem cells from bone marrow. World J Gastroenterol 2010; 16(40): 5092-5103
- URL: https://www.wjgnet.com/1007-9327/full/v16/i40/5092.htm
- DOI: https://dx.doi.org/10.3748/wjg.v16.i40.5092


