Copyright
copy;2010 Baishideng Publishing Group Co.
World J Gastroenterol. Oct 21, 2010; 16(39): 4922-4931
Published online Oct 21, 2010. doi: 10.3748/wjg.v16.i39.4922
Published online Oct 21, 2010. doi: 10.3748/wjg.v16.i39.4922
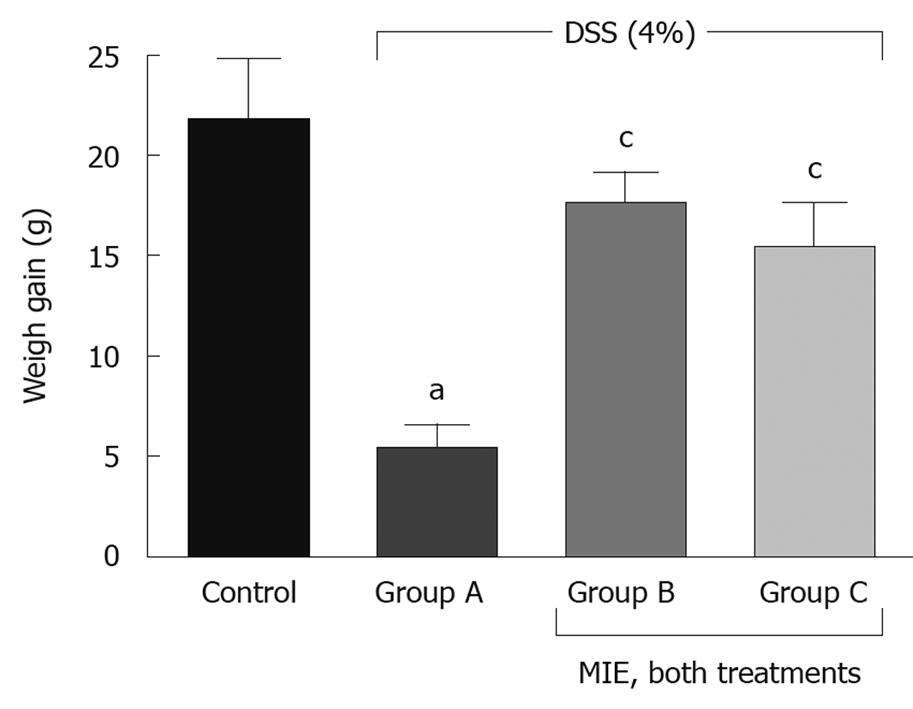
Figure 1 Effect of Mangifera indica L.
on weight gain in dextran sulfate sodium-treated rat ulcerative colitis. Experimental colitis was induced by 4% dextran sulfate sodium (DSS) dissolved in drinking water for 7 d. Control group received common water; Group A was exposed to 4% DSS and vehicle; Group B was co-treated with rectal Mangifera indica L. (MIE) for 7 d, at the same time as DSS administration; Group C was treated with MIE (150 mg/kg) orally during 14 d prior to DSS administration, and co-administered rectally during DSS exposure. Each bar represents the difference between the weight at the beginning and ending of the experiment, and it was expressed as the mean ± SE of each group. aSignificant differences vs control group; cSignificant differences vs group A; P < 0.05.
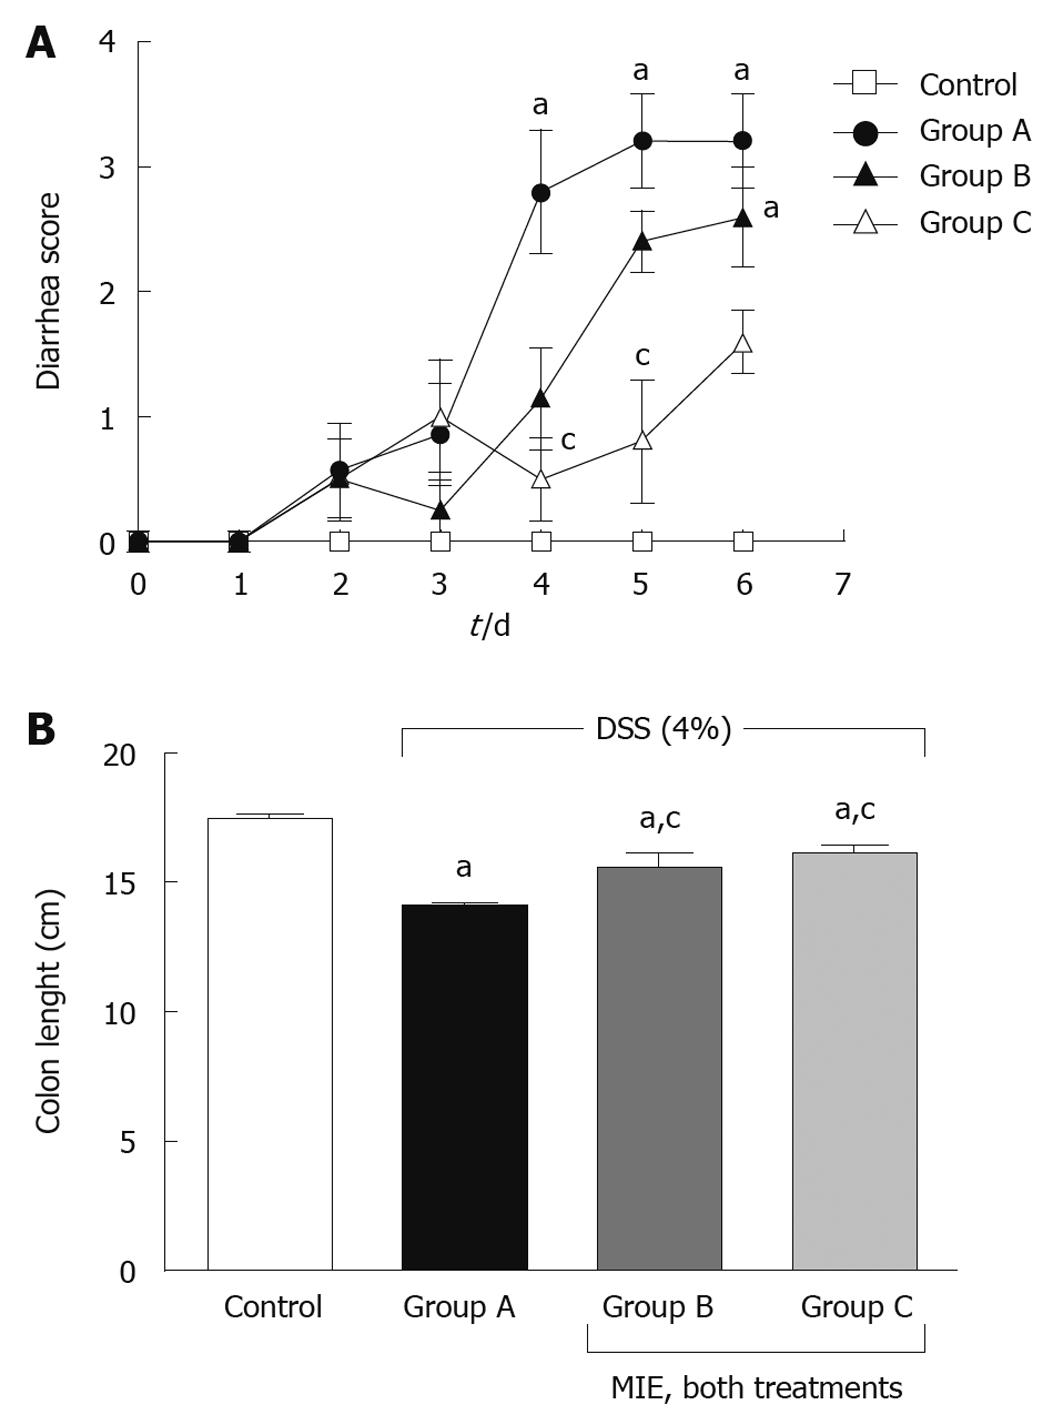
Figure 2 Effect of Mangifera indica L.
on diarrhea and colon length in dextran sulfate sodium-treated rat ulcerative colitis. Induction of experimental colitis, the control group, and groups A, B and C were as described for Figure 1. Changes in diarrhea score (A) and colon length (B) after 4% dextran sulfate sodium treatment in the presence or absence of Mangifera indica L. (MIE) are presented. aSignificant differences vs control group; cSignificant differences vs group A; P < 0.05. DSS: Dextran sulfate sodium.
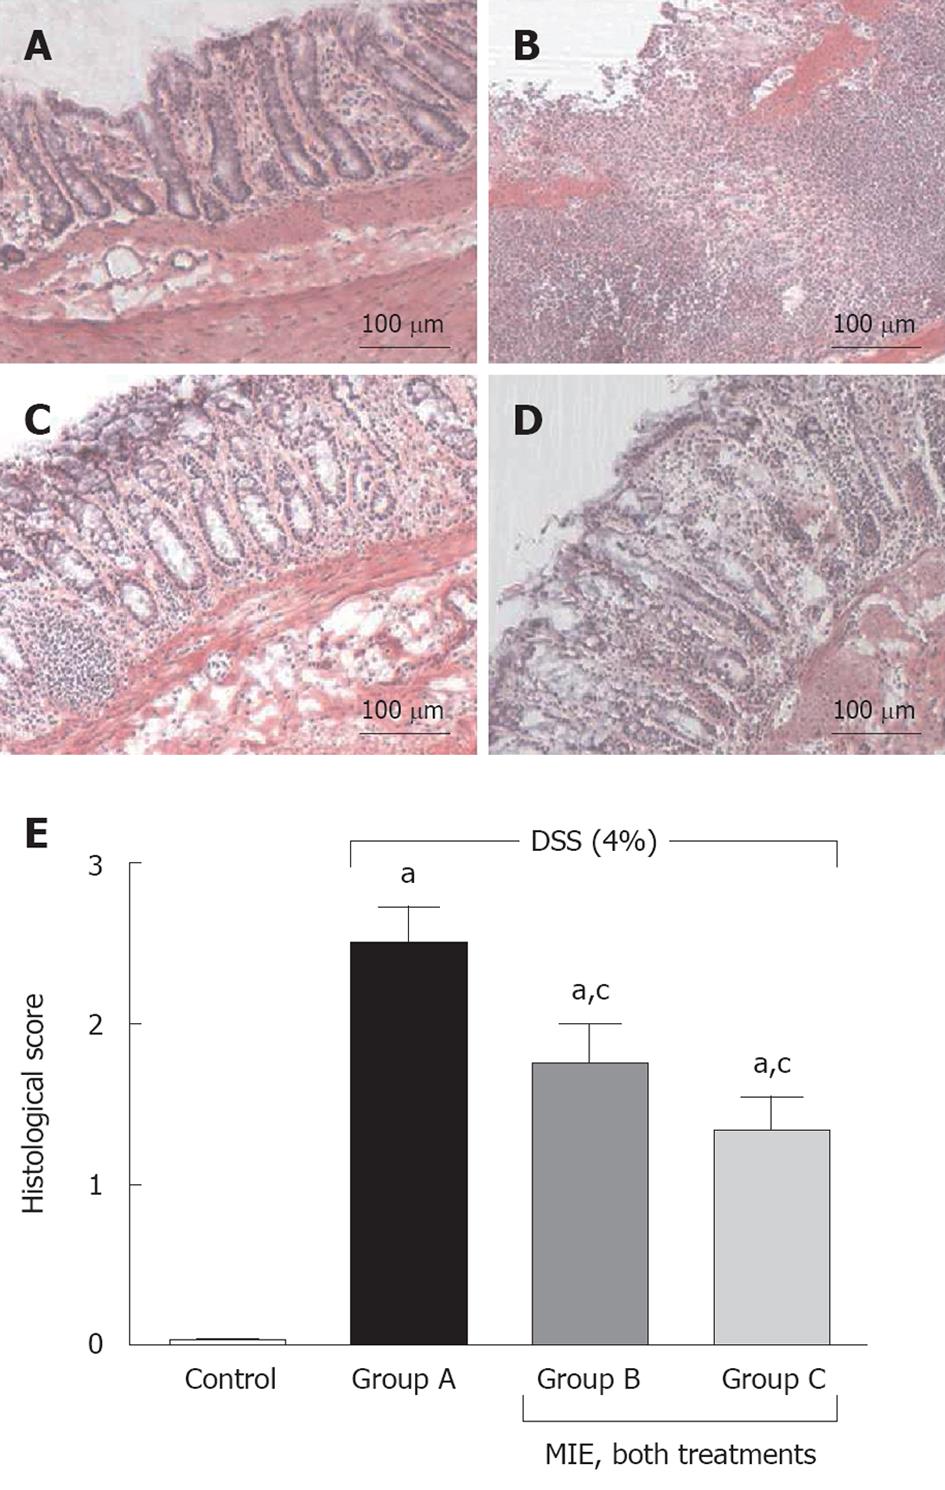
Figure 3 Hematoxylin and eosin staining of colons obtained from rats untreated or treated with dextran sulfate sodium (4%) and Mangifera indica L.
. A: Control group: Received common water (100 ×); B: Exposed to 4% dextran sulfate sodium (DSS) and vehicle (100 ×); C: Co-treated with Mangifera indica L. (MIE) rectally (150 mg/kg) for 7 d, at the same time as DSS administration (100 ×); D: Treated with MIE (150 mg/kg) orally during 14 d prior to DSS administration, and co-administered rectally during DSS exposure (100 ×); E: Changes in histological score were assigned according to criteria defined in the Material and Methods. Each bar represents the mean ± SE of the different groups. aSignificant differences vs control group; cSignificant differences vs group A; P < 0.05.
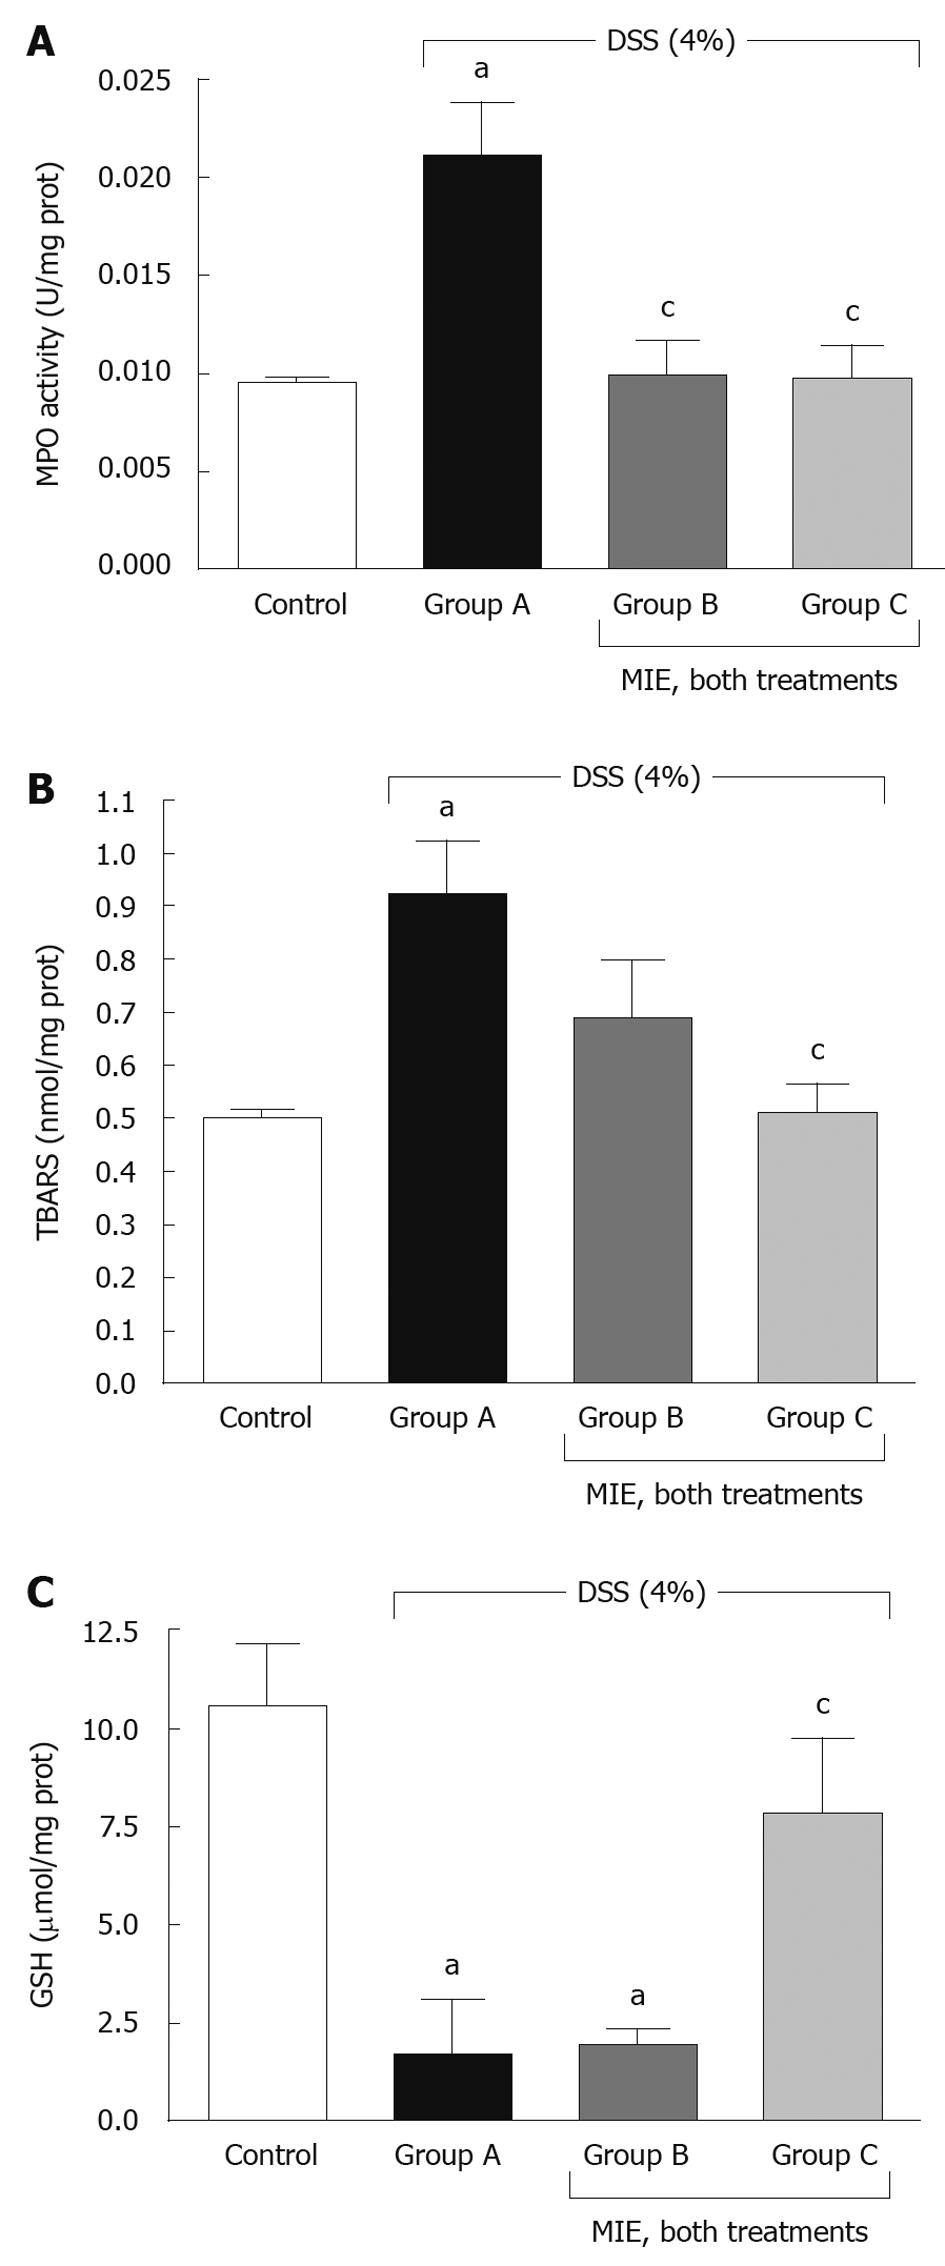
Figure 4 Effect of Mangifera indica L.
on myeloperoxidase activity, lipid peroxidation and glutathione levels in dextran sulfate sodium-treated rat colon tissue. Induction of experimental colitis, the control group, and groups A, B and C were as described for Figure 1. Each bar represents the mean ± SE of each group. aSignificant differences vs control group; cSignificant differences vs group A; P < 0.05. A: Myeloperoxidase (MPO) levels were determined; B: Lipid peroxidation was estimated according to the presence of thiobarbituric acid reactive substances (TBARS); C: Glutathione (GSH) levels were determined. MIE: Mangifera indica L.; DSS: Dextran sulfate sodium.
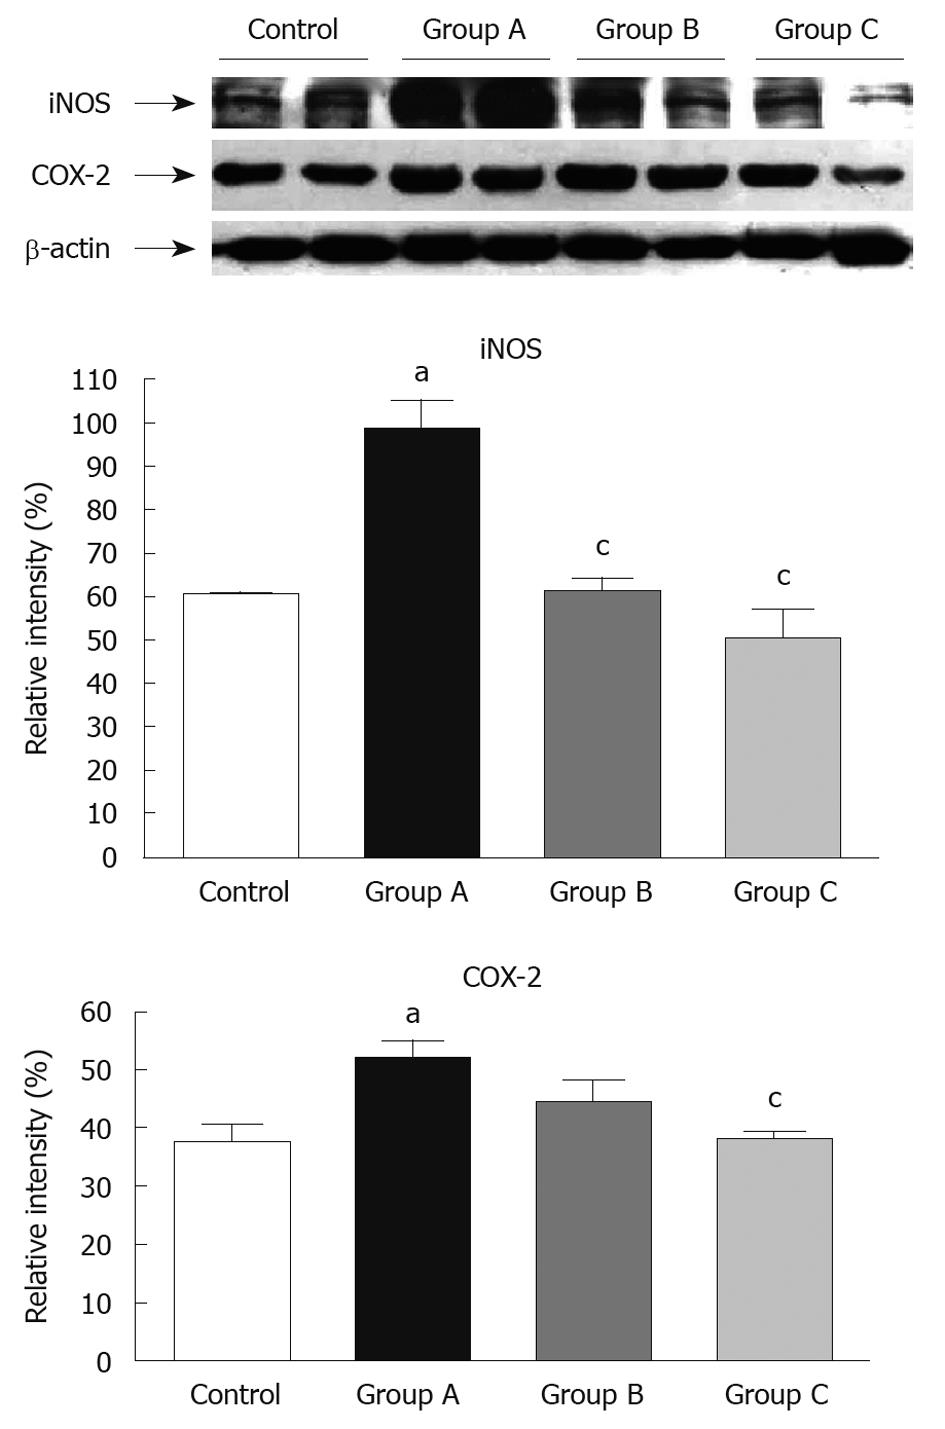
Figure 5 Effect of Mangifera indica L.
on isoforms of nitric oxide synthase and cyclooxygenase-2 production in dextran sulfate sodium-treated rat colon tissue. Induction of experimental colitis, the control group, and groups A, B and C were as described for Figure 1. The protein extracts were obtained as described in the Materials and Methods. β-actin was used as an internal control. Expression of isoforms of nitric oxide synthase (iNOS) and cyclooxygenase (COX)-2 proteins were analyzed by Western blotting using iNOS and COX-2 polyclonal antibodies. The relative intensity was calculated using imaging software. Each bar represents the mean ± SE of each group. aSignificant differences vs control group; cSignificant differences vs group A; P < 0.05.
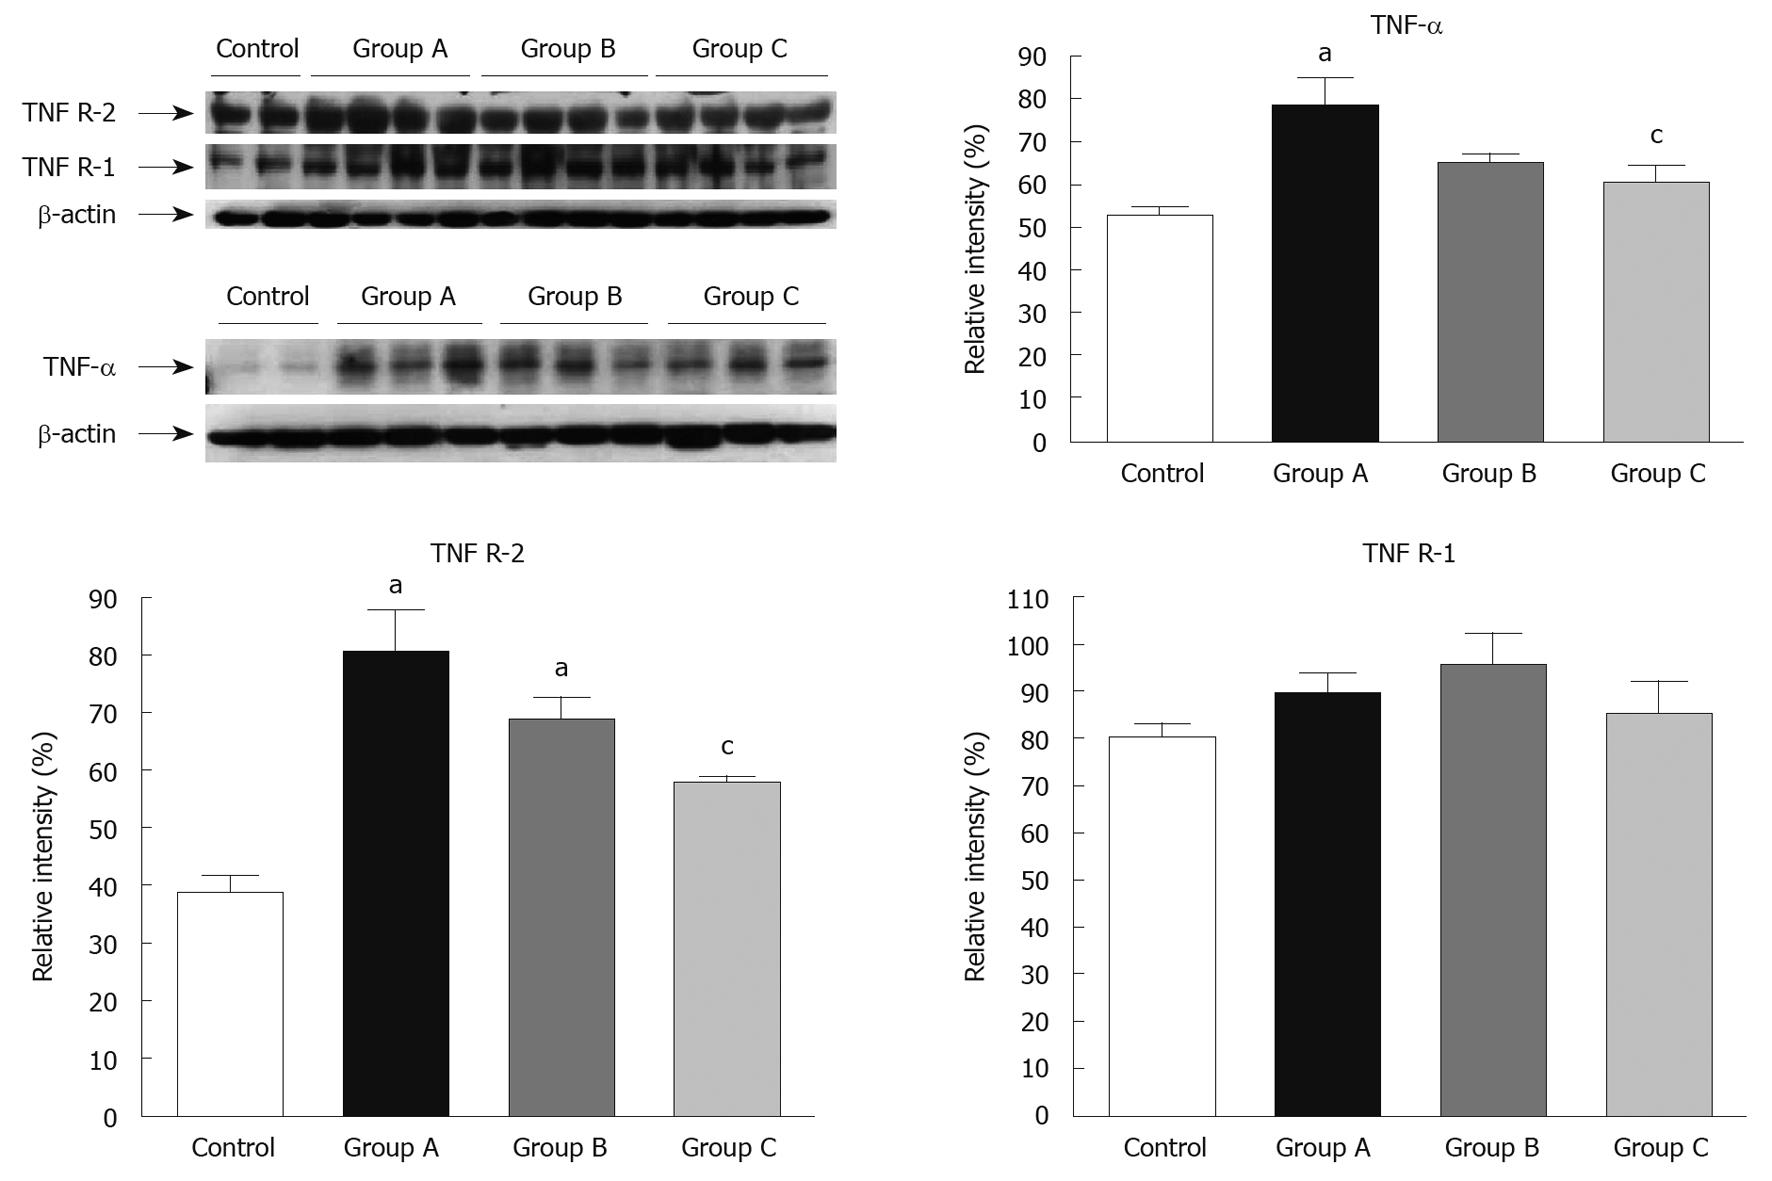
Figure 6 Effect of Mangifera indica L.
on tumor necrosis factor-α and tumor necrosis factor receptor production in dextran sulfate sodium-treated rat colon tissue. Induction of experimental colitis, the control group, and groups A, B and C were as described for Figure 1. The protein extracts were obtained as described in the Materials and Methods. β-actin was used as an internal control. Expression of tumor necrosis factor (TNF)-α and TNF receptor proteins was analyzed by western blotting using TNF-α, TNF R-1 and TNF R-2 polyclonal antibodies. The relative intensity was calculated using imaging software. Each bar represents the mean ± SE of each group. aSignificant differences vs control group; cSignificant differences vs group A; P < 0.05.
-
Citation: Márquez L, Pérez-Nievas BG, Gárate I, García-Bueno B, Madrigal JL, Menchén L, Garrido G, Leza JC. Anti-inflammatory effects of
Mangifera indica L. extract in a model of colitis. World J Gastroenterol 2010; 16(39): 4922-4931 - URL: https://www.wjgnet.com/1007-9327/full/v16/i39/4922.htm
- DOI: https://dx.doi.org/10.3748/wjg.v16.i39.4922


