Copyright
©2010 Baishideng Publishing Group Co.
World J Gastroenterol. Oct 14, 2010; 16(38): 4800-4808
Published online Oct 14, 2010. doi: 10.3748/wjg.v16.i38.4800
Published online Oct 14, 2010. doi: 10.3748/wjg.v16.i38.4800
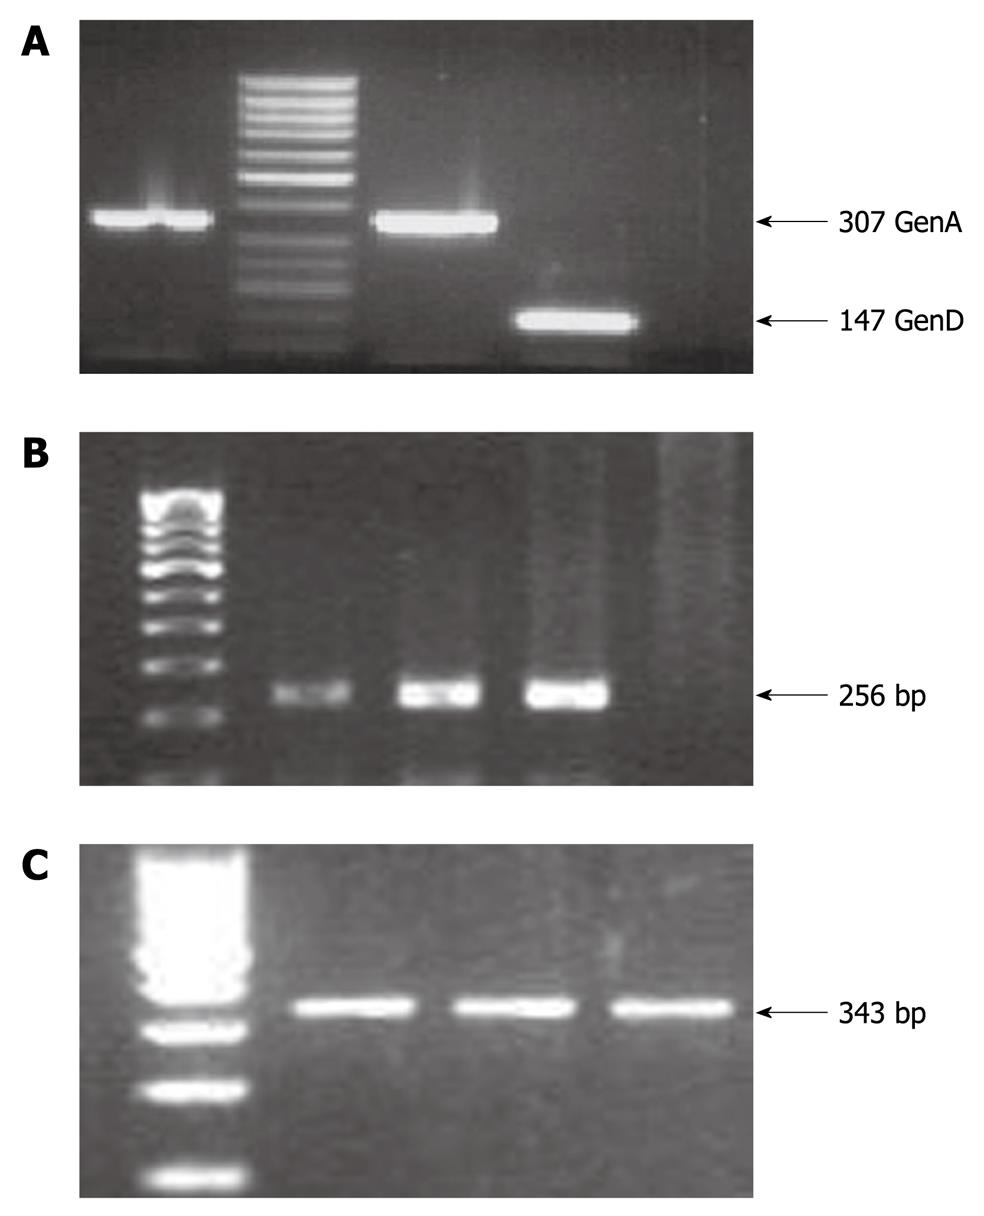
Figure 1 Polymerase chain reaction amplification results.
A: Hepatitis B virus (HBV) genotyping results, where an amplicon of 307 bp represents HBV genotype A whereas an amplicon of 147 bp represents HBV genotype D; B: Hepatitis C virus (HCV) amplicon of 256 bp for the 5’UTR region; C: Hepatitis E virus (HEV) amplicon of 343 bp for the ORF1 region. The HCV and HEV amplicons were purified by gel extraction and subjected to direct sequencing for genotype determination on comparison with the standard NCBI representative sequences for HCV and HEV.
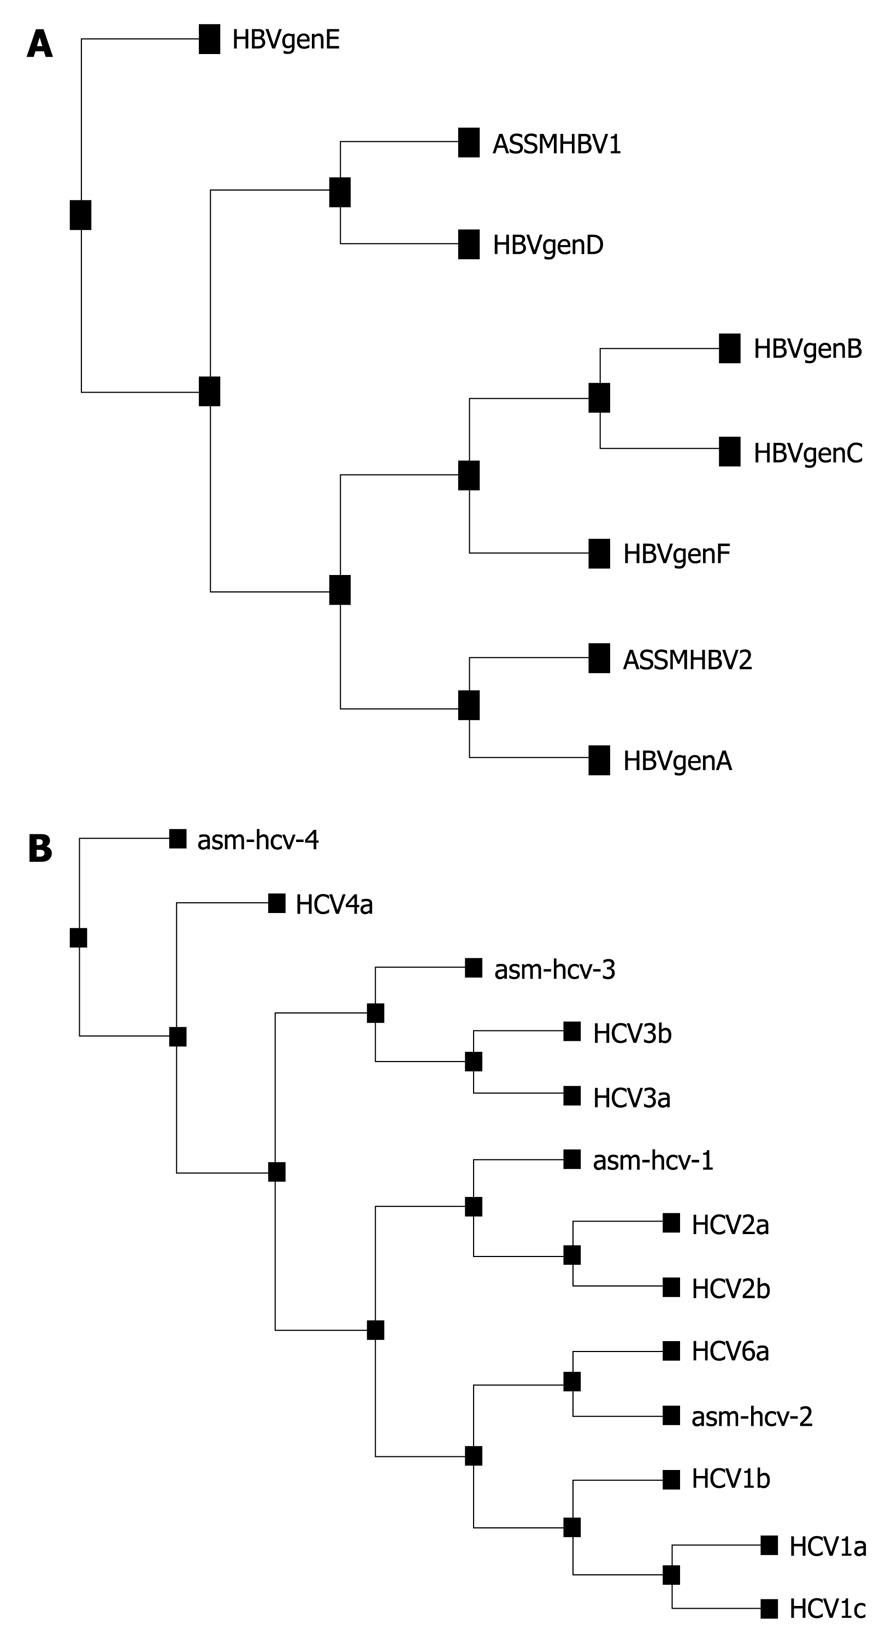
Figure 2 Phylogenetic analysis using the Expasy software tool.
A: Randomly sequenced hepatitis B virus (HBV) cases representing HBV genotype D (ASSMHBV1) and A (ASSMHBV2) by multiplex polymerase chain reaction genotyping, therefore confirming and validating our genotyping results; B: Hepatitis C virus (HCV) genotype base on direct sequencing of 5’UTR for isolate from Guwahati.
Figure 3 Polymerase chain reaction-restriction fragment length polymorphism results for Cytochrome P450 2E1 rsaI genotyping for the control and liver disease cases.
Lane 1 and 2 in the control section and lane 1-5 and 7 of the liver disease section represents c1/c1 genotype (360 + 50 bp); whereas lane 6 of the liver disease section repre-sents c1/c2 genotype (410 + 360 + 50 bp). Nd: Non-digested samples of 410 bp.
Figure 4 Presence of nitrite in (μg/mL) in different food products routinely consumed in Northeast India.
-
Citation: Deka M, Bose M, Baruah B, Bose PD, Medhi S, Bose S, Saikia A, Kar P. Role of
CYP2E1 gene polymorphisms association with hepatitis risk in Northeast India. World J Gastroenterol 2010; 16(38): 4800-4808 - URL: https://www.wjgnet.com/1007-9327/full/v16/i38/4800.htm
- DOI: https://dx.doi.org/10.3748/wjg.v16.i38.4800


