Copyright
©2010 Baishideng Publishing Group Co.
World J Gastroenterol. Oct 7, 2010; 16(37): 4716-4724
Published online Oct 7, 2010. doi: 10.3748/wjg.v16.i37.4716
Published online Oct 7, 2010. doi: 10.3748/wjg.v16.i37.4716
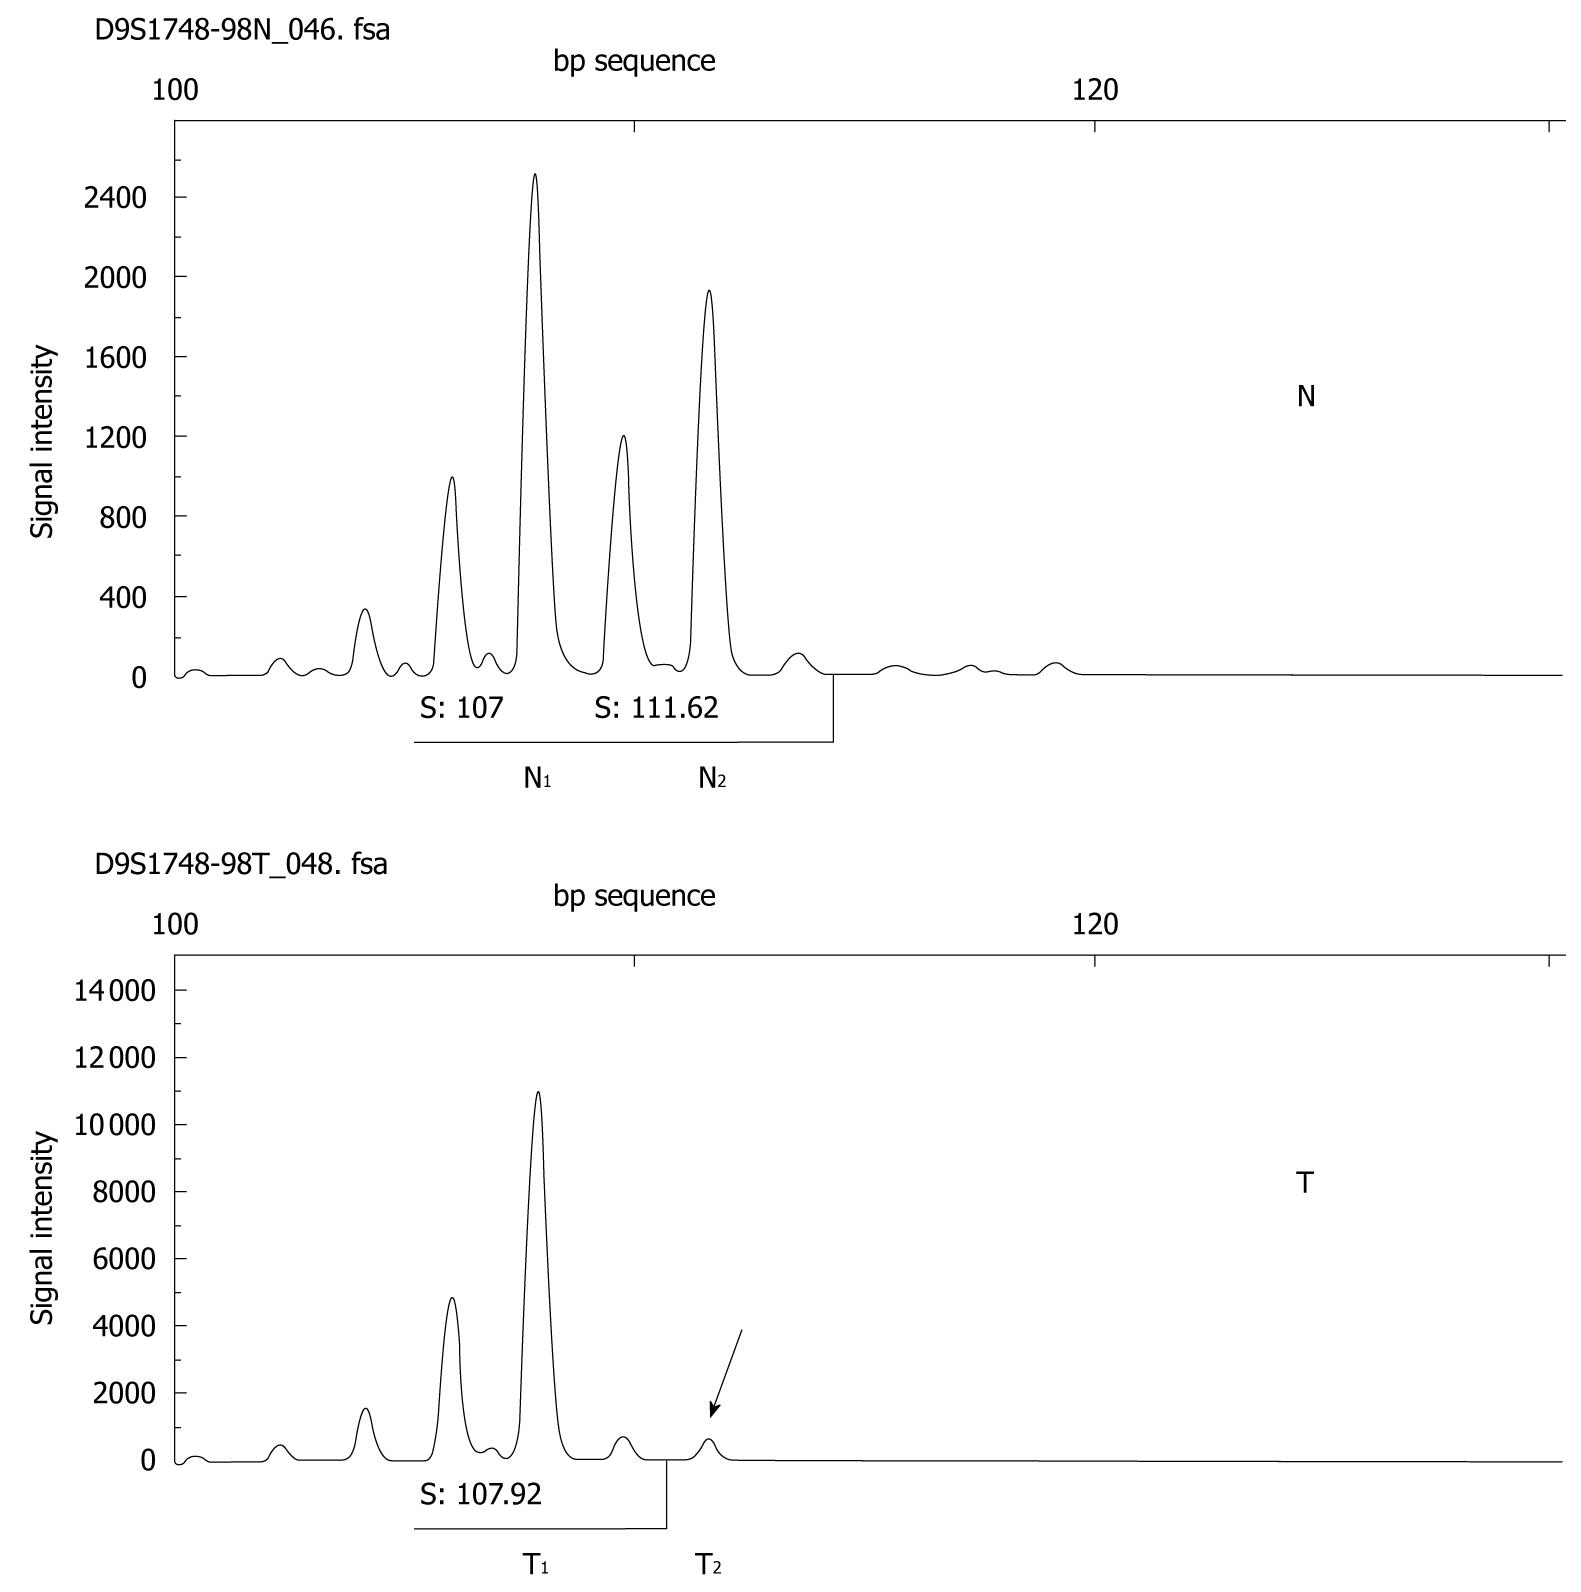
Figure 1 Representative image of loss of heterozygosity.
Black arrow indicates the lost allele. Allele ratio = (T1:T2)/(N1:N2). N: Normal; T: Tumor.
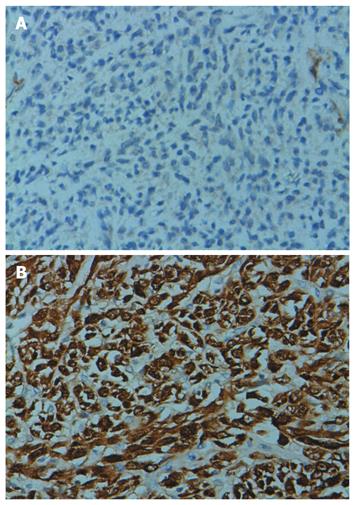
Figure 2 p16 immunostaining in gastrointestinal stromal tumor.
A: Negative p16 immunostaining in gastrointestinal stromal tumor (GIST) (200 ×); B: p16 immunostaining ++++ in GIST (200 ×).
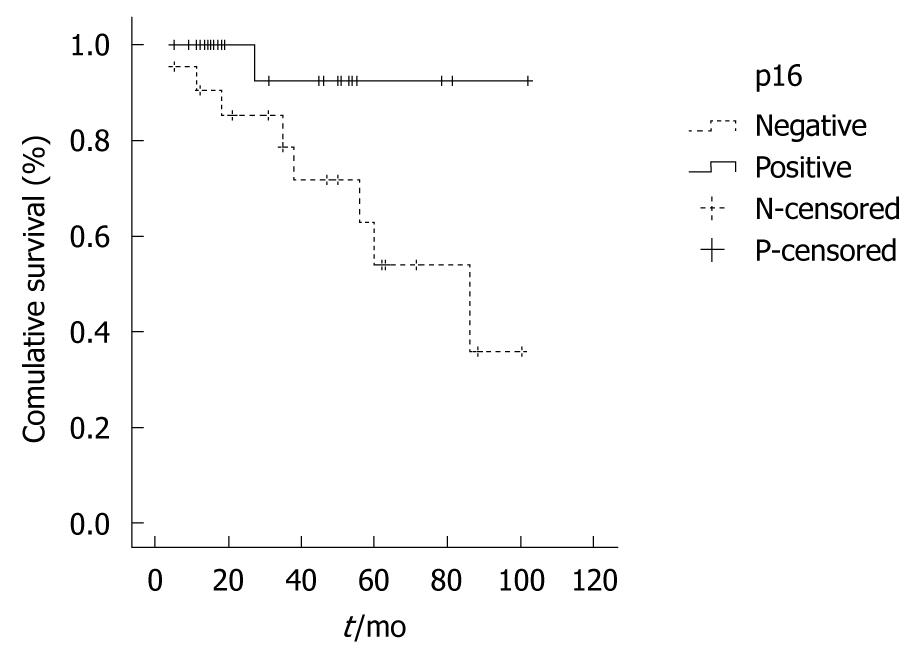
Figure 3 Kaplan-Meier plot for overall survival of gastrointestinal stromal tumor patients with p16-negative and p16-positive alterations (P < 0.
05).
- Citation: Zhang Y, Cao H, Wang M, Zhao WY, Shen ZY, Shen DP, Ni XZ, Wu ZY, Shen YY, Song YY. Loss of chromosome 9p21 and decreased p16 expression correlate with malignant gastrointestinal stromal tumor. World J Gastroenterol 2010; 16(37): 4716-4724
- URL: https://www.wjgnet.com/1007-9327/full/v16/i37/4716.htm
- DOI: https://dx.doi.org/10.3748/wjg.v16.i37.4716


