Copyright
©2010 Baishideng Publishing Group Co.
World J Gastroenterol. Sep 21, 2010; 16(35): 4460-4466
Published online Sep 21, 2010. doi: 10.3748/wjg.v16.i35.4460
Published online Sep 21, 2010. doi: 10.3748/wjg.v16.i35.4460
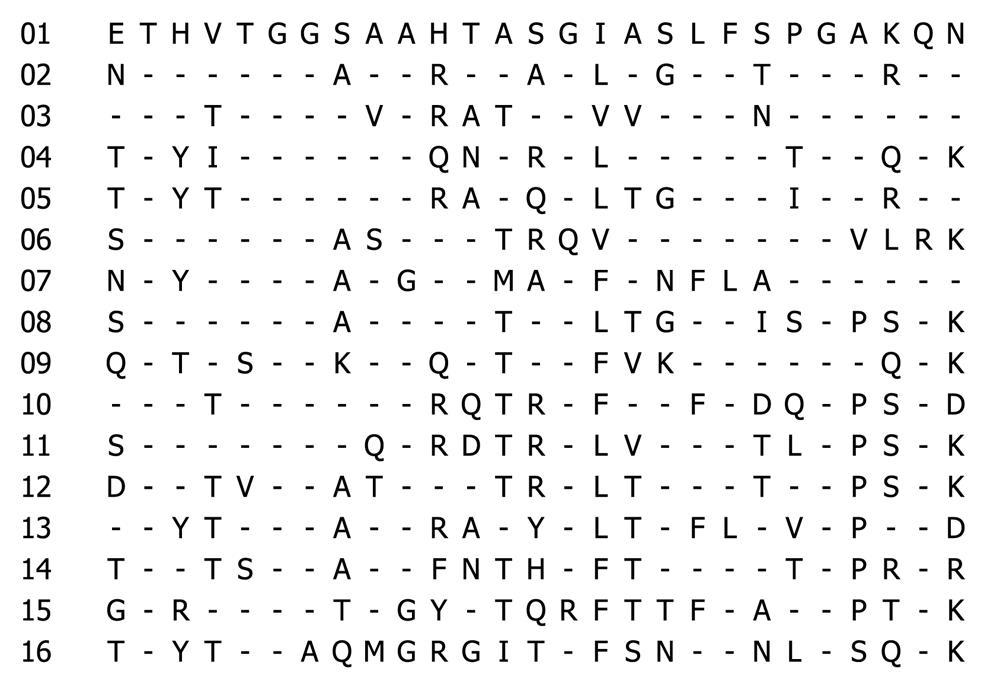
Figure 1 The amino acid sequences of the 16 representative hypervariable region 1 proteins.
Sequences are shown with a single-letter amino acid code, and dashes indicate residues identical at that position with the reference sequence above.
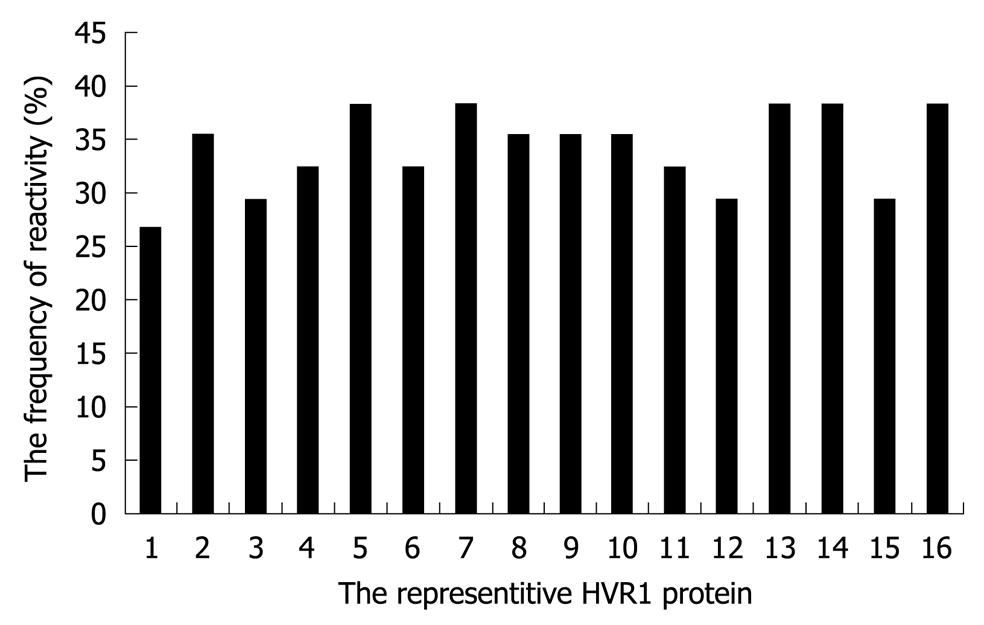
Figure 2 The frequency of reactivity of each representative hypervariable region 1 protein with in-house panel.
HVR1: Hypervariable region 1.
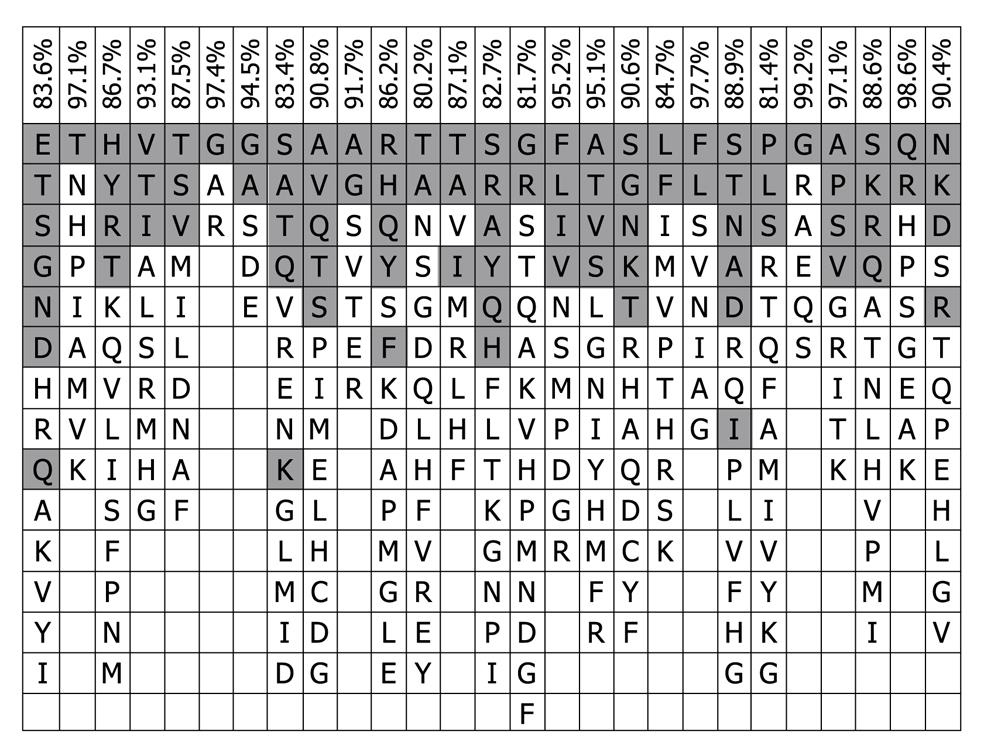
Figure 3 Consensus patterns of the 843 natural variants of the hepatitis C virus hypervariable region 1 sequences used in this work.
Residues are listed in decreasing order of observed frequency from top to bottom. The residues in shade are present in 16 representative hypervariable region 1 proteins, and the total frequency of the shaded resides was expressed as percentages on the top of the consensus pattern.
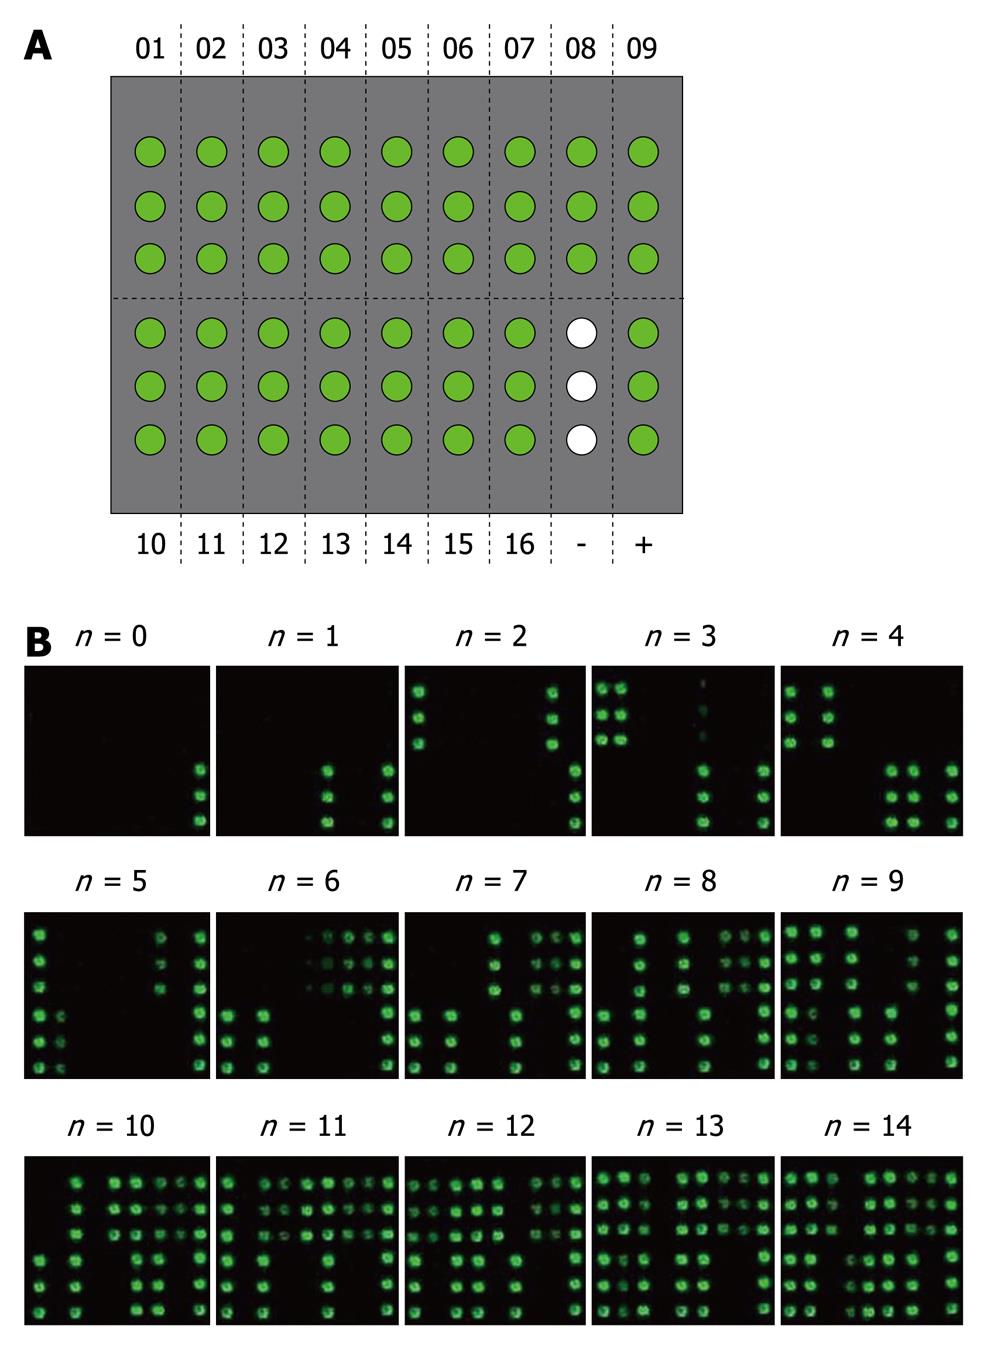
Figure 4 Evaluation of the cross-reactivity of anti-hypervariable region 1 antibodies in sera of chronic hepatitis C virus patients.
A: Microarray patterns of 16 representative hypervariable region 1 (HVR1) proteins. The representative HVR1 proteins, negative and positive controls were printed in three replicates on the microarray; B: The value of cross-reactive responses for each sample. The number under the picture represents the value of cross-reactivity evaluated by the sum of HVR1 antigens reacted with hepatitis C virus sera.
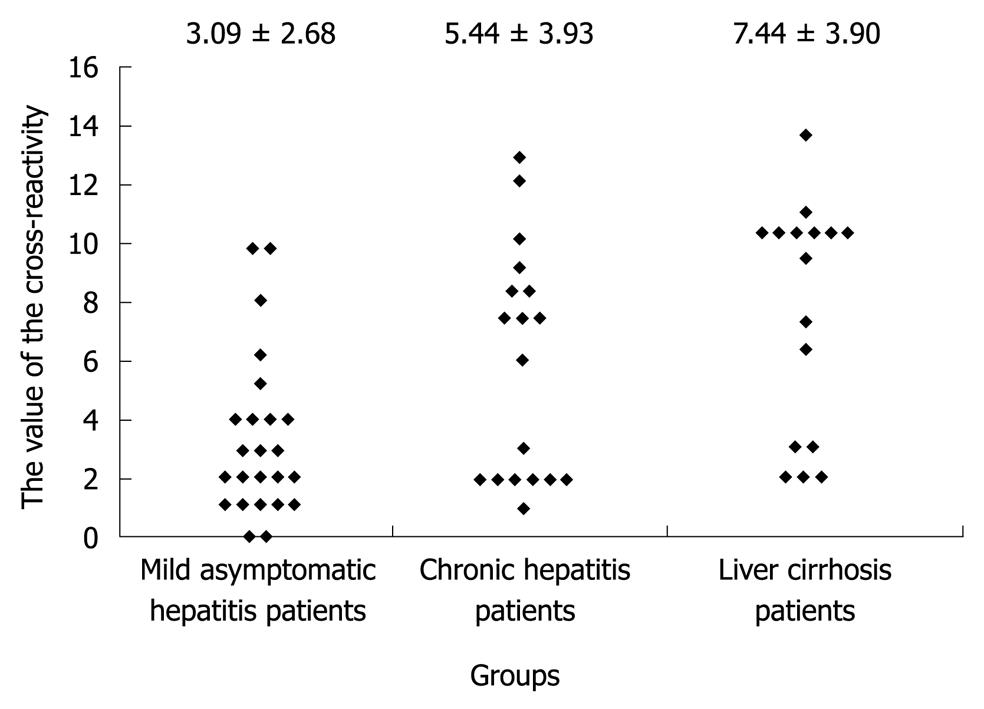
Figure 5 Relationship between the value of the cross-reactivity of hypervariable region 1 antibodies of the hepatitis C virus sera, as determined by the number of representative hypervariable region 1 proteins, and the severity of liver disease in patients with chronic hepatitis C virus infection.
- Citation: Xiu BS, Feng XY, He J, Wang GH, Zhang XY, Zhang HQ, Song XG, Chen K, Ling SG, Zhu CX, Wei L, Rao HY. Evaluation of cross-reactive antibody response to HVR1 in chronic hepatitis C. World J Gastroenterol 2010; 16(35): 4460-4466
- URL: https://www.wjgnet.com/1007-9327/full/v16/i35/4460.htm
- DOI: https://dx.doi.org/10.3748/wjg.v16.i35.4460


