Copyright
©2010 Baishideng.
World J Gastroenterol. Aug 14, 2010; 16(30): 3827-3833
Published online Aug 14, 2010. doi: 10.3748/wjg.v16.i30.3827
Published online Aug 14, 2010. doi: 10.3748/wjg.v16.i30.3827
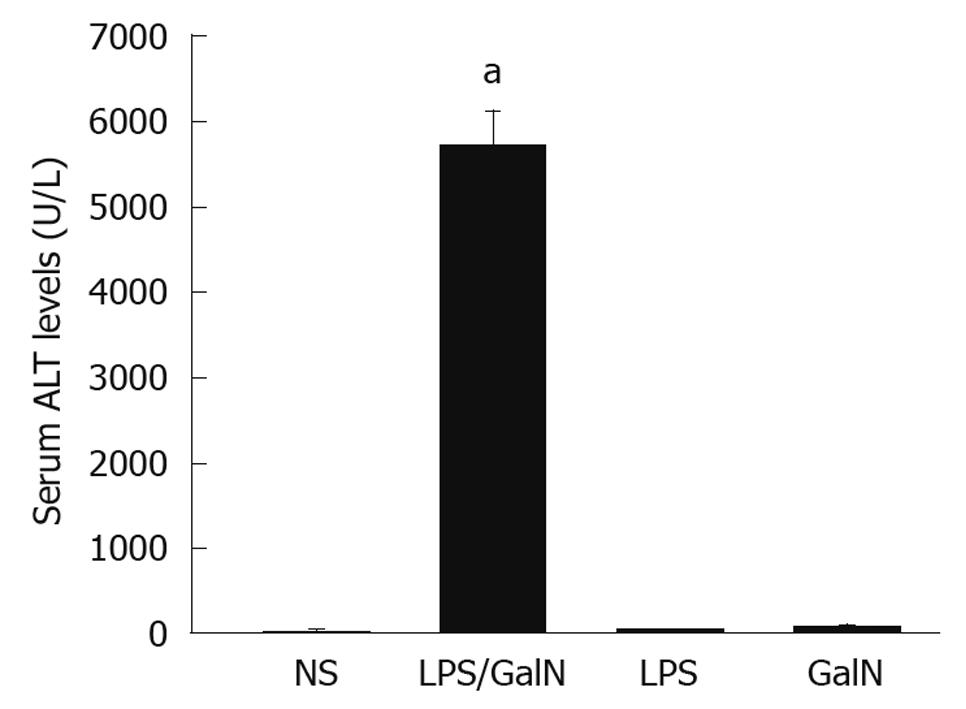
Figure 1 Serum alanine transaminase levels.
Each value was expressed as mean ± SE. aP < 0.05 vs normal saline (NS). ALT: Alanine transaminase; GalN: Galactosamine; LPS: Lipopolysaccharide.
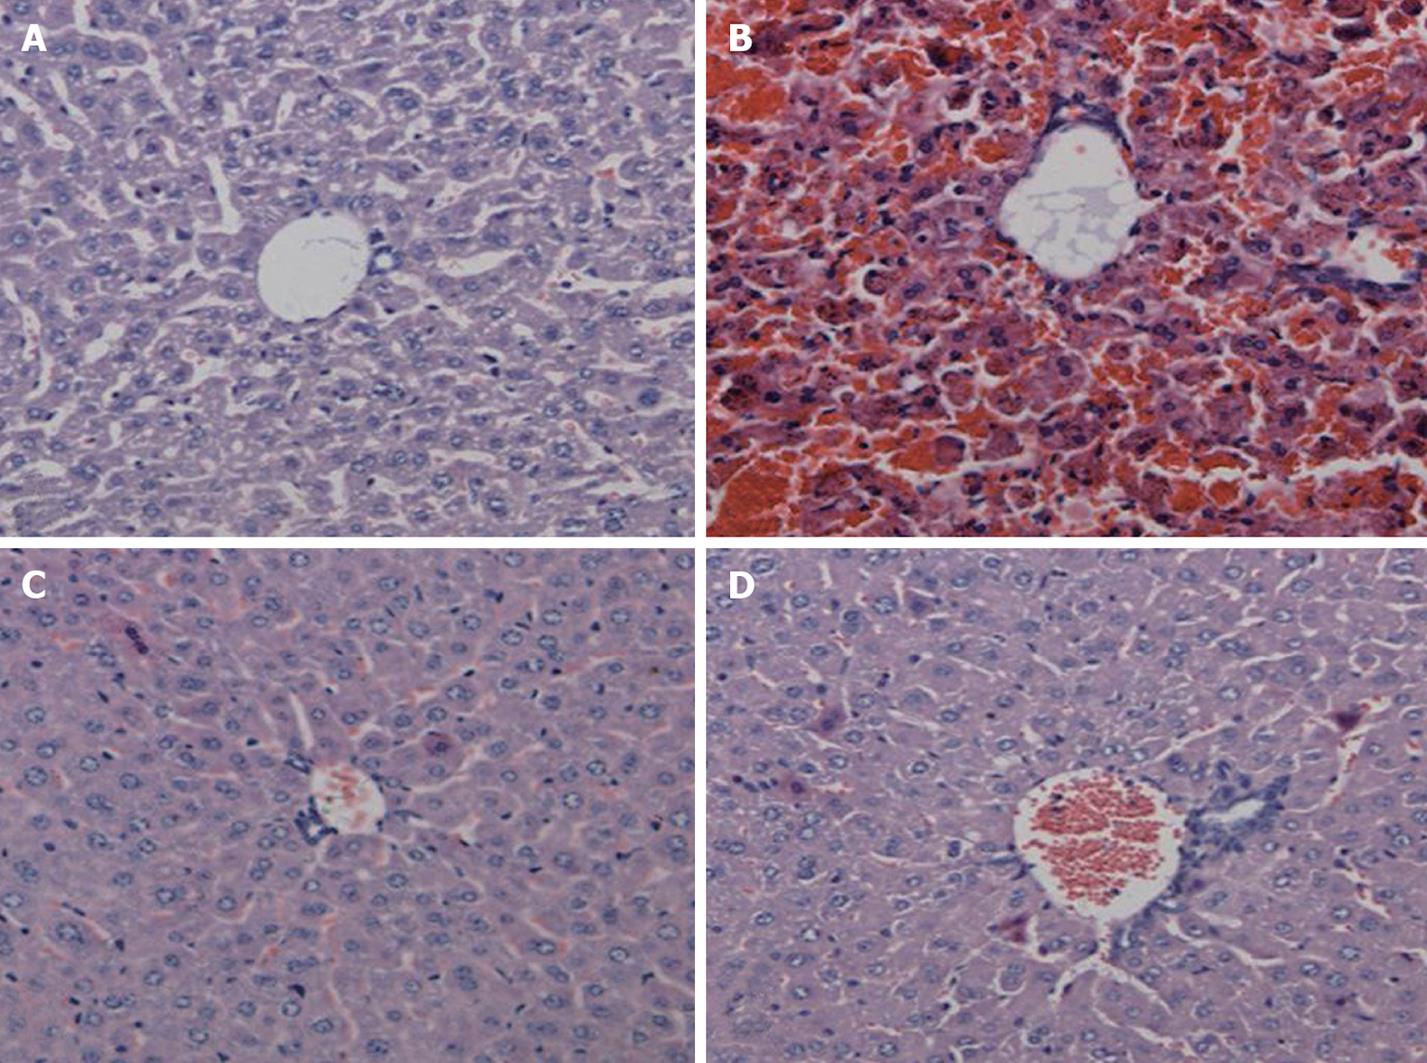
Figure 2 Hematoxylin and eosin staining of liver tissue (100 ×).
A: Normal group; B: Acute liver necrosis group; C: Lipopolysaccharide group; D: Galactosamine group.
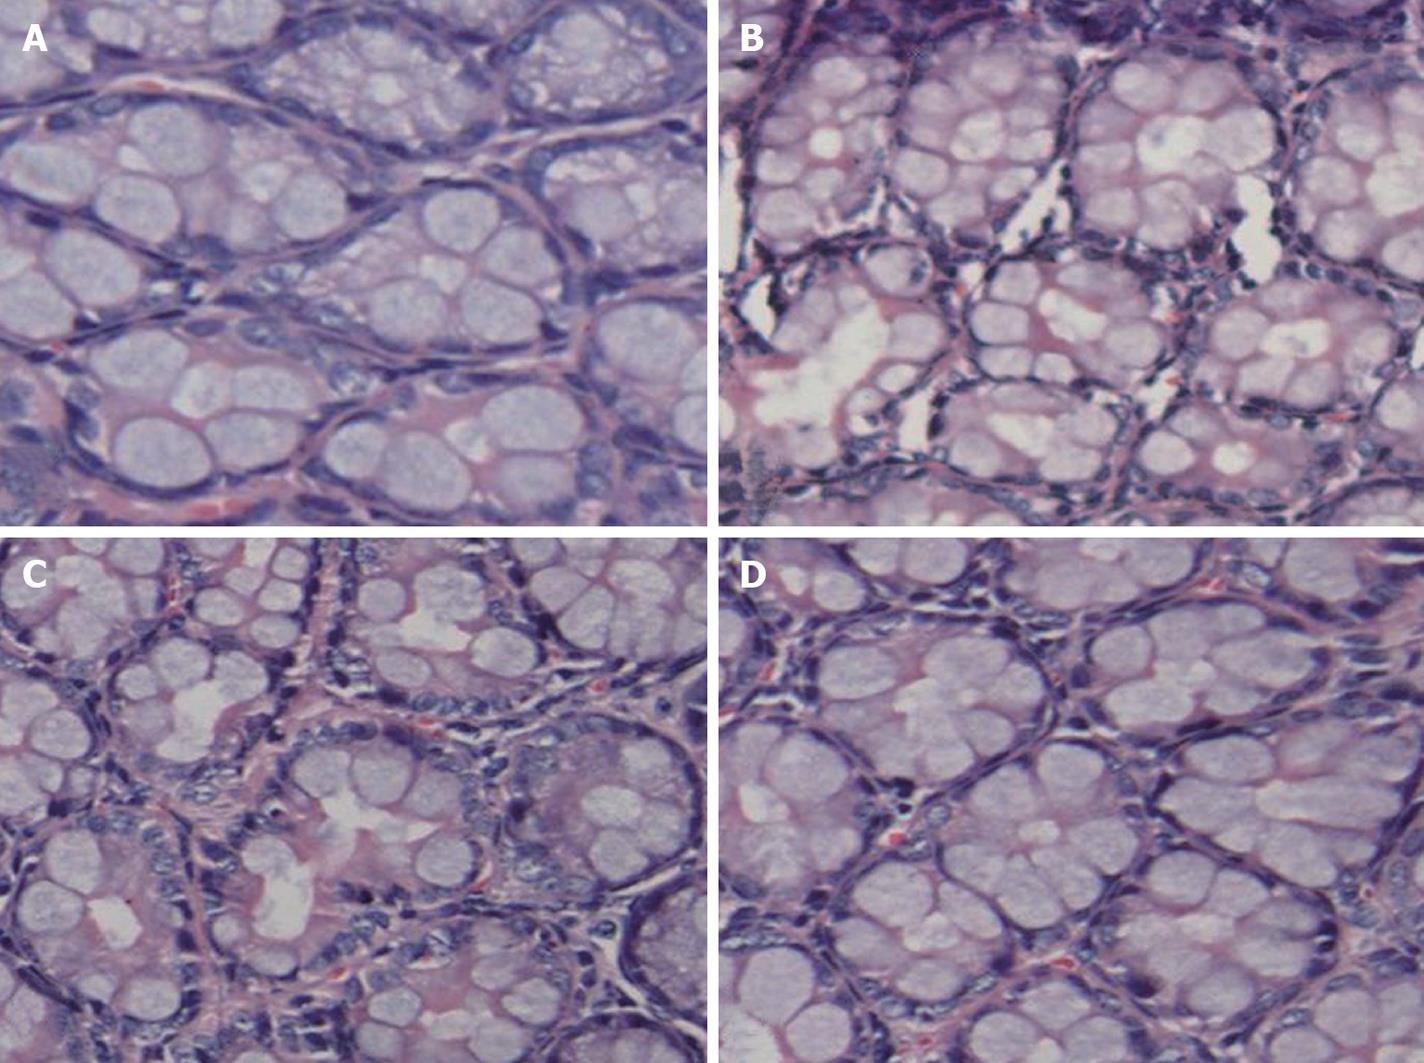
Figure 3 Morphology of intestinal samples stained with hematoxylin and eosin (200 ×).
A: Normal group; B: Acute liver necrosis group; C: Lipopolysaccharide group; D: Galactosamine group.
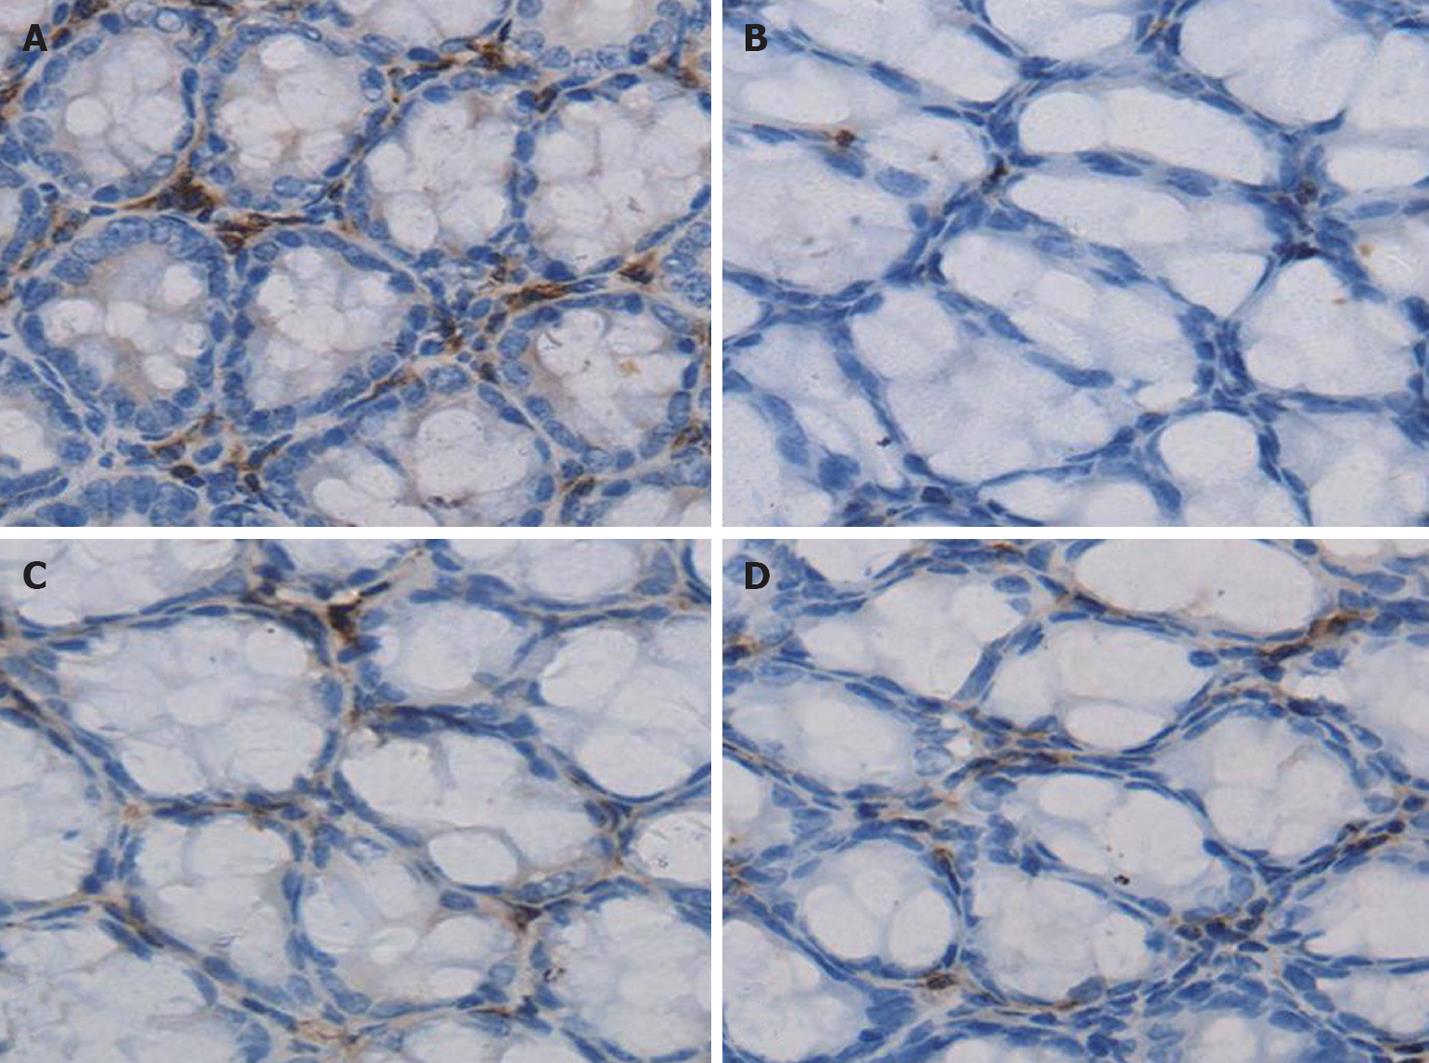
Figure 4 Immunoglobulin A+ cells determined by immunohistochemistry (400 ×).
Immunohistochemistry demonstrated that Immunoglobulin A in the plasma cells within the lamina propria were stained brown. A: Normal group; B: Acute liver necrosis group; C: Lipopolysaccharide group; D: Galactosamine group.
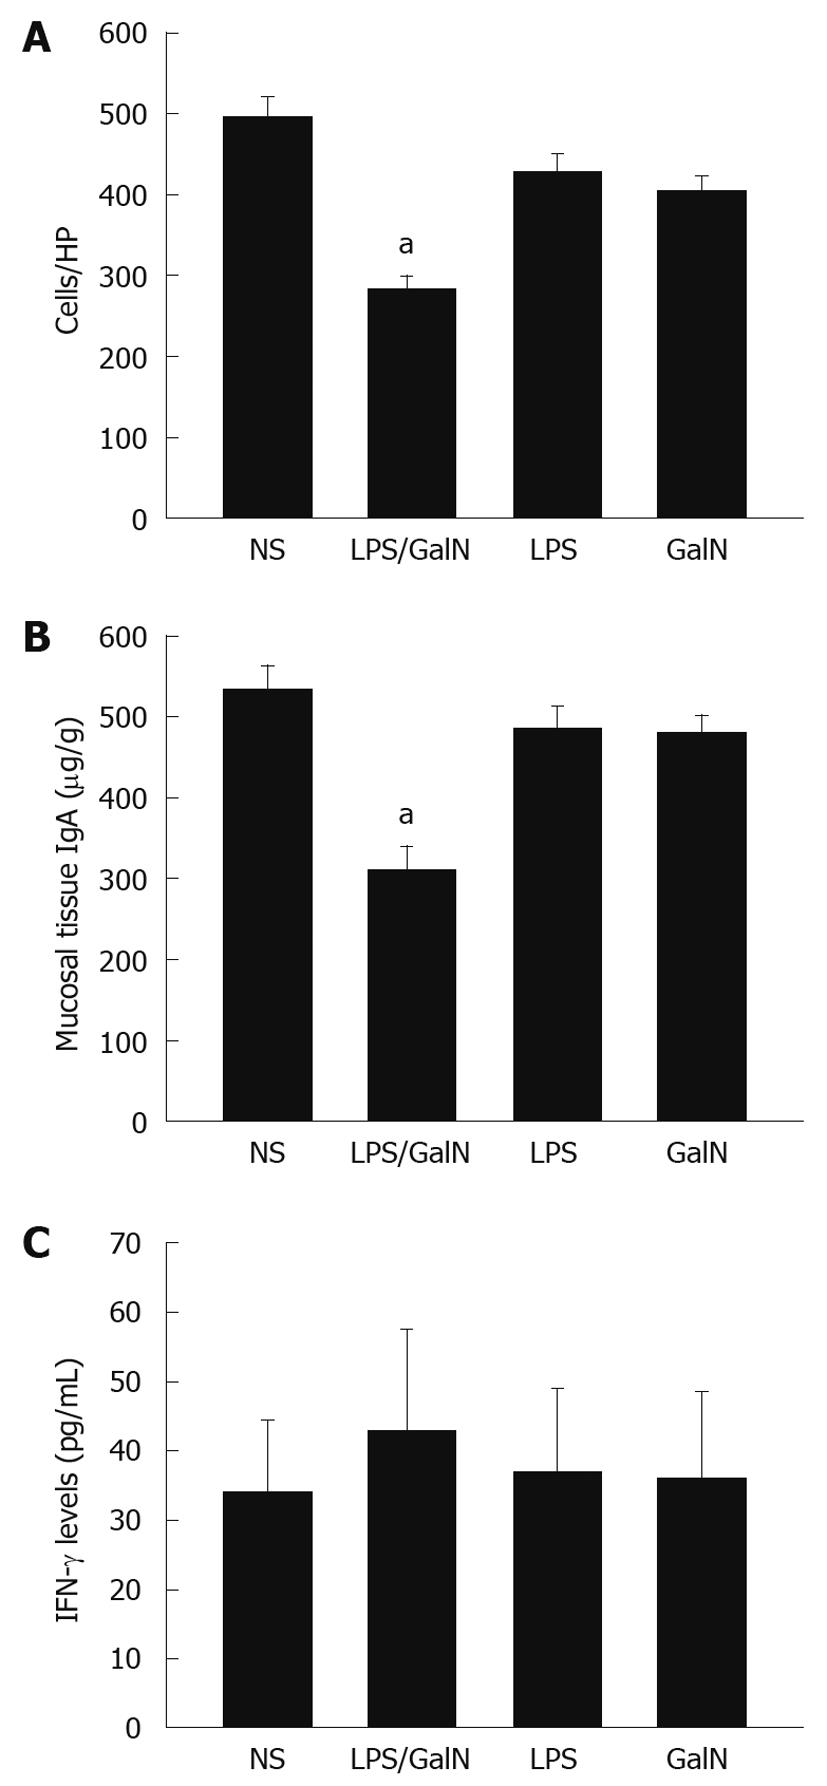
Figure 5 Immunoglobulin A+ plasma cells (A), the immunoglobulin A expression levels (B) and interferon-γ expression (C) in intestinal mucosal tissue.
aP < 0.05 vs normal saline (NS). HP: High power field; GalN: Galactosamine; LPS: Lipopolysaccharide.
- Citation: Fu JL, Wang ZH, Li GZ, Wang YR, Liu P. Decreased IgA+ plasma cells and IgA expression in acute liver necrosis mice. World J Gastroenterol 2010; 16(30): 3827-3833
- URL: https://www.wjgnet.com/1007-9327/full/v16/i30/3827.htm
- DOI: https://dx.doi.org/10.3748/wjg.v16.i30.3827


