Copyright
©2010 Baishideng.
World J Gastroenterol. Jan 21, 2010; 16(3): 384-391
Published online Jan 21, 2010. doi: 10.3748/wjg.v16.i3.384
Published online Jan 21, 2010. doi: 10.3748/wjg.v16.i3.384
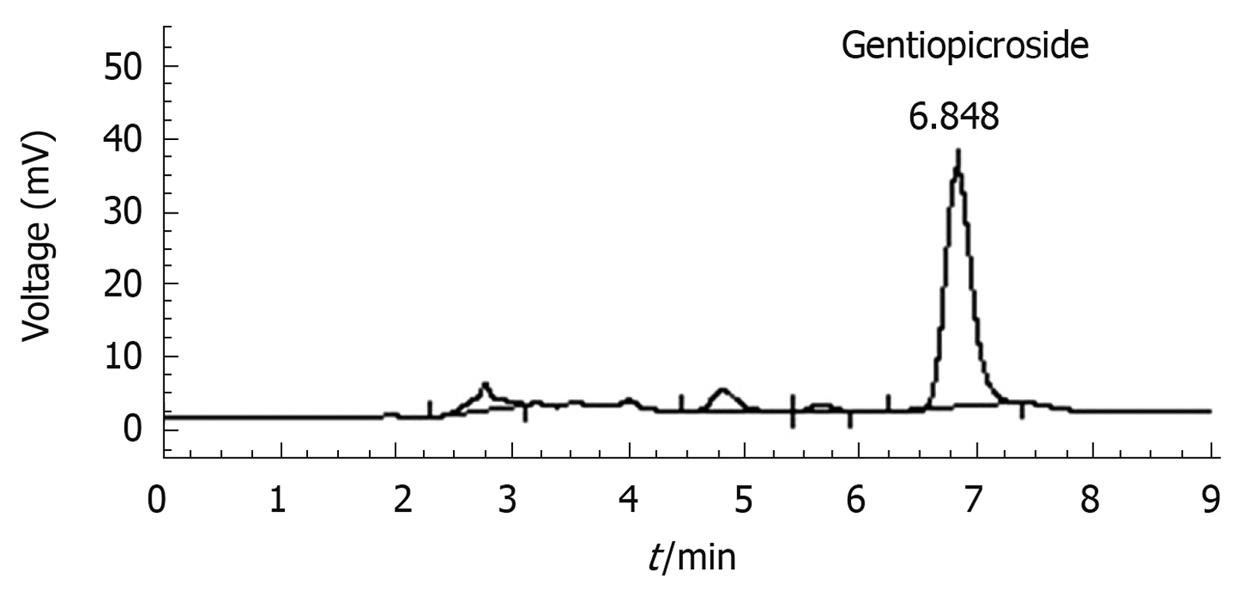
Figure 1 HPLC chromatograms of Gentiana manshurica Kitagawa (GM).
Column: Diamonsil C18 (250 mm × 4.6 mm); Flow rate: 1 mL/min; Mobile phase: Methanol and H2O (35:65).
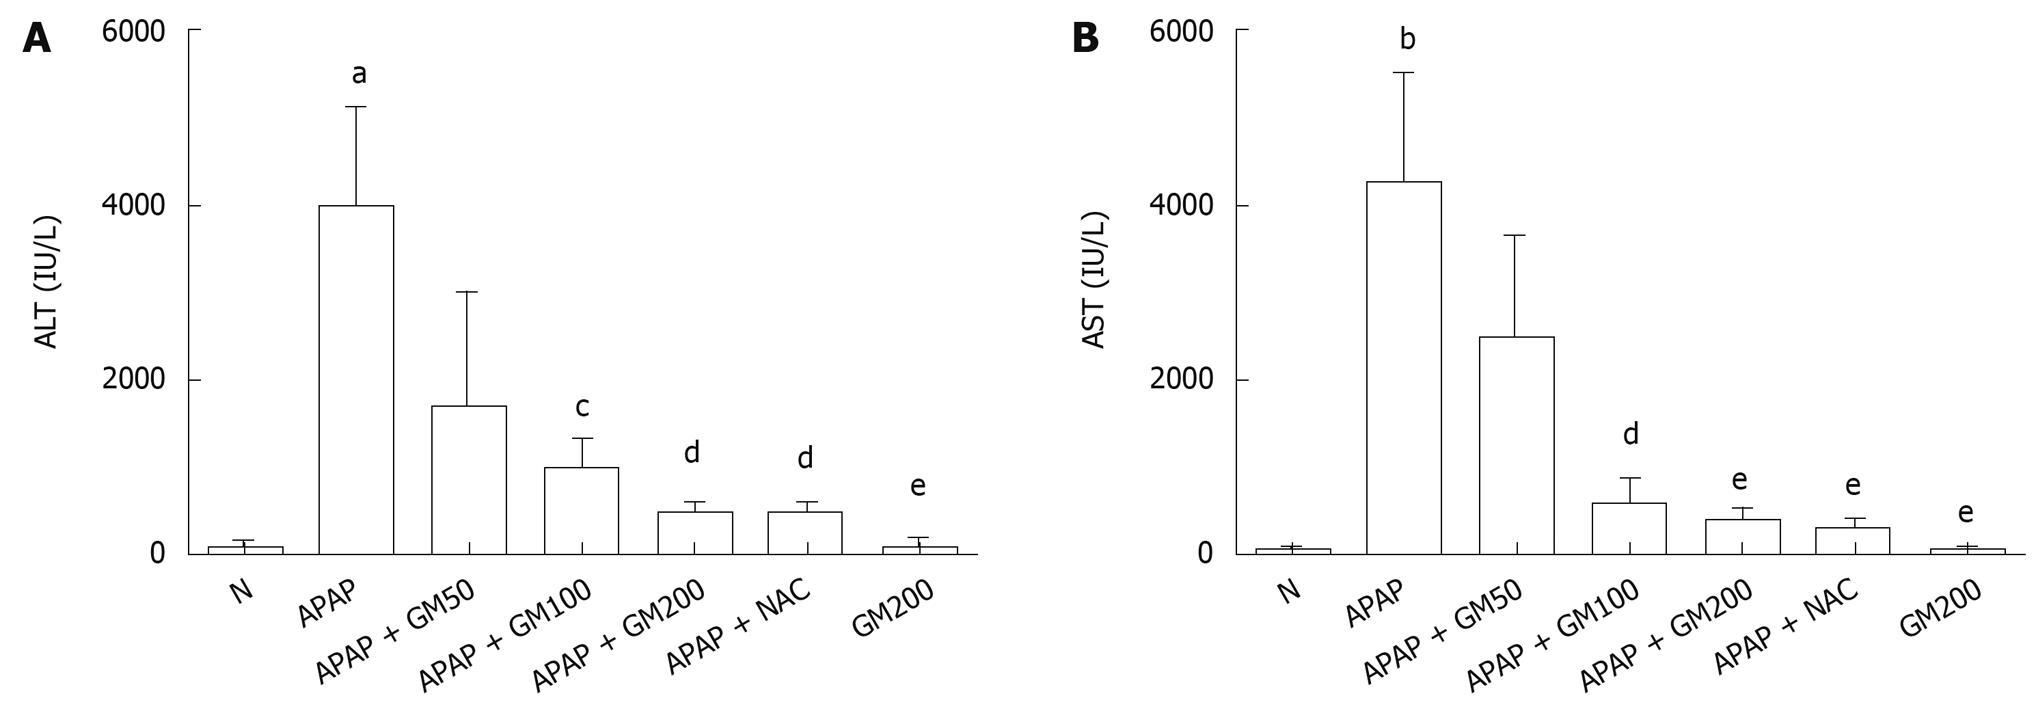
Figure 2 Protective effects of GM on serum biochemical parameters after acetaminophen (APAP) administration.
Mice were intraperitoneally injected with APAP (300 mg/kg body weight). GM (200, 100 or 50 mg/kg body weight) was orally administered at 2 h before APAP injection. All data are presented as mean ± SD, n = 10/group. aP < 0.05, bP < 0.01, significantly different when compared with normal controls. cP < 0.05, dP < 0.01, eP < 0.001 significantly different when compared with APAP alone group.
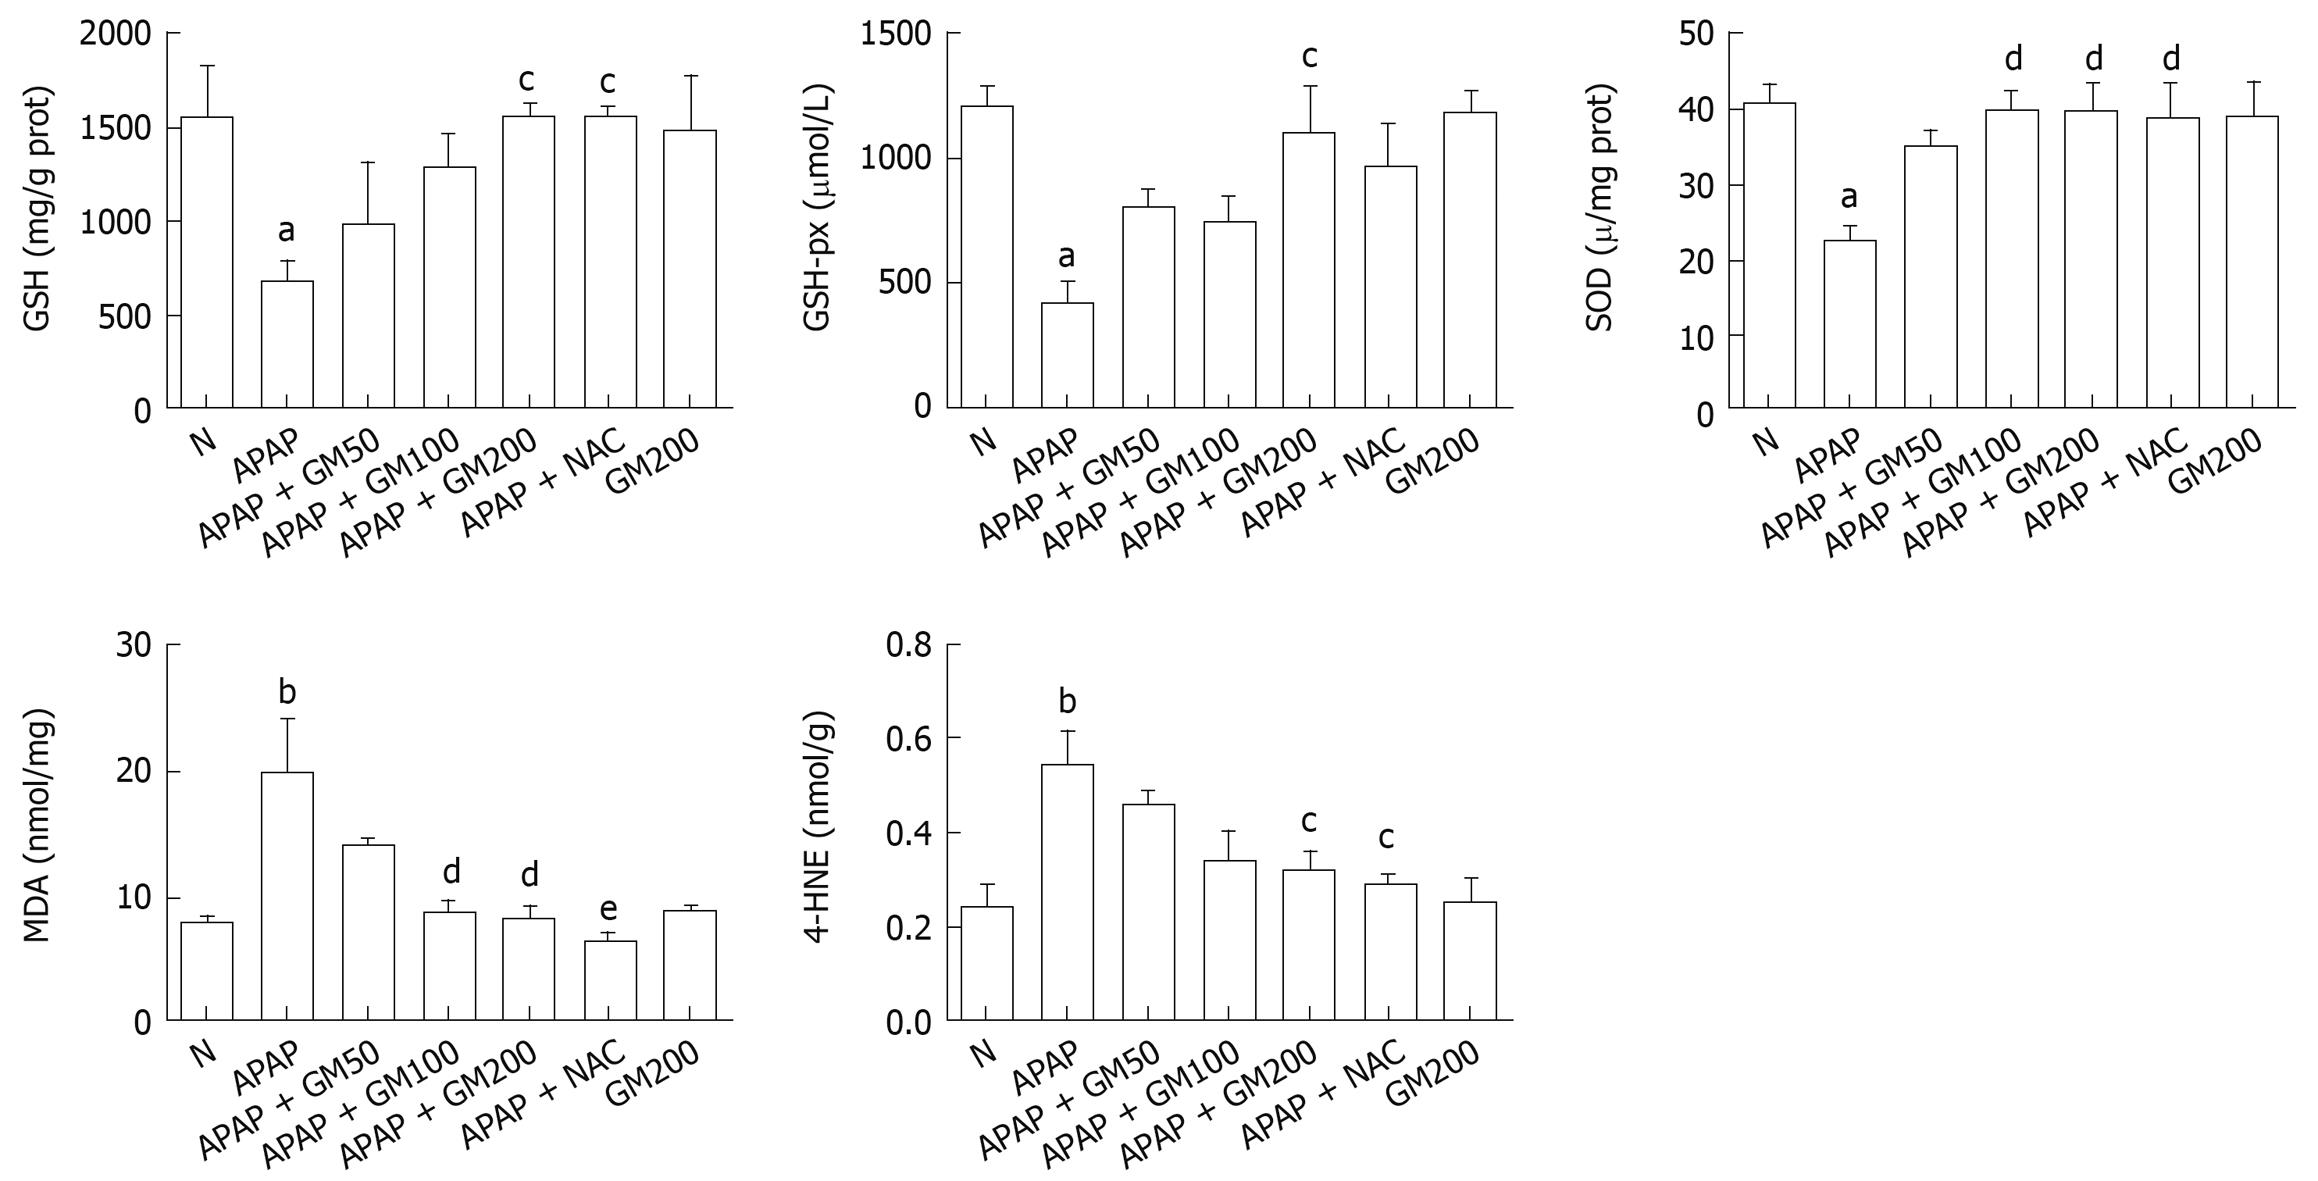
Figure 3 Protective effects of pretreatment with GM against APAP-induced glutathione (GSH) depletion, malonyldialdehyde (MDA) levels, 4-hydroxynonenal (4-HNE) levels and superoxide dismutase (SOD), glutathione peroxidase (GSH-px) activity in liver of mice.
APAP was given intraperitoneally with a single dose of 300 mg/kg. GM was given orally with a single dose of 200, 100 or 50 mg/kg. All data are presented as mean ± SD, n = 10/group. aP < 0.05, bP < 0.01, significantly different when compared with normal controls. cP < 0.05, dP < 0.01, eP < 0.001 significantly different when compared with APAP alone group.
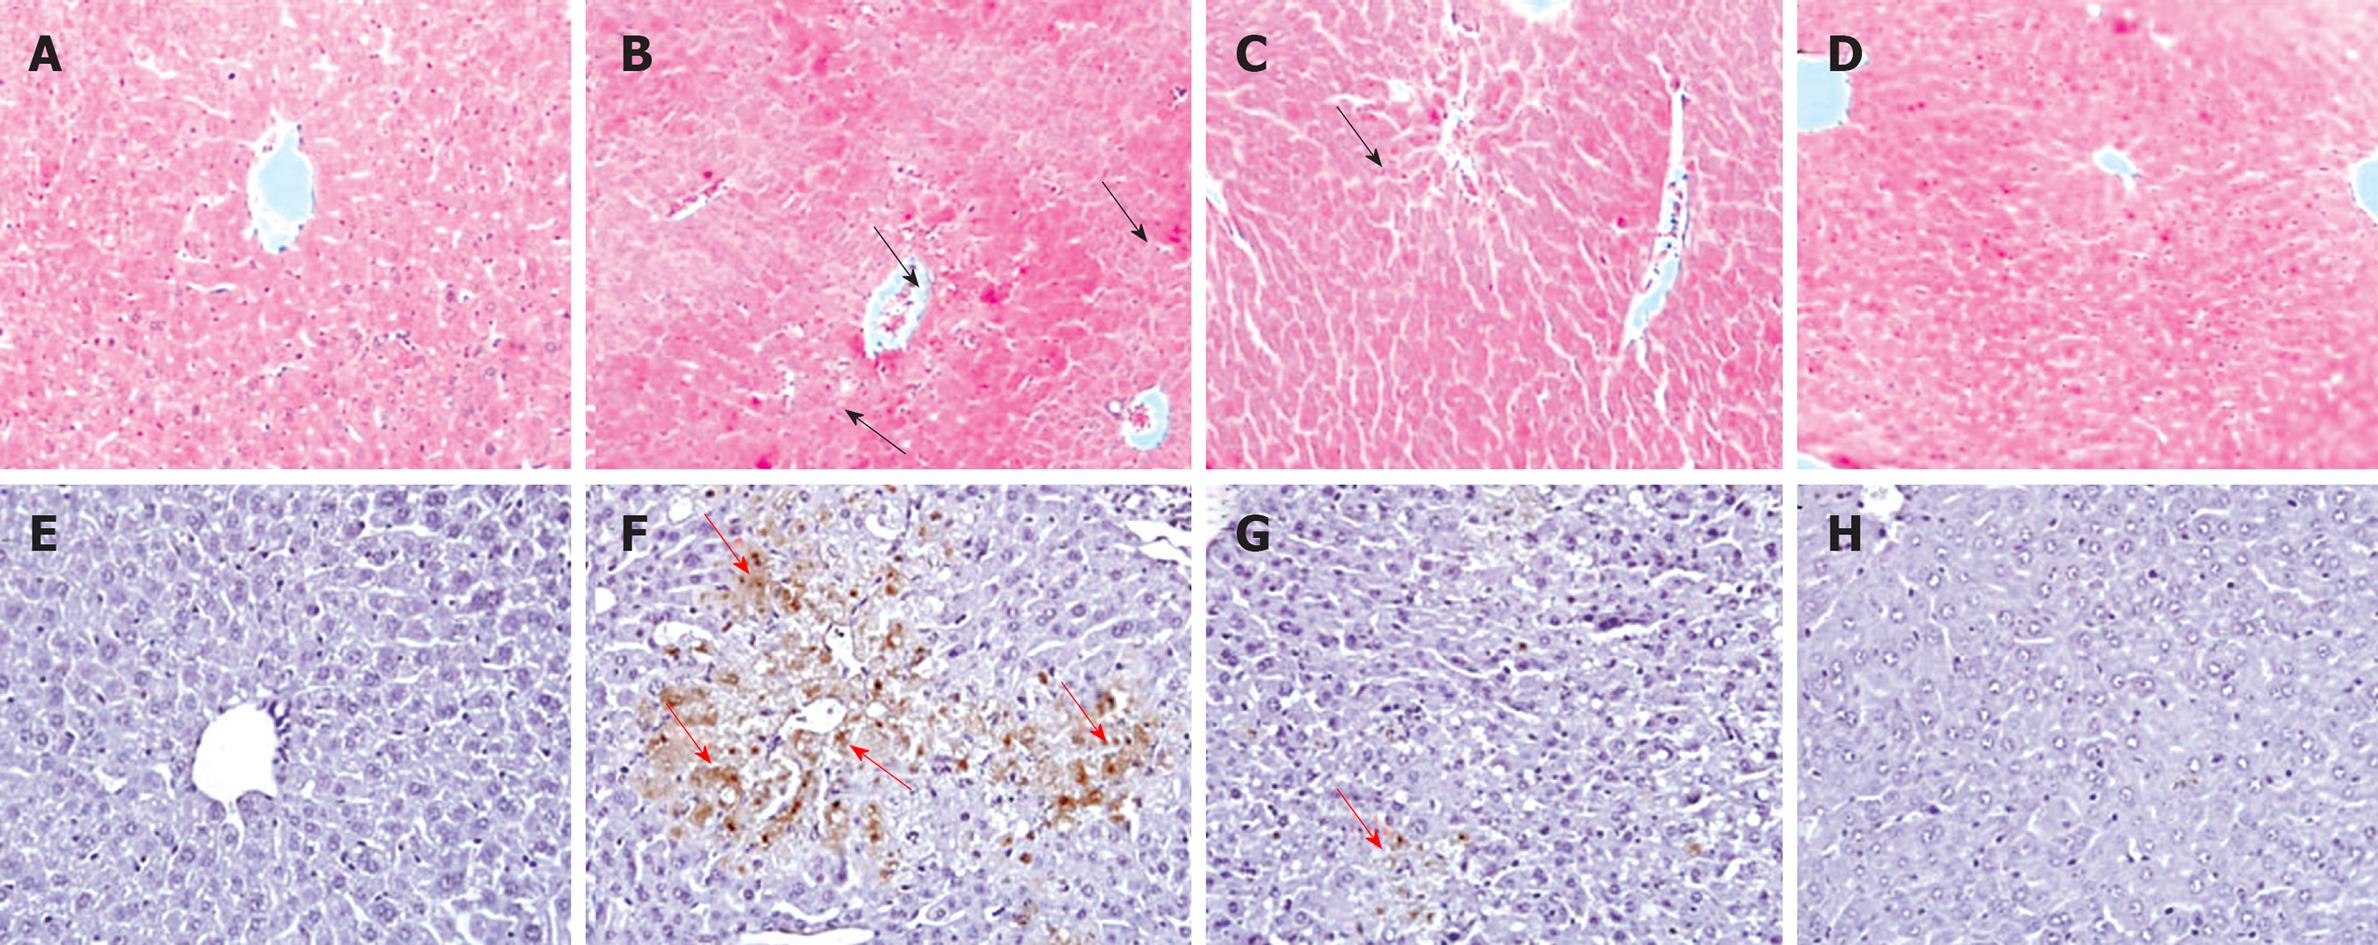
Figure 4 Liver histopathology and transferase-mediated dUTP nick end-labeling (TUNEL) assay.
APAP was given intraperitoneally with a single dose of 300 mg/kg. GM was given orally with a single dose of 200 mg/kg. A and E: Normal group; B and F: APAP group; C and G: APAP plus GM 200 mg/kg; D and H: Only GM 200 mg/kg. Upper panels stand for HE staining and the lower panels for TUNEL assay. The regions by black arrows in the upper figures indicate the hepatocyte necrosis or hepatocyte degeneration; the regions by red arrows in the lower figures indicate the TUNEL-positive apoptotic cells (× 100 magnification).
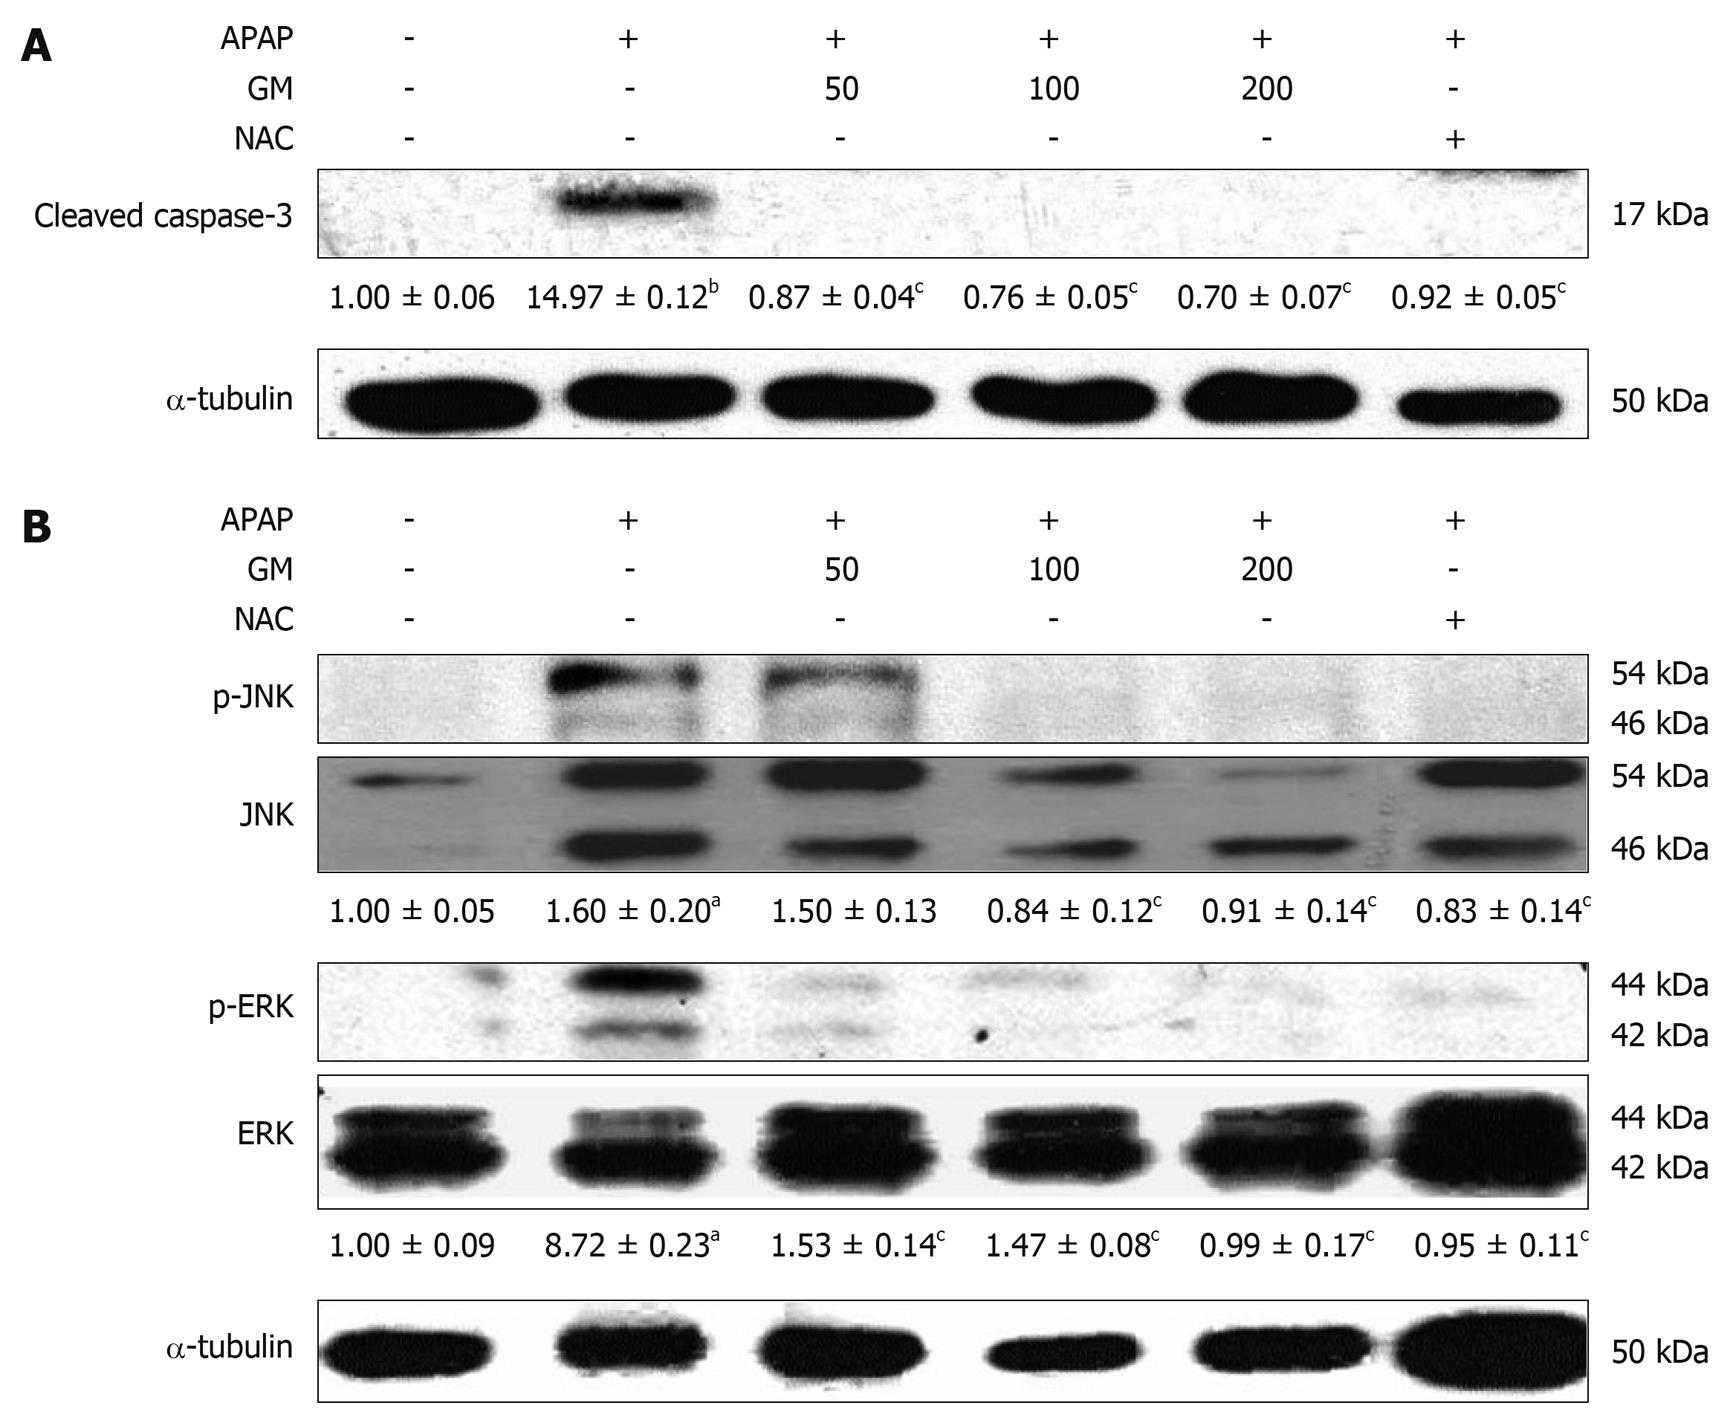
Figure 5 Western blotting analysis of caspase-3 and JNK/ERK MAPK.
GM (200, 100 or 50 mg/kg), NAC (300 mg/kg) or saline was orally administered 2 h before APAP injection. Active form of caspase-3, phospho-JNK and phospho-ERK were detected by Western blot. The active form of caspase-3 levels corresponding to each immunoreactive band were digitized and expressed as a percentage of the α-tubulin levels. Densitometric scanning data of phospho-JNK and phospho-ERK levels were expressed as the ratio of JNK or ERK, respectively. The ratio of the normal group band was set to 1.00. Data of three independent experiments are expressed as mean ± SD. aP < 0.01, bP < 0.001, significantly different when compared with the normal group. cP < 0.001 significantly different when compared with APAP alone group.
-
Citation: Wang AY, Lian LH, Jiang YZ, Wu YL, Nan JX.
Gentiana manshurica Kitagawa prevents acetaminophen-induced acute hepatic injury in micevia inhibiting JNK/ERK MAPK pathway. World J Gastroenterol 2010; 16(3): 384-391 - URL: https://www.wjgnet.com/1007-9327/full/v16/i3/384.htm
- DOI: https://dx.doi.org/10.3748/wjg.v16.i3.384


