Copyright
©2010 Baishideng.
World J Gastroenterol. May 7, 2010; 16(17): 2134-2145
Published online May 7, 2010. doi: 10.3748/wjg.v16.i17.2134
Published online May 7, 2010. doi: 10.3748/wjg.v16.i17.2134
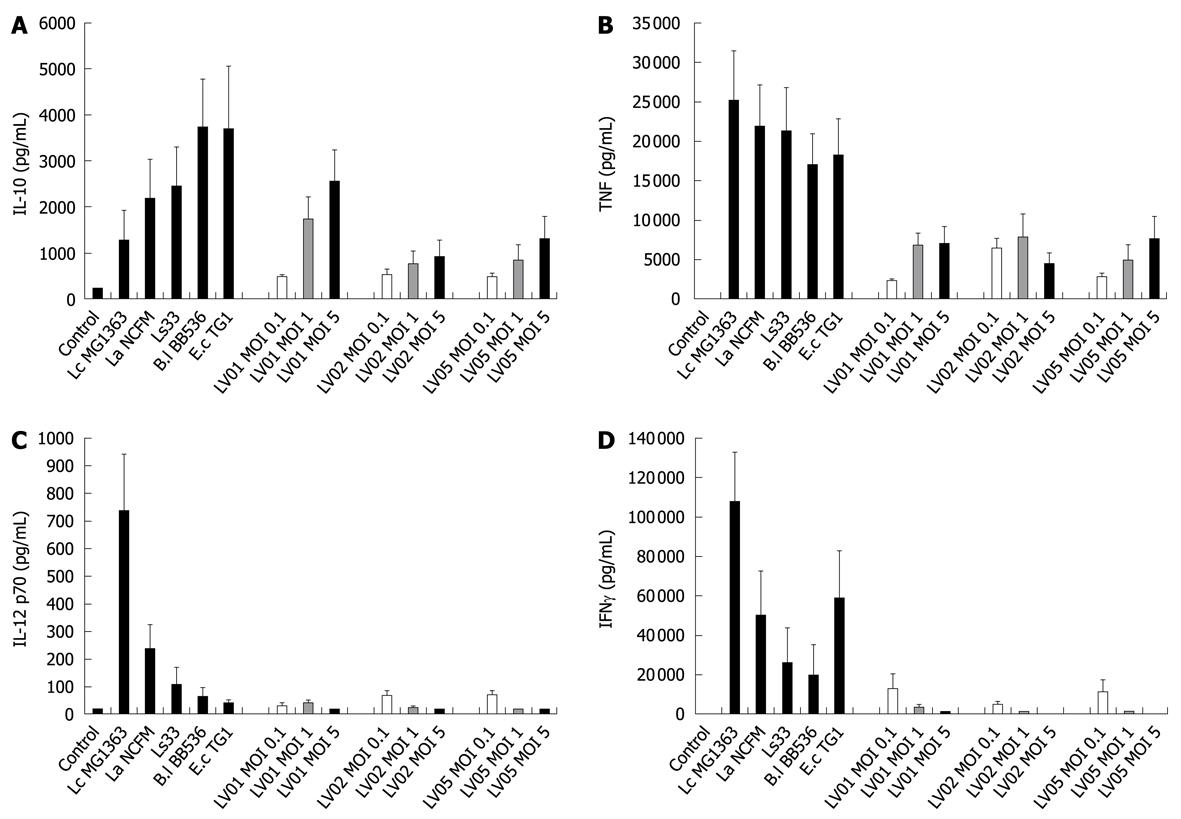
Figure 1 Dose-dependent cytokine production in human peripheral blood mononuclear cells (PBMCs), stimulated with bacterial reference strains and 3 yeast strains at distinct multiplicity levels of infection [multiplicity levels of infection (MOI) 0.
1, 1 and 5 yeasts/cells] for 24 h. Cytokine levels were analyzed in supernatants by enzyme-linked immunosorbent assay (ELISA). Panels A, B, C and D respectively show results for interleukin (IL)-10, tumor necrosis factor (TNF), IL-12 p70 and interferon γ (IFNγ), respectively. Results are expressed in pg/mL, mean ± SE, n = 3 distinct donors.
Figure 2 Standardized assessment of cytokine production in human PBMCs from distinct donors.
Immuno-competent cells are stimulated with 5 bacterial reference strains for 24 h and cytokine levels were analyzed in supernatants by ELISA. A: IL-10 release for 5 individual donors. Results are expressed in pg/mL; B: Standardized IL-10 release with values expressed as % of Escherichia coli (E. coli) value for each of the 5 donors.
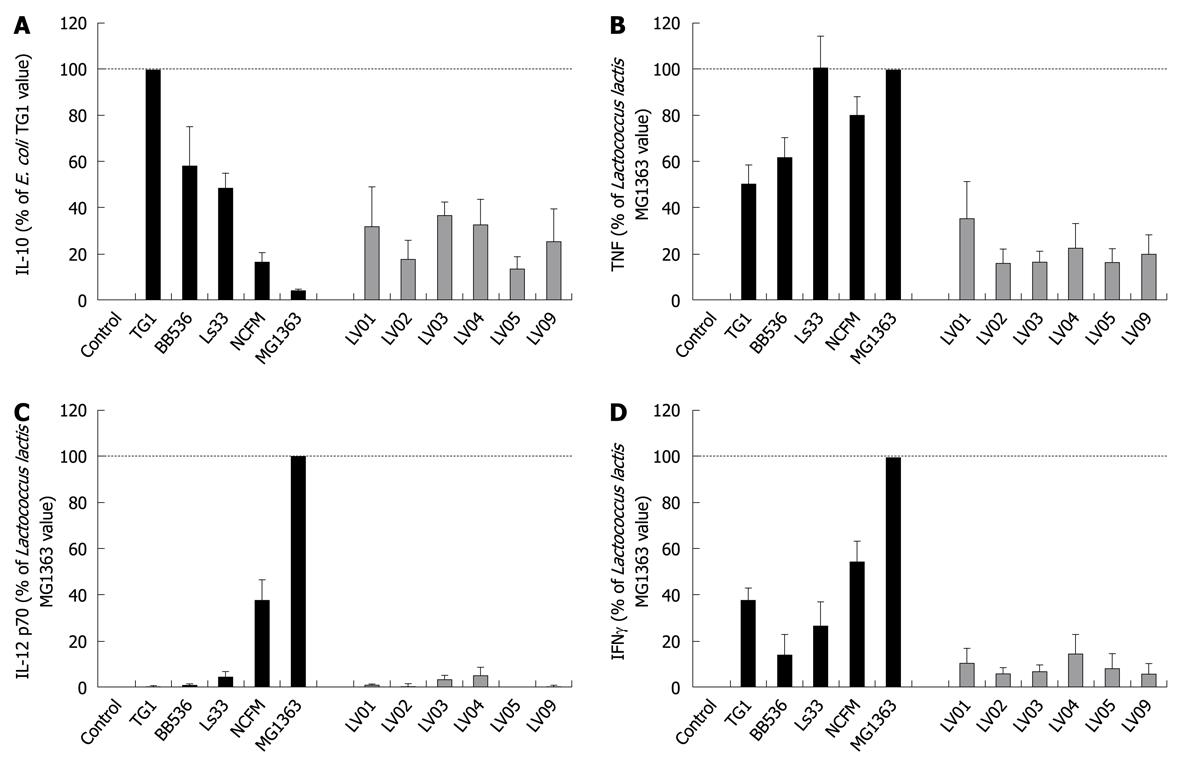
Figure 3 Cytokine production in human PBMCs, stimulated with bacterial reference strains and 6 yeast strains for 24 h.
Cytokine levels were analyzed in supernatants by ELISA. A: IL-10; B: TNF; C: IL-12 p70; D: IFNγ. Results are expressed in % of E. coli TG1 value for panel A and in % of Lactococcus lactis MG1363 for B, C and D, including mean ± SE; n = 5.
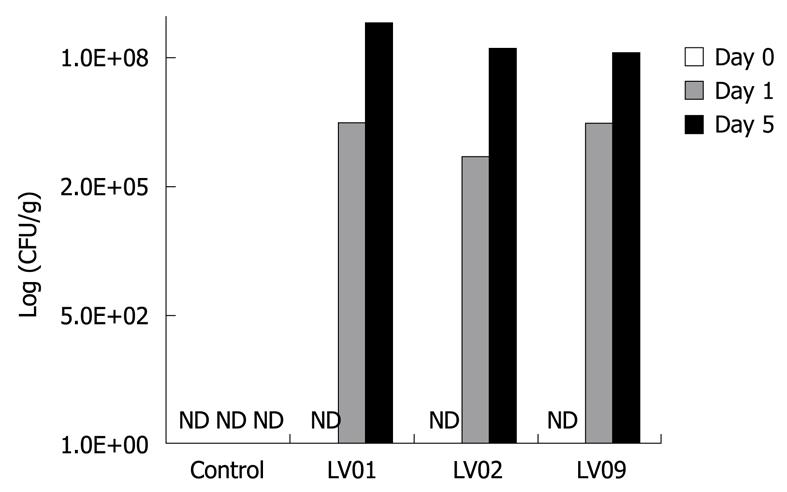
Figure 4 Fecal recovery of the 3 distinct yeast strains in yeast-fed mice, at days 0, 1 and 5.
Data were obtained by counting dilutions of stools on appropriate “yeast-selective”-tetracycline agar plates. Results are expressed in Log CFU/g of stools. Results are representative for 2 separate experiments, SD are not represented for clarity reasons. ND: Not detected; CFU: Colony-forming units.
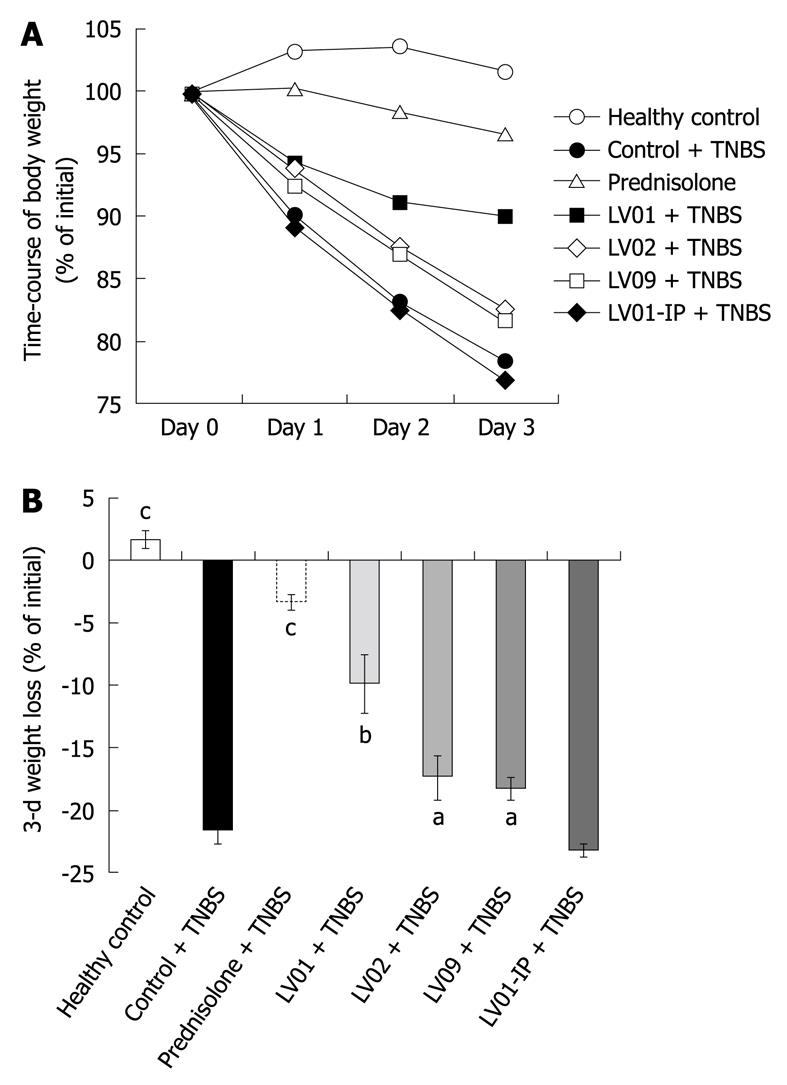
Figure 5 Changes in body weight during the preventive interventional study on experimental colitis.
A: Time-course changes of weight for control mice and 2-4-6-trinitrobenzene sulfonic acid (TNBS)-treated mice, covering saline vehicle, prednisone and yeast pre-treated animals. Results are expressed as % of initial weight; SDs are not represented for clarity; B: Final weight loss 3 d after colitis. Results are expressed as mean ± SE (n = 10 per group), aP < 0.05, bP < 0.01, cP < 0.001 vs TNBS-saline.
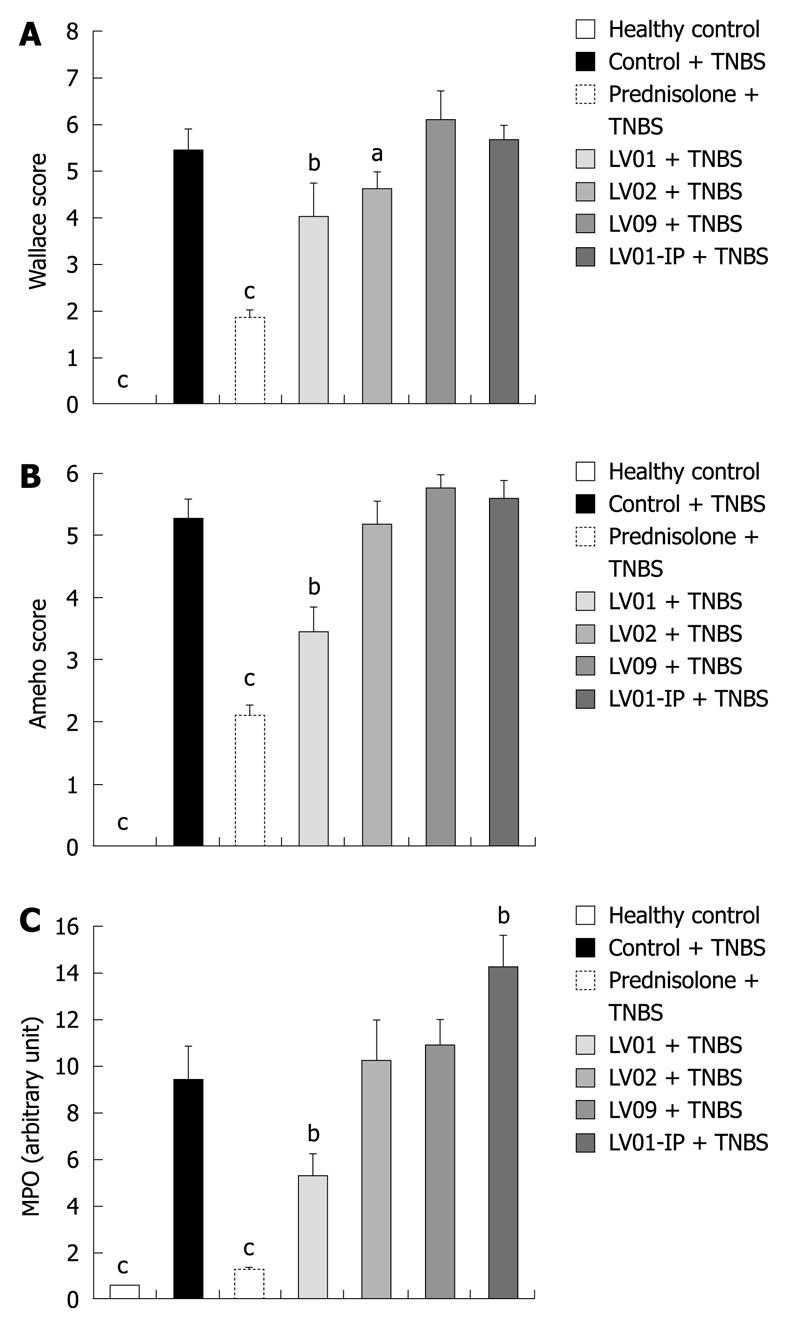
Figure 6 Effects of the various treatments 3 d after the TNBS-induced colitis on colonic macroscopic damage (Wallace) (A), histology scores (Ameho) (B) and myeloperoxidase (MPO) activity (C).
Mice received intra-rectally either saline or TNBS following oral pre-treatment by prednisone (10 mg/kg, 2 d), by various yeast strains for 5 d or after intra-peritoneal administration (IP) of the yeast at the onset of colitis. Results are expressed as mean ± SE (n = 10 per group), aP < 0.05, bP < 0.01, cP < 0.001 vs TNBS-saline.
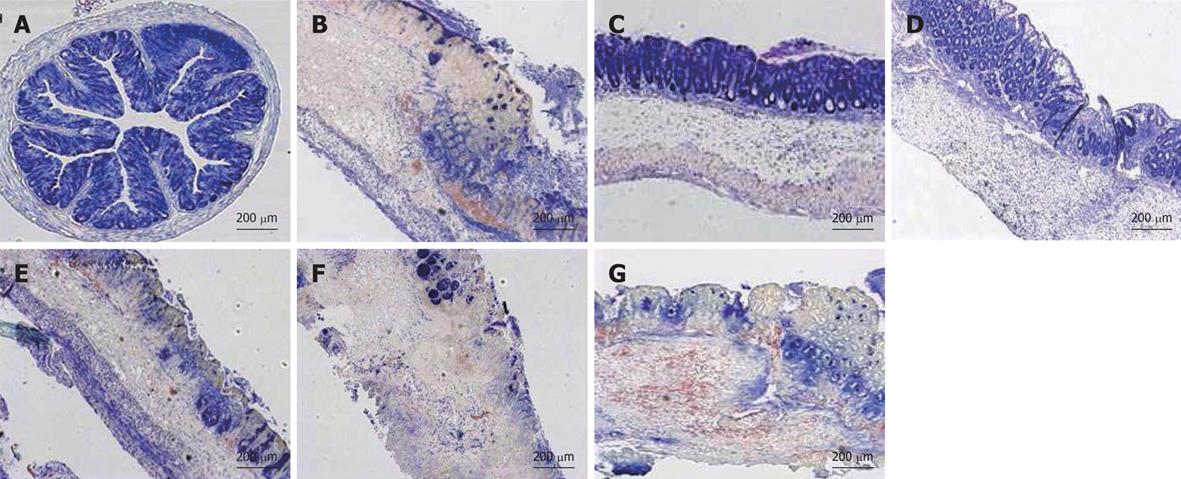
Figure 7 Histological features of yeast-mediated protection.
The figure shows representative May-Grünwald and Giemsa-strained colon sections of control healthy mice (A) or day 3 after instillation of TNBS in Balb/c mice pre-treated with either vehicle (B), prednisone (C), LV01 (D), LV02 (E), LV09 (F) and LV01-IP (G). Original magnification, × 20.
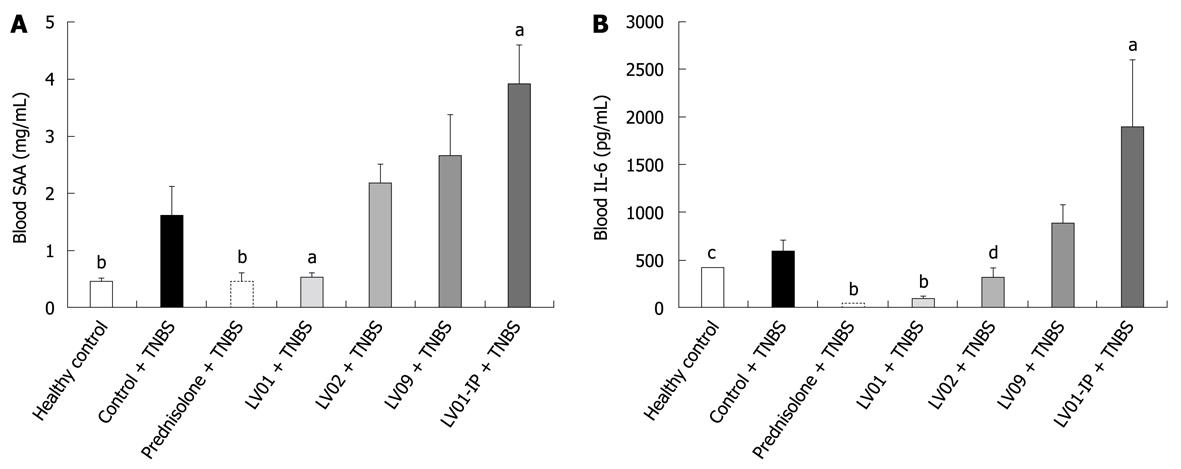
Figure 8 Effects of the various treatments 3 d after the TNBS-induced colitis on blood markers.
A: Serum amyloid A protein (SAA); B: IL-6. Mice received intra-rectally either saline or TNBS following oral pre-treatment by prednisone (10 mg/kg, 2 d), by various yeast strains for 5 d or after intra-peritoneal administration (IP) of the yeast at the onset of colitis. Results are expressed as mean ± SE (n = 10 per group), aP < 0.05, bP < 0.01, cP < 0.001, 0.05 < dP < 0.1 vs TNBS-saline.
- Citation: Foligné B, Dewulf J, Vandekerckove P, Pignède G, Pot B. Probiotic yeasts: Anti-inflammatory potential of various non-pathogenic strains in experimental colitis in mice. World J Gastroenterol 2010; 16(17): 2134-2145
- URL: https://www.wjgnet.com/1007-9327/full/v16/i17/2134.htm
- DOI: https://dx.doi.org/10.3748/wjg.v16.i17.2134


