Copyright
©2010 Baishideng.
World J Gastroenterol. Apr 14, 2010; 16(14): 1720-1726
Published online Apr 14, 2010. doi: 10.3748/wjg.v16.i14.1720
Published online Apr 14, 2010. doi: 10.3748/wjg.v16.i14.1720
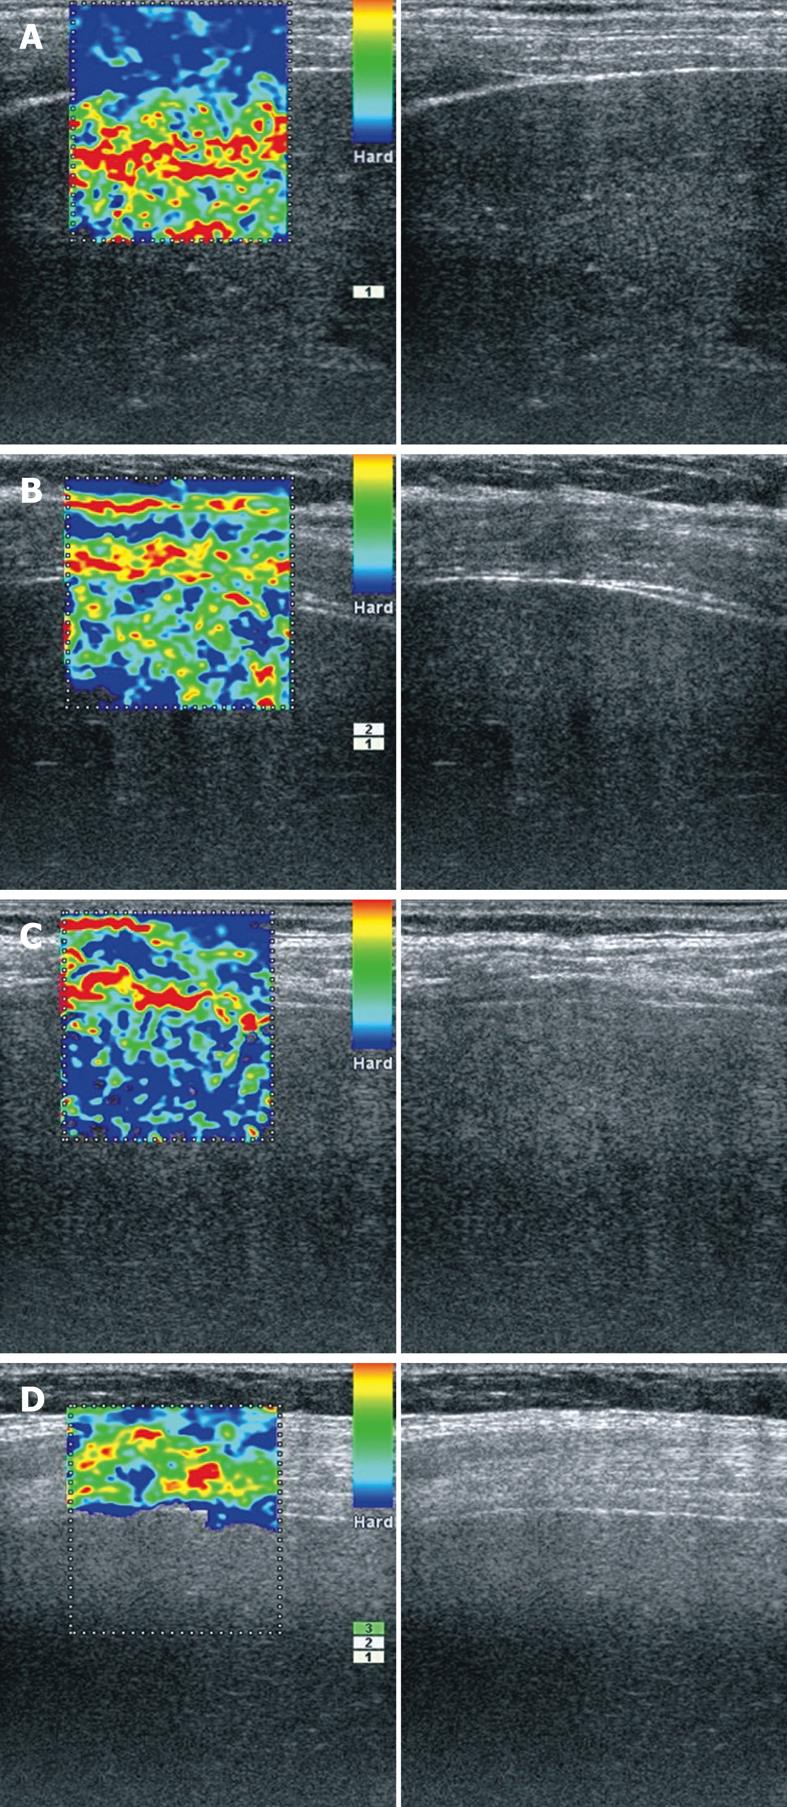
Figure 1 Real-time elastography images of right liver lobe.
A: 58-year-old patient with alcoholic liver steatosis - a very soft liver parenchyma (red/yellow/green) in contrast with hard intercostals muscles and diaphragm (blue); B: 56-year-old patient with chronic hepatitis C - parenchyma with mixed appearance (green/blue) indicative of elasticity; C: 57-year-old patient with alcoholic cirrhosis - very hard liver parenchyma (predominantly blue); D: 67-year-old obese woman with chronic hepatitis. The elastography software was not able to characterize elasticity inside liver.
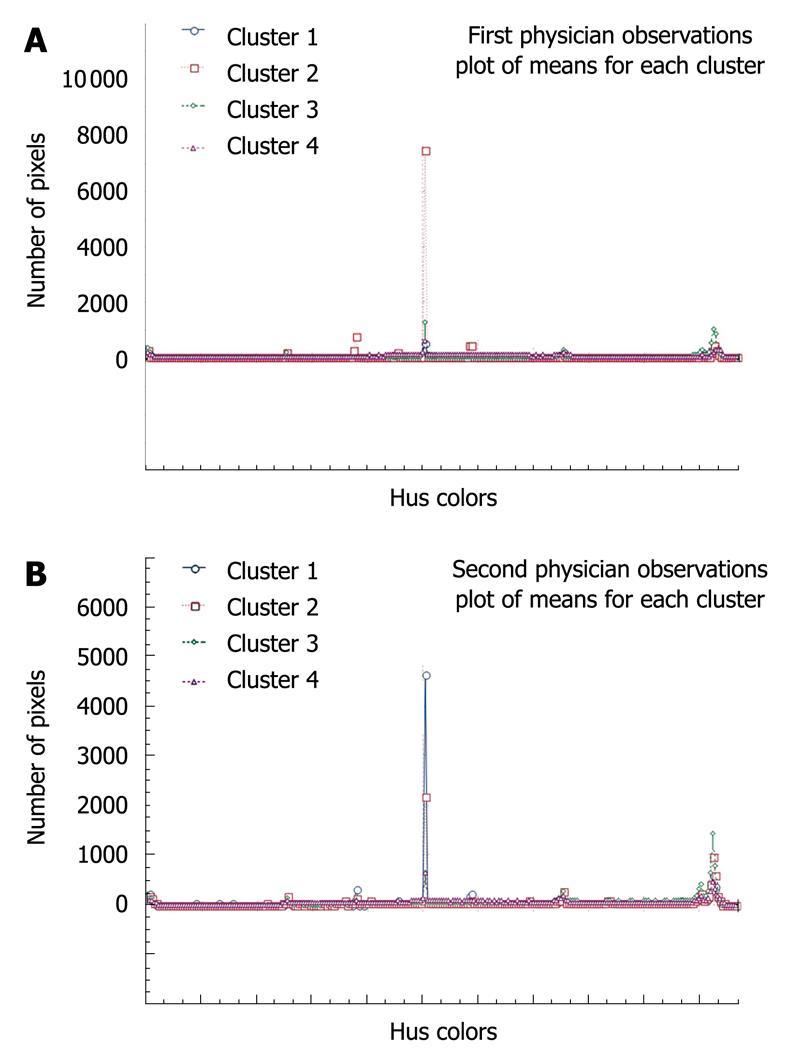
Figure 2 Graphs showing the way the first (A) and the second investigator (B) clustered the patients.
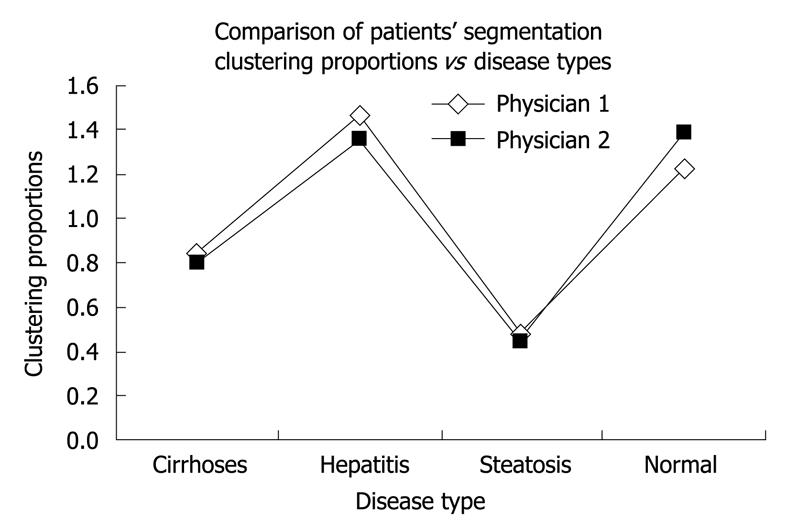
Figure 3 Patient segmentation across the four types of status, showing a similar manner of clustering the patients, irrespective of examiner.
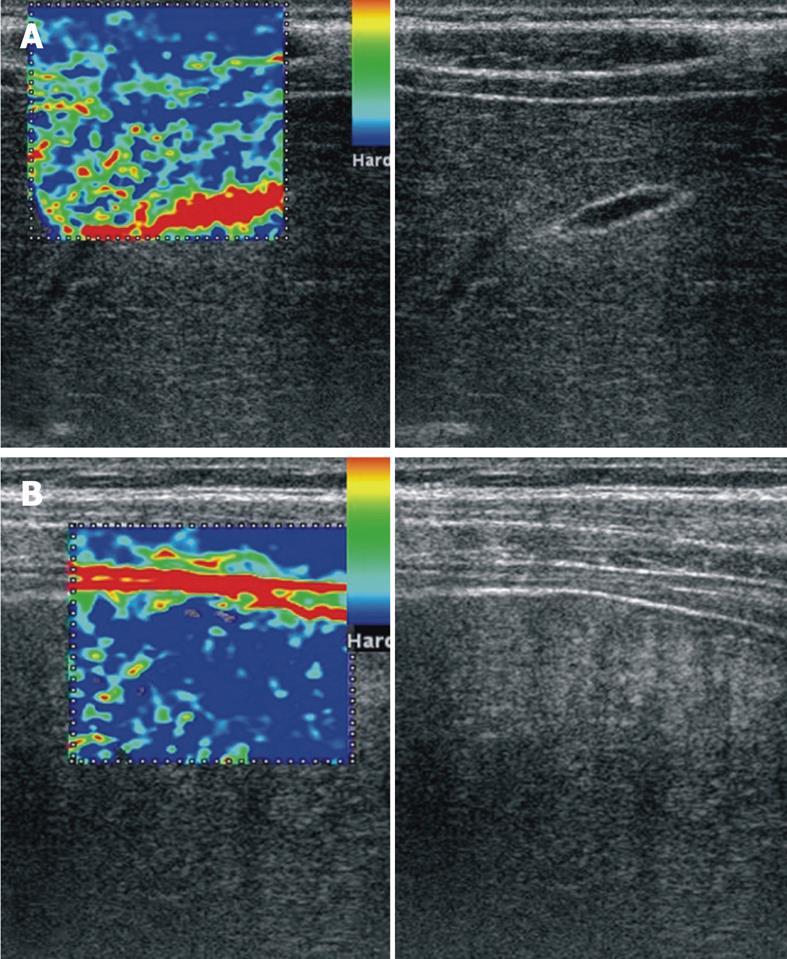
Figure 4 Real-time elastography images of right liver lobe.
A: 45-year-old patient with alcoholic liver steatosis. Region of interest include a large vessel, therefore, the liver parenchyma had a hard appearance (blue/green) in contrast with the extremely compressed (red) vessel; B: 52-year-old patient with liver cirrhosis and small amount of ascites surrounding the liver. There was very compressive and elastic fluid (red), and the liver parenchyma was depicted as very hard (blue). Consequently, other types of ascites might possibly induce similar artifacts, even in the presence of normal liver tissue.
- Citation: Gheonea DI, Săftoiu A, Ciurea T, Gorunescu F, Iordache S, Popescu GL, Belciug S, Gorunescu M, Săndulescu L. Real-time sono-elastography in the diagnosis of diffuse liver diseases. World J Gastroenterol 2010; 16(14): 1720-1726
- URL: https://www.wjgnet.com/1007-9327/full/v16/i14/1720.htm
- DOI: https://dx.doi.org/10.3748/wjg.v16.i14.1720


