Copyright
©2010 Baishideng.
World J Gastroenterol. Apr 7, 2010; 16(13): 1598-1609
Published online Apr 7, 2010. doi: 10.3748/wjg.v16.i13.1598
Published online Apr 7, 2010. doi: 10.3748/wjg.v16.i13.1598
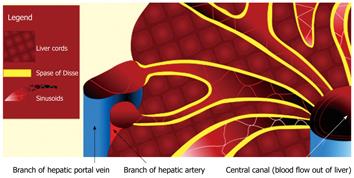
Figure 1 Schematic diagram illustrating the vascular architecture of the liver.
Note the dual blood supply into the liver derived from the portal vein and hepatic artery. The vascular inflow is channeled into the hepatic sinusoids, which normally communicate freely with the Space of Disse (yellow). The Space of Disse is an interstitial space that lies between the sinusoids and the liver cords. From the hepatic sinusoids, blood is drained out of the liver via branches of the hepatic vein.
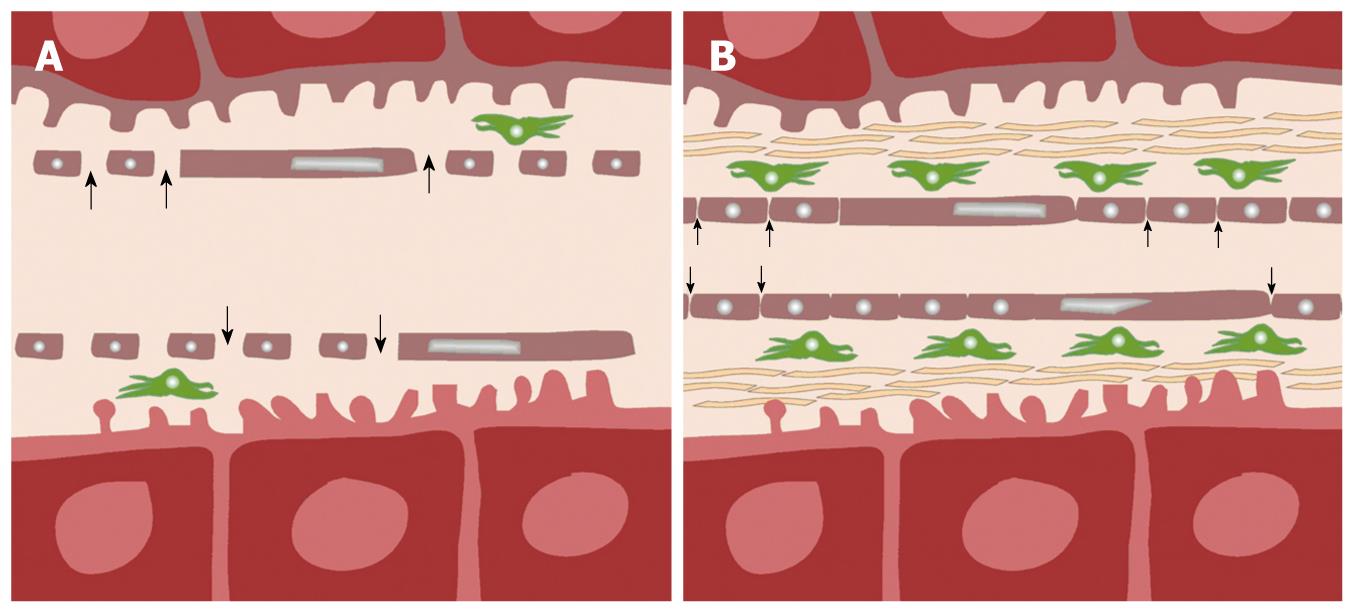
Figure 2 Schematic diagram showing pathophysiological differences between normal (A) and cirrhotic (B) liver.
In normal liver (A), normal fenestrae along the hepatic sinusoids allow free passage of blood (arrows) into the Space of Disse, in which, stellate cells (green) are found. In liver cirrhosis (B), there is an increase in the number of stellate cells, associated with deposition of collagenous fibers in the Space of Disse, and loss of fenestrae as the sinusoids become more capillary-like. As a result, transfer of low-molecular-weight compounds (e.g. contrast medium) from the sinusoids into the Space of Disse becomes more impeded (small arrows).
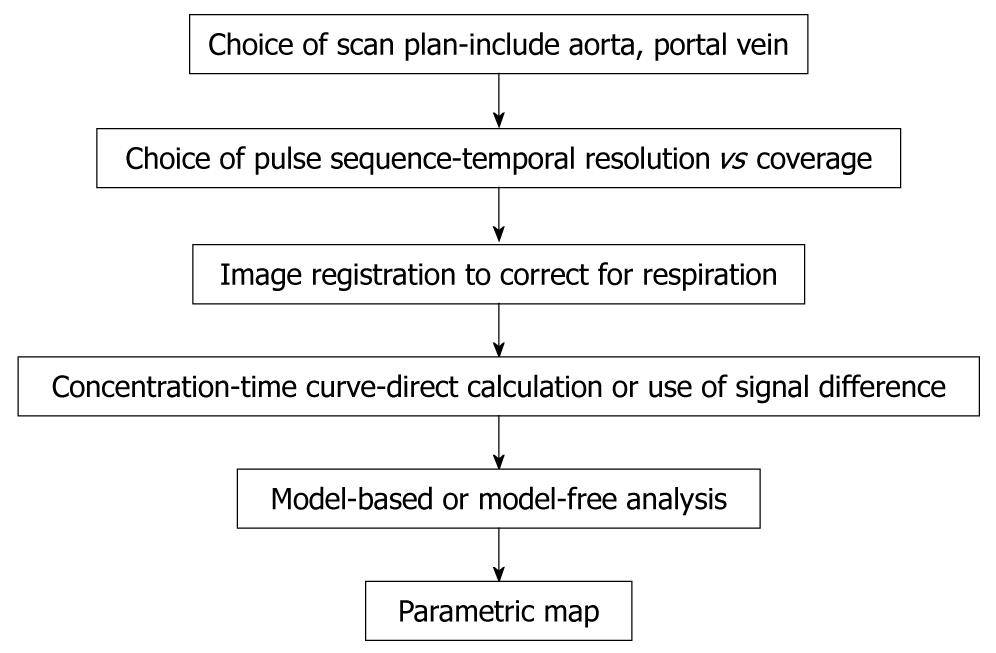
Figure 3 Chart shows workflow involved from data acquisition to obtaining vascular information by perfusion MRI of the liver.
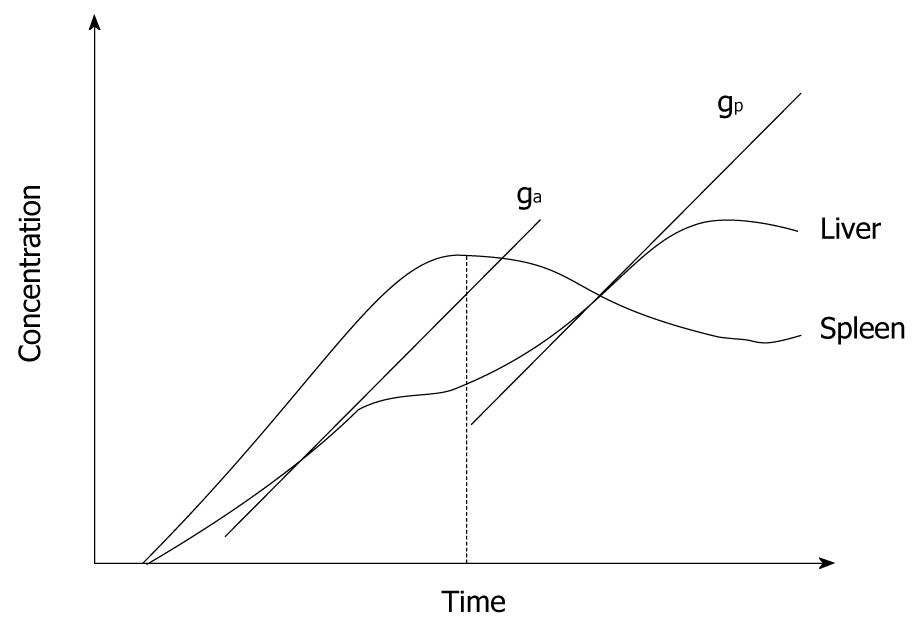
Figure 4 Schematic plot of gadolinium concentration-time curve in liver tissue obtained from a perfusion MRI study.
The diagram illustrates how the maximum gradient for arterial perfusion (ga) and portal perfusion (gp) are derived (based on Miles et al[2]). Note that the peak splenic enhancement is used to define the transition between arterial and portal phase of liver parenchyma enhancement. The maximum slope after the peak splenic enhancement is used to define portal perfusion.
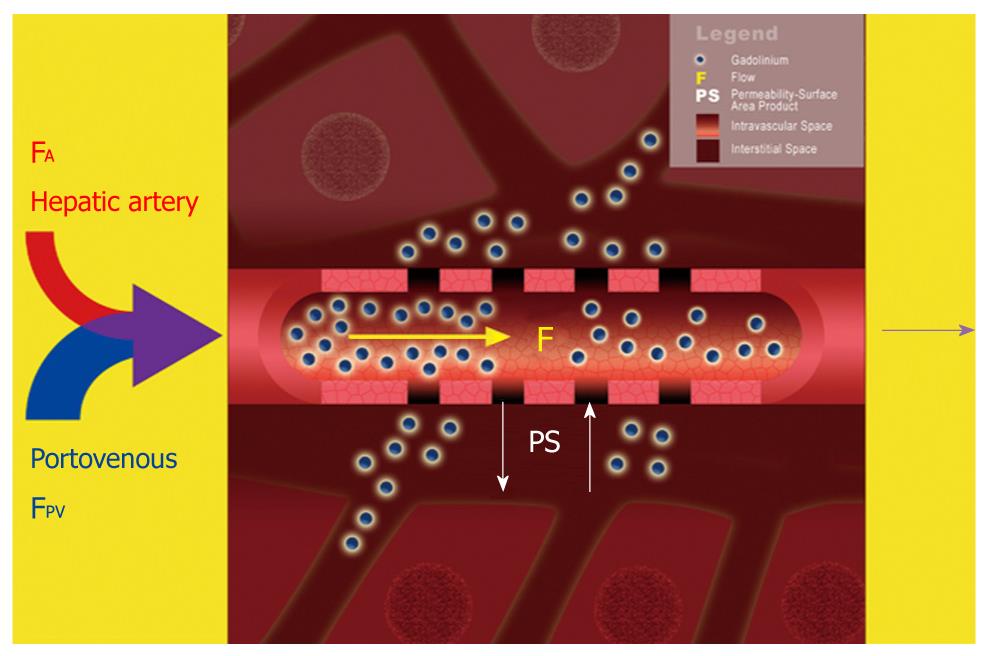
Figure 5 Schematic diagram illustrating a dual-input dual-compartment tracer kinetic model.
Dual blood supply carrying gadolinium contrast molecules (blue spheres) from the hepatic artery (FA) and portal vein (FPV) enters the hepatic sinusoids (intravascular space). From here, the contrast molecules can leak outwards into the Space of Disse (interstitial space). Using a dual-input, dual compartment tracer kinetic model allows the estimation of intravascular properties (e.g. blood flow, F), as well as characteristics of the interstitial space (e.g. PS).
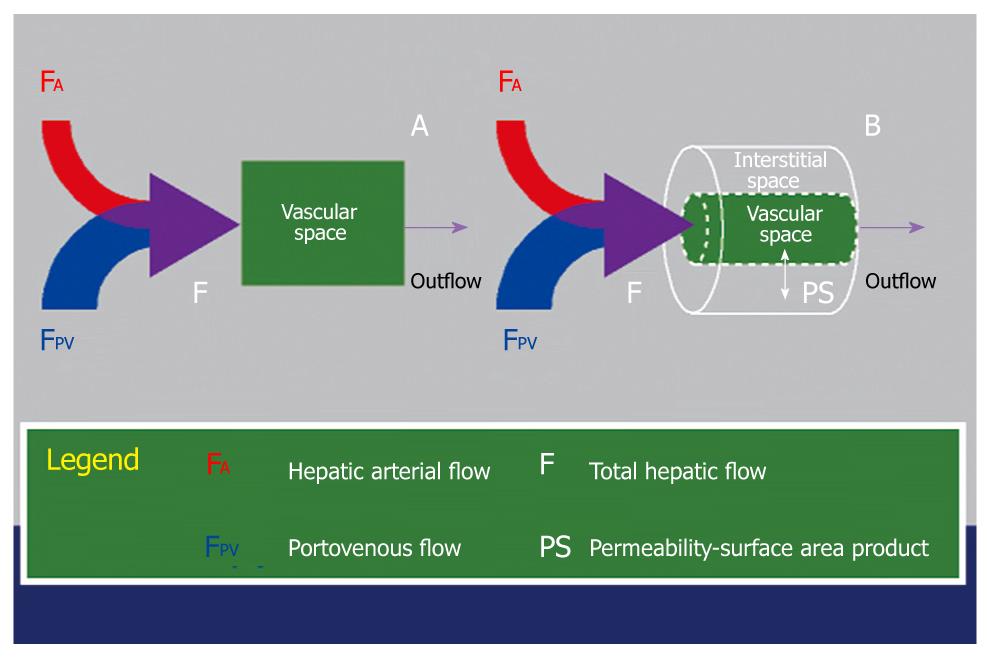
Figure 6 Schematic diagram illustrating the key difference between a single-compartment model (A) and a dual-compartment tracer kinetic model (B).
Using a single-compartment model, only the vascular compartment is considered and kinetic properties related to this (e.g. blood flow, F) can be estimated. The behavior of the normal liver can be approximated by a single-compartment model. Using a dual-compartment model, kinetic properties that describe the interstitial space (e.g. PS) can be quantified in addition. In disease states (e.g. liver cirrhosis and tumors), the vascular behavior of these tissues are better described using a dual-compartment model.
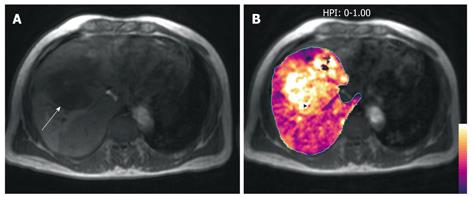
Figure 7 A middle-aged man with colorectal liver metastases to the liver.
A: T1-weighted axial MR image demonstrates a hypointense liver metastasis in the right liver lobe (arrow); B: HPI map (calculated by the method described by Miles et al[2]) overlaid on the T1-weighted image shows increased HPI within the metastasis, typical of malignant disease.
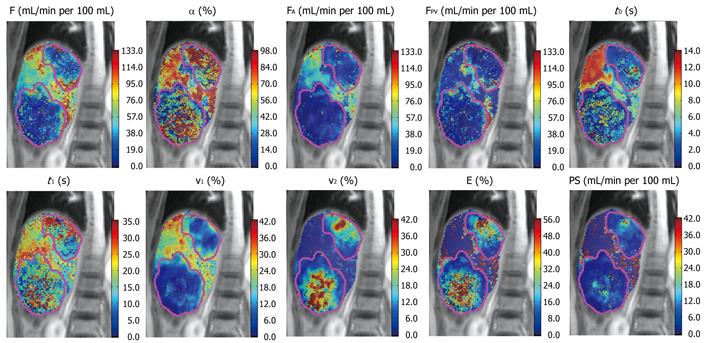
Figure 8 Parameteric maps of a patient with colorectal metastases derived from a dual-input, dual-compartment, DP tracer kinetic model.
F (blood flow), α (arterial fraction, or % hepatic arterial flow from total hepatic blood flow), FA (hepatic arterial blood flow), FPV (hepatic portal venous blood flow), t0 (contrast arrival time), t1 (MTT), v1 (fractional intravascular volume), v2 (fractional interstitial volume), E (extraction fraction), PS (permeability-surface area product). Note that in the two liver metastases demonstrated (outlined in pink), the lesions were characterized by lower total blood flow, but higher arterial fraction and fractional interstitial volume.
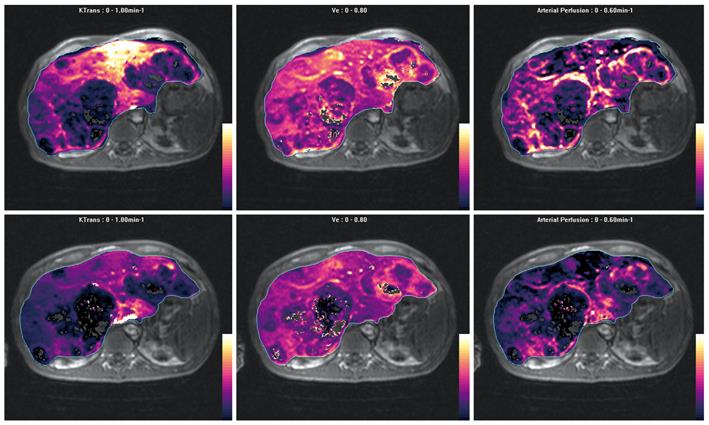
Figure 9 Parametric maps of efflux constant (Ktrans), extravascular extracellular space (Ve) and arterial perfusion fraction before (top row) and after (bottom row) anti-angiogenic therapy obtained using a dual-input, single-compartment, conventional compartment model (after Materne et al[46]).
Note multiple metastases in the liver, which are largely hypovascular but show increased arterial perfusion at the edge of the lesions. The metastases also show moderate Ve. After treatment with anti-angiogenic drug, arterial perfusion is reduced at the tumor rims, also with a decrease in tumor Ve. The Ktrans in the left lobe of the liver is also decreased, which may reflect drug effects on microscopic disease.
- Citation: Thng CH, Koh TS, Collins DJ, Koh DM. Perfusion magnetic resonance imaging of the liver. World J Gastroenterol 2010; 16(13): 1598-1609
- URL: https://www.wjgnet.com/1007-9327/full/v16/i13/1598.htm
- DOI: https://dx.doi.org/10.3748/wjg.v16.i13.1598


