Copyright
©2010 Baishideng.
World J Gastroenterol. Apr 7, 2010; 16(13): 1567-1576
Published online Apr 7, 2010. doi: 10.3748/wjg.v16.i13.1567
Published online Apr 7, 2010. doi: 10.3748/wjg.v16.i13.1567
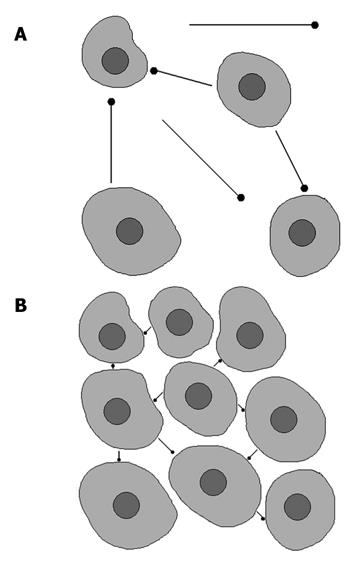
Figure 1 Brownian movements in hypocellular (A) and hypercellular (B) environment.
A: Tissue with low cellularity permits movement of the water molecules; B: Tissue with high cellularity restricts the movement of water molecules.
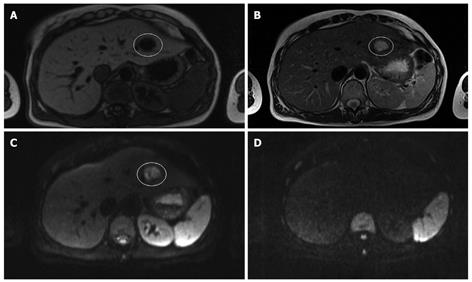
Figure 2 Magnetic resonance imaging (MRI) and diffusion weighted imaging (DWI) of a cyst.
A: T1-weighted MRI; B: T2-weighted MRI; C: Diffusion weighted image (b-value 50 s/mm2); D: Diffusion weighted image (b-value 1000 s/mm2) in a 33-year old woman with multiple liver lesions. The cyst is hypo-intense on the T1-weighted image, hyper-intense on the T2-weighted image and the diffusion weighted image at a b-value 50 s/mm2. Note that the cyst totally disappears on the diffusion weighted image at a b-value 1000 s/mm2.
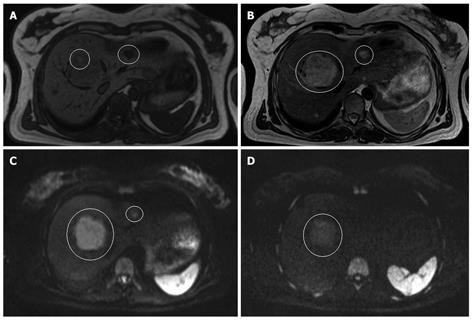
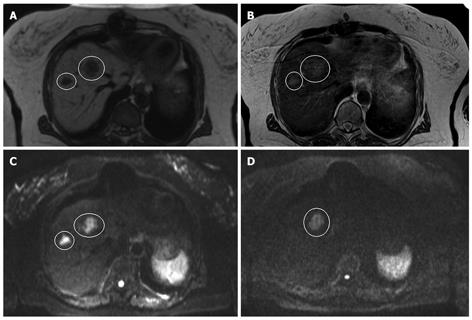
Figure 3 MRI and DWI of an adenoma and a hemangioma.
A: T1-weighted MRI; B: T2-weighted MRI; C: Diffusion weighted image (b-value 50 s/mm2); D: Diffusion weighted image (b-value 1000 s/mm2) in a 41-year-old women with multiple liver lesions. The large lesion in segment 8 is an adenoma and the small one in segment 2-3 is a hemangioma. On the T1-weighted image, the adenoma is slightly hypo-intense to the normal liver parenchyma, and hyper-intense on the T2-weighted image. On the diffusion weighted images, it remains hyper-intense at both b-values. The hemangioma is also hypo-intense on the T1-weighted image and hyper-intense on the T2-weighted image. However, in contrast to the adenoma, it totally disappears at a b-value of 1000 mm/s2.
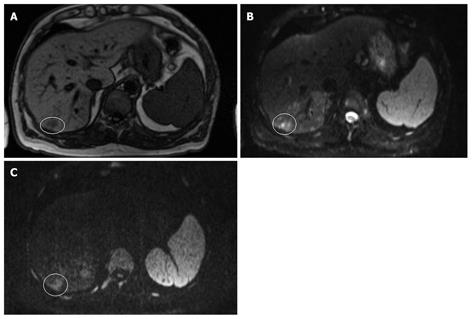
Figure 4 MRI and DWI of hepatocellular carcinoma.
A: T1-weighted; B: DWI (b-value 50 s/mm2); C: Diffusion weighted image (b-value 1000 s/mm2) in a 67-year-old male with hemophilia, hepatitis C-based liver cirrhosis and HCC in segment 7. The HCC is hypo-intense on the T1-weighted image and hyper-intense on the diffusion weighted images at both b-values. Note that the lesion remains hyper-intense on the image with a b-value 1000 s/mm2.
Figure 5 MRI and DWI of hepatic metastases.
A: T1-weighted; B: T2-weighted; C: Diffusion weighted image (b-value 50 s/mm2); D: Diffusion weighted image (b-value 1000 s/mm2) in a 74-year-old woman with a history of rectal cancer, recently diagnosed with lung and liver metastases in segment 4 and 8, respectively. The lesions are hypo-intense to the liver parenchyma on the T1-weighted image and hyper-intense on the T2-weighted image. On the diffusion weighted image at a b-value 50 s/mm2, both lesions appear hyper-intense, but at a b-value 1000 s/mm2, only the lesion in segment 4 remains hyper-intense. The lesion in segment 8 has completely disappeared.
- Citation: Kele PG, Jagt EJVD. Diffusion weighted imaging in the liver. World J Gastroenterol 2010; 16(13): 1567-1576
- URL: https://www.wjgnet.com/1007-9327/full/v16/i13/1567.htm
- DOI: https://dx.doi.org/10.3748/wjg.v16.i13.1567


