Copyright
©2010 Baishideng.
World J Gastroenterol. Jan 7, 2010; 16(1): 48-55
Published online Jan 7, 2010. doi: 10.3748/wjg.v16.i1.48
Published online Jan 7, 2010. doi: 10.3748/wjg.v16.i1.48
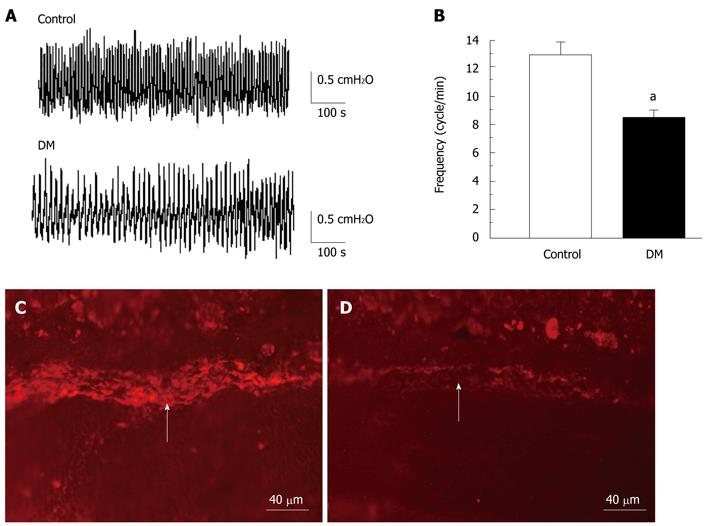
Figure 1 Comparision of gastric contractility and expression of ICCs in normal and STZ-induced diabetic mice.
A: Representative traces of spontaneous gastric contraction in control and STZ-induced diabetic mice; B: Summary of amplitudes and frequencies of gastric motility in control and STZ-induced diabetic groups (n = 8; aP < 0.05 vs control group); C and D: Expression of c-Kit-positive cells in the muscle layer. Arrow indicates the positive staining area. Expression of c-Kit was more obvious in STZ-induced diabetic mice than in the normal controls. Scale bar = 40 μm.
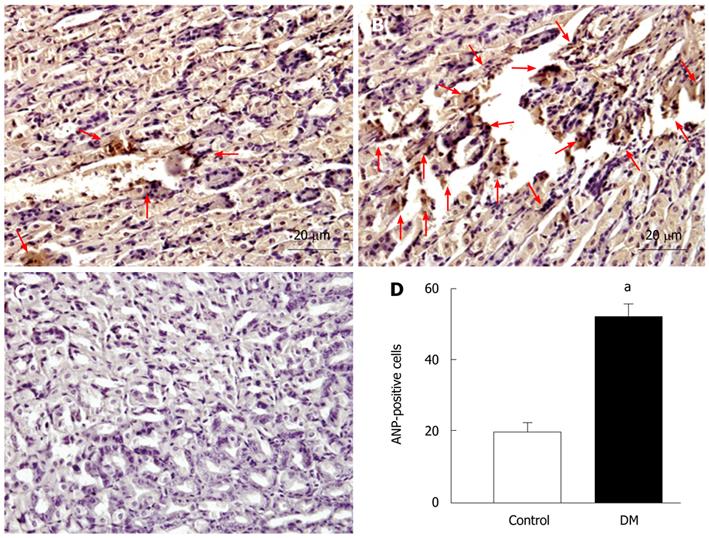
Figure 2 Immunohistochemical analysis of atrial natriuretic peptide (ANP) in mouse gastric tissue.
The photographs show ANP expression in gastric mucosa in the control group (A), STZ-induced diabetic group (B), and negative control group (C); The paranuclear cytoplasmic stained cells that display an intense dark brown color were ANP-positive-staining cells in the mucosa. The red arrows indicate ANP-positive cells; B shows that the number of ANP-positive cells increased in the STZ-induced diabetic group; D shows the density index that referred to the number of ANP-positive cells per field of vision (n = 8, aP < 0.05 vs control group). Scale bar = 20 μm.
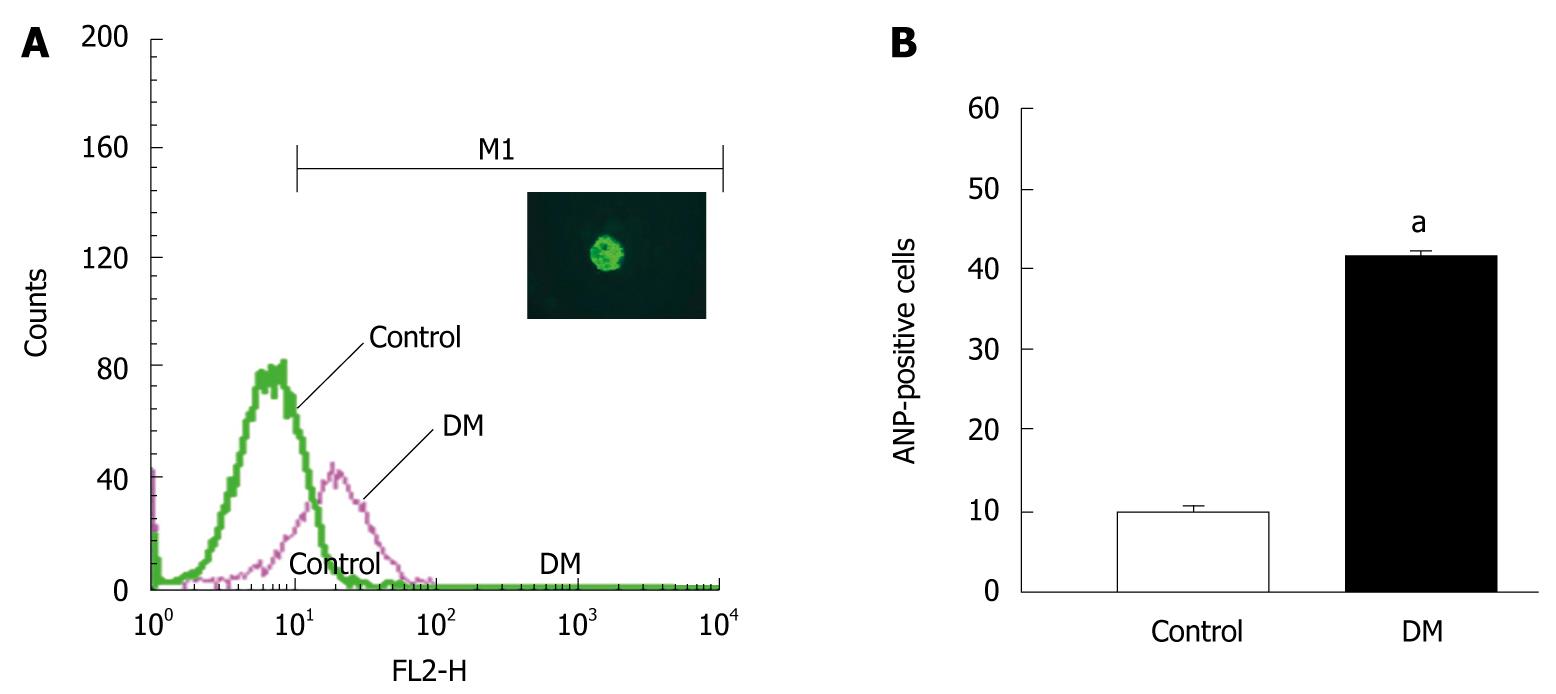
Figure 3 Flow cytometric analysis of ANP-positive cells among gastric mucosal cells.
The percentage of ANP-positive cells was determined by flow cytometry with FITC-conjugated goat anti-rabbit IgG. A: Relative fluorescence intensity of gastric mucosal cells in the control and diabetic groups. M1 indicates the proportions of ANP-positive cells that displayed positive FITC labeling. The inserted fluorescent image is a single ANP-positive cell that had a positive fluorescent signal in its cytoplasm (× 400); B: ANP-positive cells among the gastric mucosal cells (104 cells per sample) in control and STZ-induced diabetic mice (n = 3, aP < 0.05 vs control).
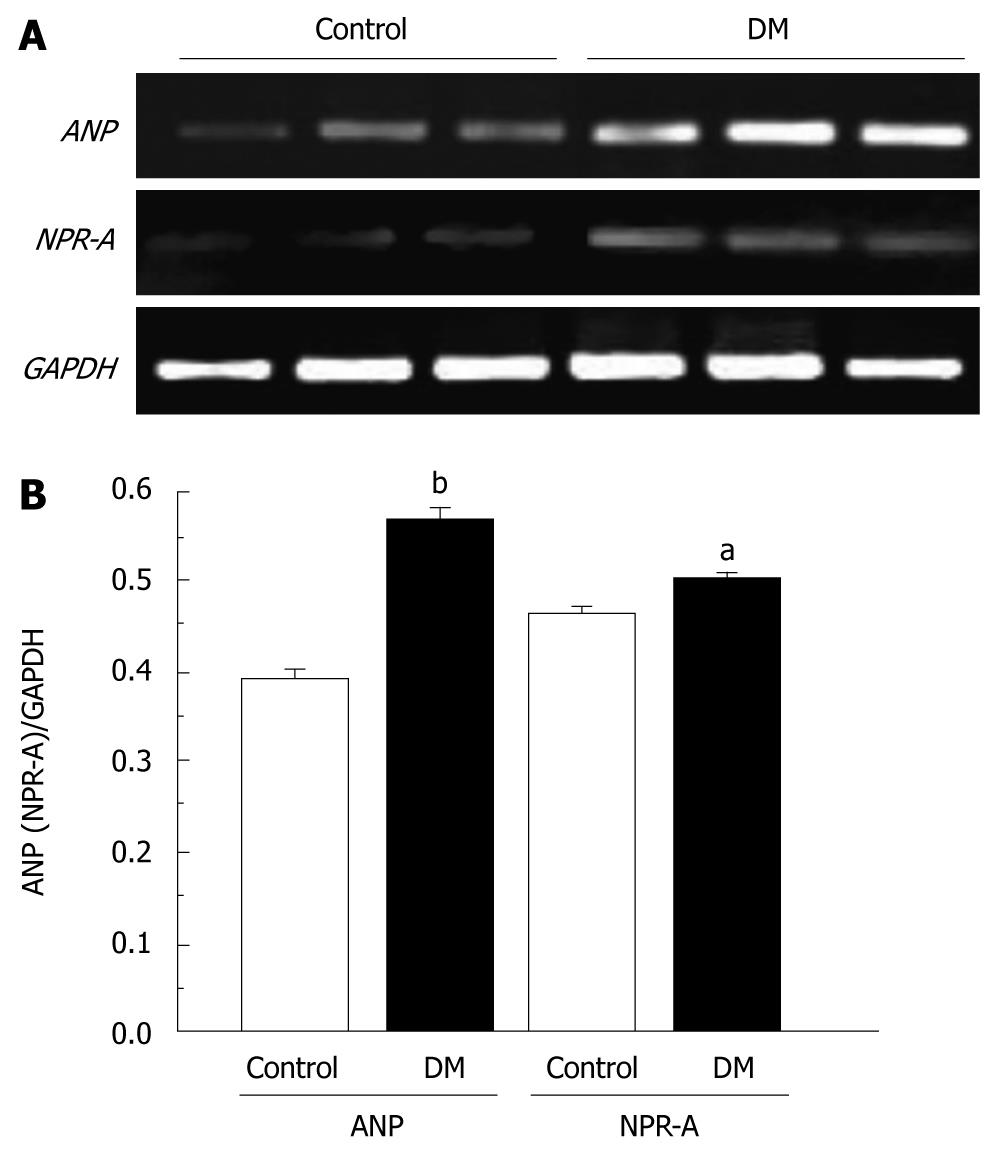
Figure 4 RT-PCR of gastric ANP and NPR-A genes in control and STZ-induced diabetic mice.
A: Results of agarose gel electrophoresis, including ANP, NPR-A and GAPDH genes. The density signal was normalized to that of GAPDH. The mean value of the density was obtained from three separate experiments; B: Expression of ANP and NPR-A genes was increased in STZ-induced diabetic mice (n = 3; aP < 0.05, bP < 0.01 vs control).
- Citation: Qiu ZX, Mei B, Wu YS, Huang X, Wang ZY, Han YF, Lu HL, Kim YC, Xu WX. Atrial natriuretic peptide signal pathway upregulated in stomach of streptozotocin-induced diabetic mice. World J Gastroenterol 2010; 16(1): 48-55
- URL: https://www.wjgnet.com/1007-9327/full/v16/i1/48.htm
- DOI: https://dx.doi.org/10.3748/wjg.v16.i1.48


