Copyright
©2009 The WJG Press and Baishideng.
World J Gastroenterol. Mar 7, 2009; 15(9): 1065-1071
Published online Mar 7, 2009. doi: 10.3748/wjg.15.1065
Published online Mar 7, 2009. doi: 10.3748/wjg.15.1065
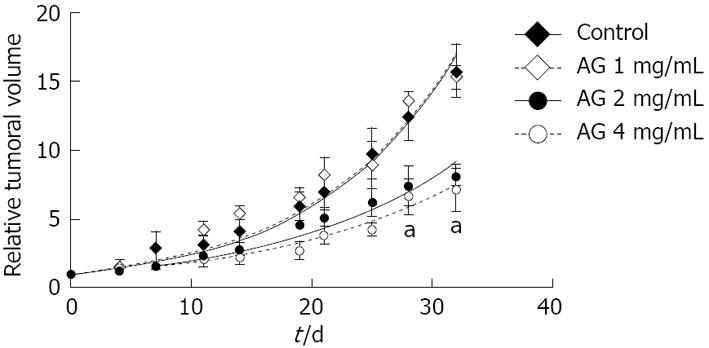
Figure 1 Antitumor effect of AG in PANC-1 xenografted mice.
Tumor volumes were determined and referred to the initial volume for each treatment. aP < 0.01 for AG 2 and 4 mg/mL vs control, two way ANOVA and Bonferroni post test.
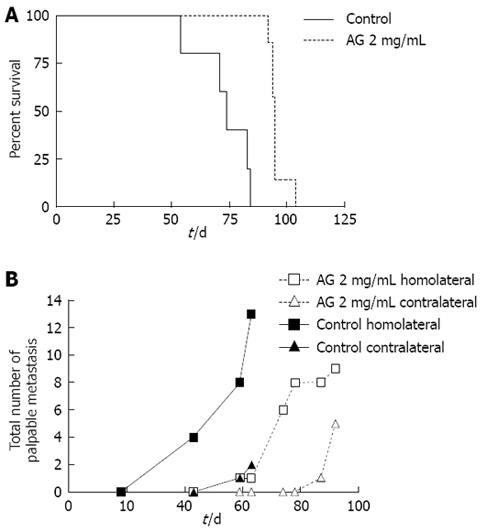
Figure 2 Action of AG on survival and metastases in PANC-1 xenografted mice.
A: Time of spontaneous death of mice was determined, Kaplan-Meier survival curves were plotted and median survival was calculated. P < 0.01 for AG vs control, log-rank test; B: The development of palpable homolateral and contralateral metastases, which appeared mainly in lymph nodes, was checked until the death of the animals. Total number of metastases developed in both groups (n = 7 each group) and medians of appearance were determined. Curves were compared by logrank test, P < 0.01.
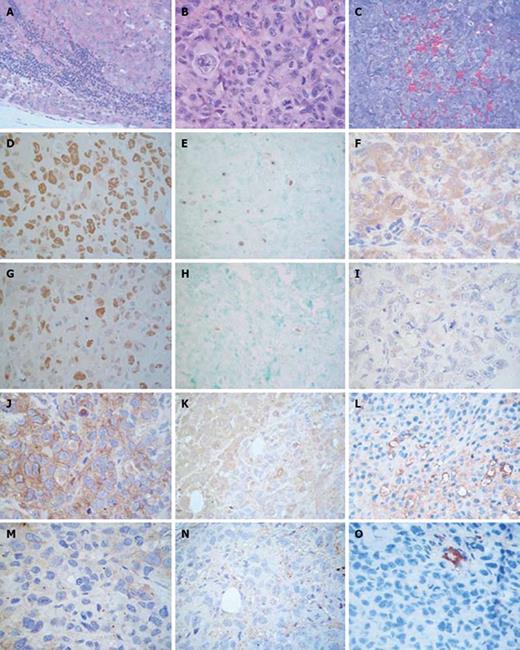
Figure 3 Histopathology and immunohistochemistry of PANC-1 xenografted mice.
Formalin fixed paraffin embedded tissue sections of control mice were stained with HE. A: Metastatic lymph node (× 400); B: Xenografts (× 630). Immunohistochemistry in control and AG treated mice. Tissue sections were stained with DAB and counterstained with hematoxylin; C: Formalin fixed paraffin embedded tissue sections of control mice were stained with trichromic solution (× 400); D, G: Ki-67 (× 630); E, H: Tunel (× 400); F, I: Bax (× 630); J, M: VEGF (× 630); K, N: eNOS (× 630); L, O: CD34 in control (× 400) and AG treated (× 630) mice. Formalin fixed paraffin embedded tissue sections of control mice were stained with trichrome solution.
- Citation: Mohamad NA, Cricco GP, Sambuco LA, Croci M, Medina VA, Gutiérrez AS, Bergoc RM, Rivera ES, Martín GA. Aminoguanidine impedes human pancreatic tumor growth and metastasis development in nude mice. World J Gastroenterol 2009; 15(9): 1065-1071
- URL: https://www.wjgnet.com/1007-9327/full/v15/i9/1065.htm
- DOI: https://dx.doi.org/10.3748/wjg.15.1065


