Copyright
©2009 The WJG Press and Baishideng.
World J Gastroenterol. Mar 7, 2009; 15(9): 1057-1064
Published online Mar 7, 2009. doi: 10.3748/wjg.15.1057
Published online Mar 7, 2009. doi: 10.3748/wjg.15.1057
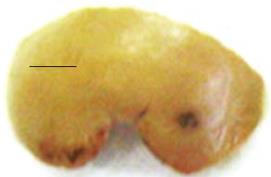
Figure 1 The traumatic liver injury model used to induce regeneration.
The wound was created in one of the lobes of rat liver by removing a wedge of tissue (3-4 mm on each side) with a pair of fine scissors. In rats with activated or unactivated omentum, the wound was filled with new liver tissue by day 7. On the other hand, in omentectomized rats the original wound edges as seen in the picture remained visible for up to 28 d. The horizontal black bar in the picture represents 3 mm.
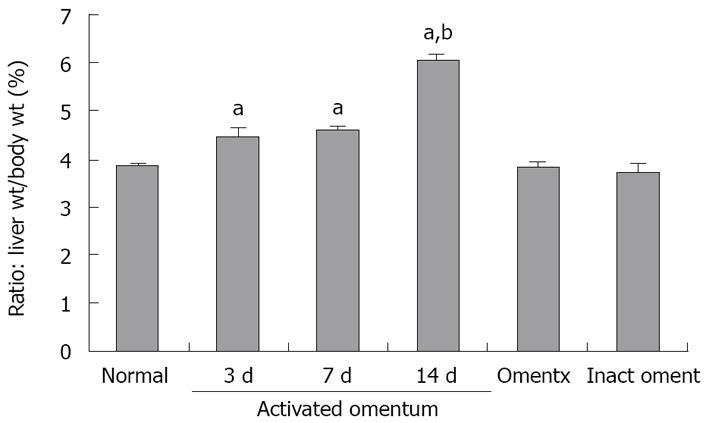
Figure 2 Liver mass (as a ratio of body weight) at different times after injury and fusing of the activated omentum to the wound.
The ratio of liver wt/body wt in normal rats was established to be 3.85% ± 0.07%. ‘Omentx’ are rats in which the omentum was removed before liver injury (n = 12) and ‘inact oment’ are rats in which the liver was injured, but the omentum was inactivated (n = 12). Liver regeneration following wounding and fusion of activated omentum was rapid, and by day 3 the liver grew to 110% of the original mass. The liver continued to grow, reaching a maximum size of 150% of the original mass by day 14, after which growth stopped (day 28, data not shown). Normal = 15 rats and there were 6 in each of the 3, 7, 14 and 28 d groups. aDenotes statistical difference from normal or ‘omentx’ or ‘inact oment’ groups at P < 0.05. bDenotes statistical difference from day 3 and day 7 groups at P < 0.05. With regard to ‘omentx’ and ‘inact oment’ groups, no differences were seen at days 3, 7, 14 and 28 compared to Normal (only day 14 data is shown in the figure; n = 3).
Figure 3 Histology of the boundary between the growing edge of the liver and the activated omentum.
A: Normal rat liver; B: 7 d after liver injury the liver and the omentum were separated by a wide and compact interlying tissue (400-600 &mgr;m). On one side of the interlying tissue (T) lay the omental tissue (OM) with the embedded polydextran gel particles and on the other side was the liver tissue (L). Occasionally, islands of liver tissue were observed in the interlying tissue (Figure 4G). The compactness and the width of the interlying tissue was maximal between 3 and 7 d after liver injury (B) which became thinner (100-150 &mgr;m) and looser by day 14 (C). By 28 d the interlying tissue was barely appreciable and looked like a tissue septum (picture not shown). Trichrome staining. The horizontal white bar in the pictures represents 100 &mgr;m.
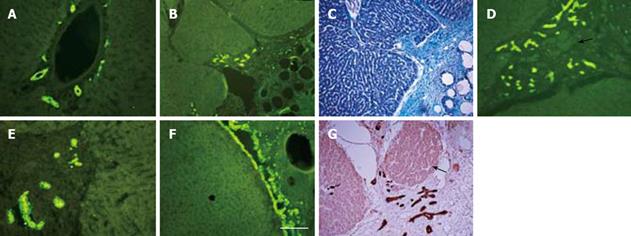
Figure 4 Immunostaining of normal and regenerated rat liver (from activated omentum) for cytokeratin-19, a marker of oval cells.
A: Normal or uninjured liver lobe showing widespread presence of oval cells in the lining of bile ducts lying around a central vein; B, D, E, G: Different areas of injured liver showing extensions of cytokeratin-19 positive bile ducts in the interlying tissue between the liver and the activated omentum; C: Tissue section shown in B stained with Trichrome to show the bile ducts lying in the interlying omental tissue; F: Occasionally, the growing edge of the liver lying in the interlying tissue was seen to be entirely covered with cytokeratin-19 positive cells; G: Islands of liver tissue, probably newly formed, were seen in the interlying tissue (white arrows; also seen in D); A, B, D-F were stained by immunofluorescence (green); G was stained by immunoperoxidase (brown). The horizontal white bar in F represents 100 &mgr;m for all pictures.
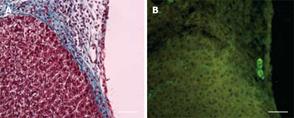
Figure 5 Histology and cytokeratin-19 immune staining of the liver at the boundary between the growing edge of the liver and the inactivated omentum at day 3 or 7 after injury.
A: Trichrome stained section showing the adherent omental tissue with a thinner interlying tissue (blue stained) than that seen in the activated omentum group (Figure 3 for comparison); B: Cytokeratin-19 positive bile ducts were seen in the interlying tissue (same section as A) although these were much less frequent than those seen in the activated omentum group (Figure 4 for comparison). The horizontal white bar in pictures represents 100 &mgr;m.
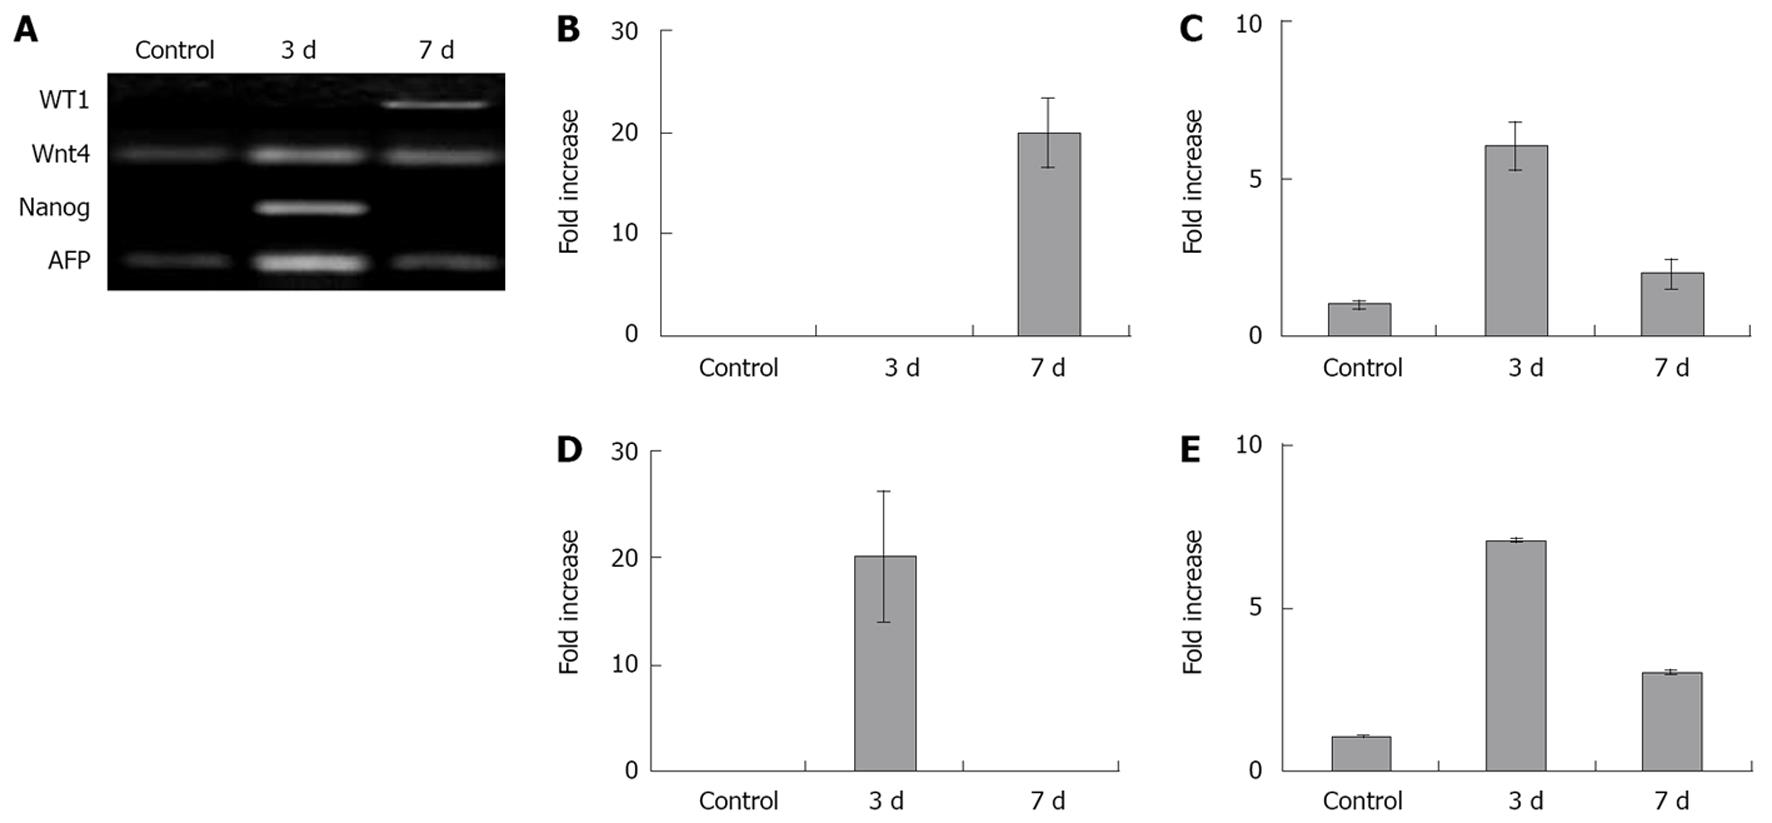
Figure 6 Activation of developmental genes in the regenerated liver at the wound site at days 3 and 7 after injury and fusion of the activated omentum.
The regenerating part of the liver (part of liver attached to the omentum) showed high expression levels (7 to 20-fold) of WT-1, Wnt-4, Nanog, AFP by RT-PCR (A) compared with normal rat adult liver tissue (control). Wnt-4 (C), Nanog (D), and AFP (E) were maximally activated at day 3, while WT-1 (B) showed maximal activation at day 7. Tissue from regenerated liver, from sites further away from the wound area (0.5 cm, 1.0 cm further away in the same lobe and from an uninjured lobe), showed reduced activation of WT-1, Wnt-4 and AFP genes (although higher in all cases compared with normal adult liver), suggesting that the regeneration stimulus ‘rippled’ throughout the liver from the wound area (data not shown). n = 3 in each bar and the differences amongst the bars within each of the figures B, C, D, and E are statistically significant (P < 0.05).
- Citation: Singh AK, Pancholi N, Patel J, Litbarg NO, Gudehithlu KP, Sethupathi P, Kraus M, Dunea G, Arruda JA. Omentum facilitates liver regeneration. World J Gastroenterol 2009; 15(9): 1057-1064
- URL: https://www.wjgnet.com/1007-9327/full/v15/i9/1057.htm
- DOI: https://dx.doi.org/10.3748/wjg.15.1057


