Copyright
©2009 The WJG Press and Baishideng.
World J Gastroenterol. Dec 21, 2009; 15(47): 6000-6003
Published online Dec 21, 2009. doi: 10.3748/wjg.15.6000
Published online Dec 21, 2009. doi: 10.3748/wjg.15.6000
Figure 1 Axial (A) and coronal (B) T2 weighted MRI of the brain demonstrating the large soft tissue mass in the superior and lateral aspect of the right orbit (white arrows) prior to radiation treatment and resolution of mass on follow-up MRI 12 mo after treatment on axial (C) and coronal images (D).
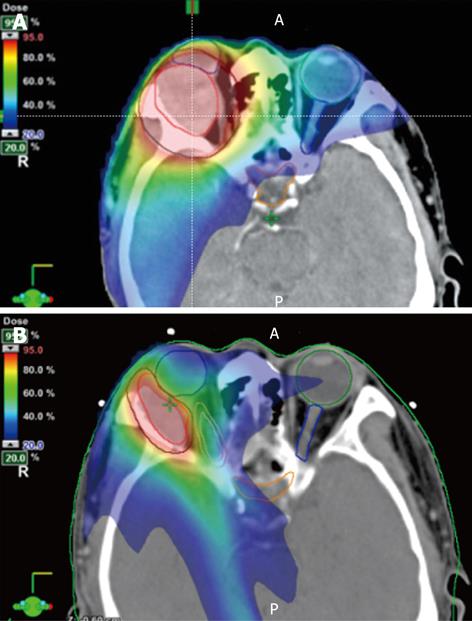
Figure 2 Three-dimensional contours for treatment planning demonstrate the gross target volume (GTV) encompassing the tumor (red contour) and the planning target volume (PTV, black contour) on initial (A) and boost (B) CT images.
Doses from the initial 7 field intensity modulated radiation (IMRT) plan (A) are represented as color wash according to the scale shown in the figures, representing the range of 95% through 20% of dose coverage. The 7 field IMRT plan for the coned-down field (B) shows even tighter dose coverage and greater sparing of the right optic nerve (pink contour).
- Citation: Quick AM, Bloomston M, Kim EY, Hall NC, Mayr NA. Complete response to radiation therapy of orbital metastasis from hepatocellular carcinoma. World J Gastroenterol 2009; 15(47): 6000-6003
- URL: https://www.wjgnet.com/1007-9327/full/v15/i47/6000.htm
- DOI: https://dx.doi.org/10.3748/wjg.15.6000


