Copyright
©2009 The WJG Press and Baishideng.
World J Gastroenterol. Dec 7, 2009; 15(45): 5674-5684
Published online Dec 7, 2009. doi: 10.3748/wjg.15.5674
Published online Dec 7, 2009. doi: 10.3748/wjg.15.5674
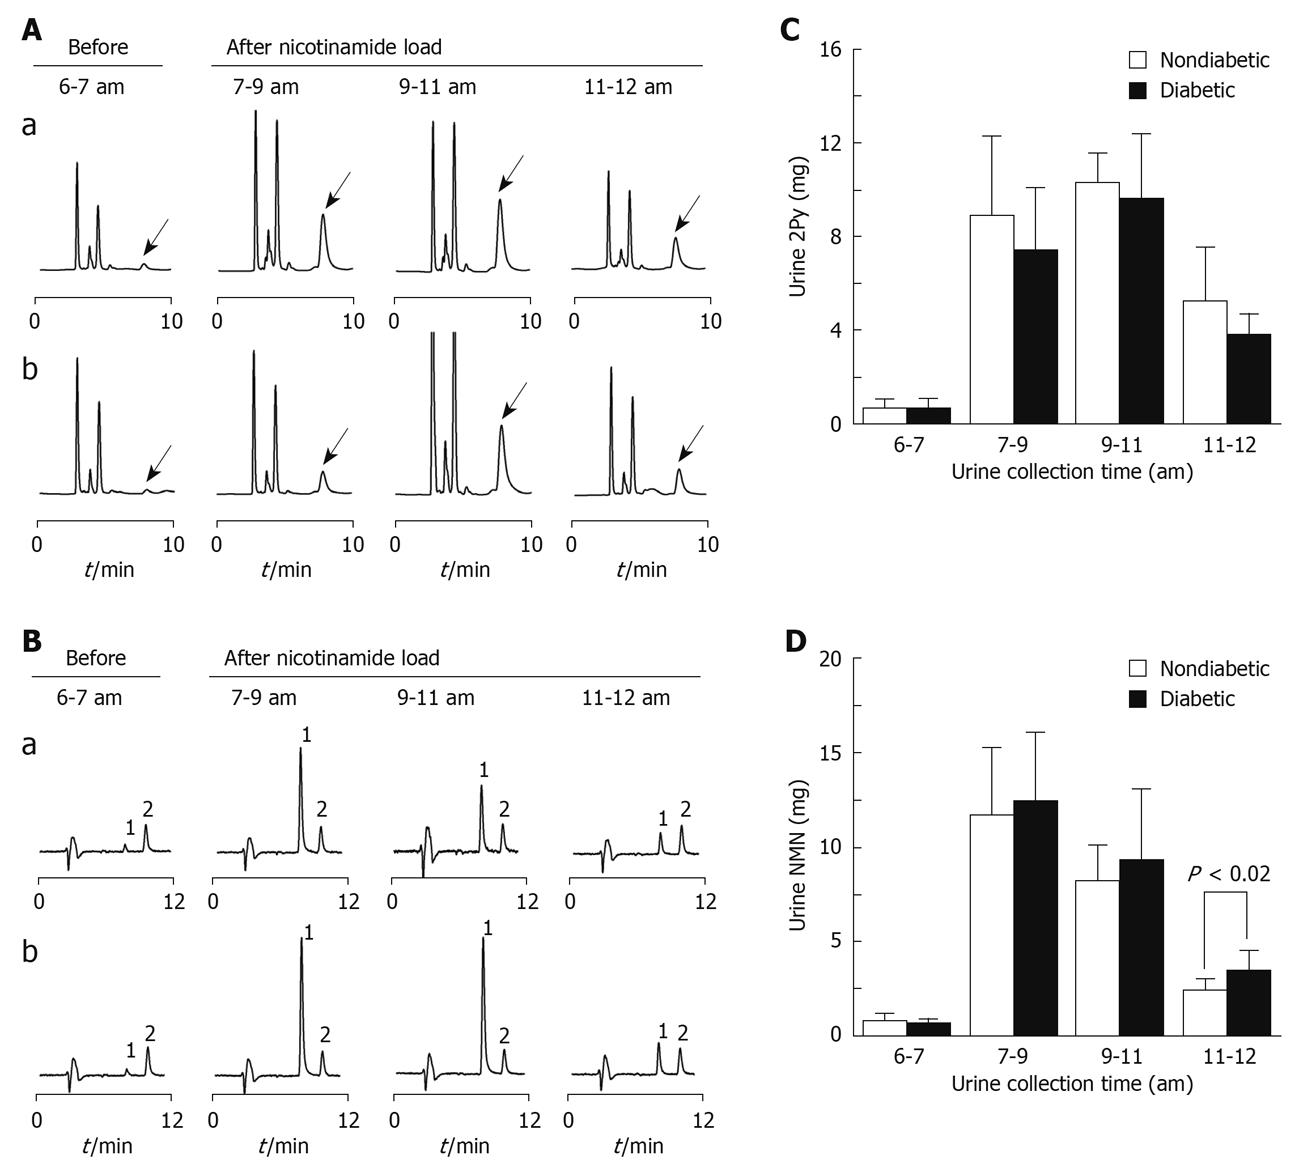
Figure 1 Urinary excretion patterns of 2Py and N1-methylnicotinamide in diabetic and non-diabetic subjects.
A and B: Representative HPLC chromatograms of urinary excretions of 2Py (indicated by arrow) and N1-methylnicotinamide (NMN) of a non-diabetic (Aa and Ba) and a diabetic (Ab and Bb) subject, before and after 100 mg nicotinamide loading at 7:00 am Urine samples taken at given time were normalized to equal volumes before HPLC analysis; C and D: Summaries of the results from the measurements shown in A and B, respectively. Bar graphs indicate mean ± SD.
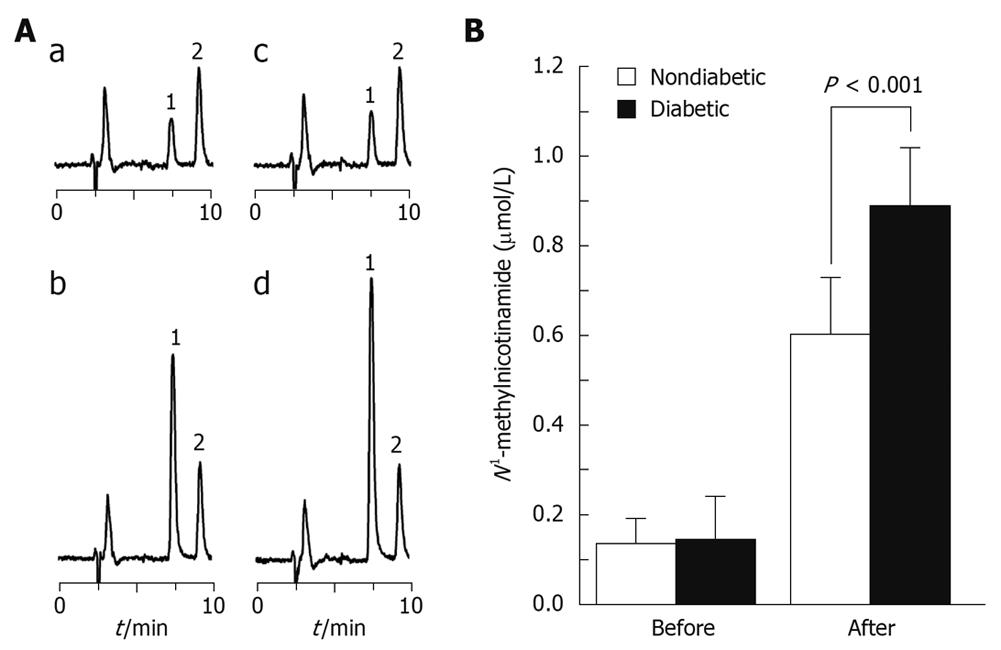
Figure 2 Plasma N1-methylnicotinamide levels of diabetic and non-diabetic subjects after nicotinamide loading.
A: Representative HPLC chromatograms of plasma N1-methylnicotinamide levels from a non-diabetic (a, b) and a diabetic (c, d) subject before (a, c) and 5 h after (b, d) 100 mg nicotinamide loading. 1: N1-methylnicotinamide; 2: Internal standard: N1-methylnicotinamide; B: Summary of the results from the measurements shown in A. Bar graph indicates mean ± SD.
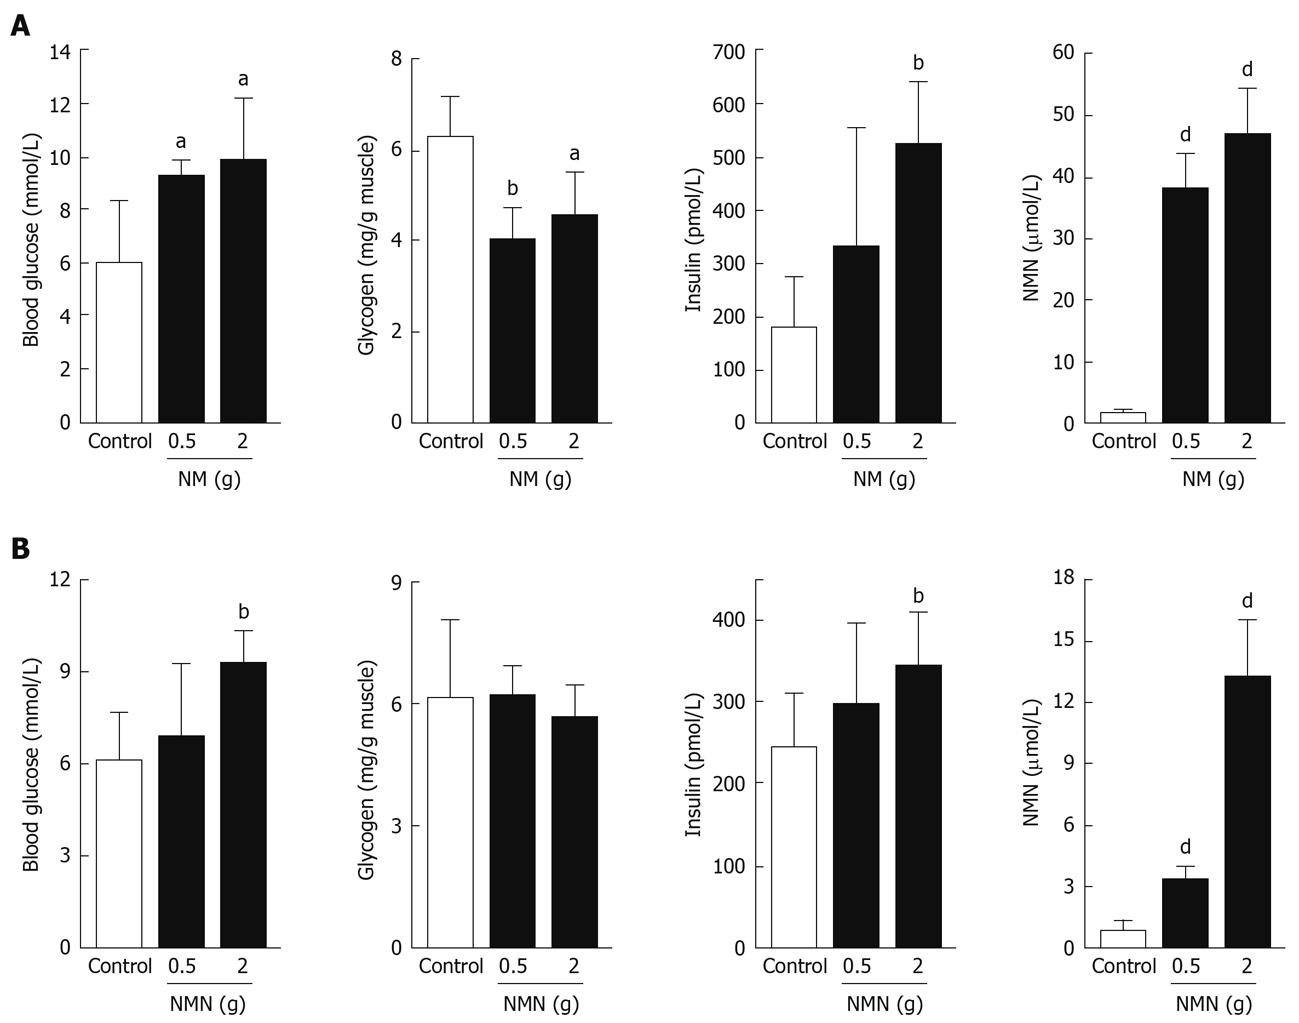
Figure 3 Effects of nicotinamide and N1-methylnicotinamide on glucose metabolism of rats.
A: Changes in blood glucose, muscle glycogen, plasma insulin and plasma N1-methylnicotinamide in rats treated with or without cumulative nicotinamide (0.5 or 2 g/kg) after glucose loading; B: Comparable effects of cumulative N1-methylnicotinamide (0.5 or 2 g/kg). NM: Nicotinamide; NMN: N1-methylnicotinamide. aP < 0.05 vs control, bP < 0.01 vs control, dP < 0.001 vs control. Bar graphs show mean ± SD.
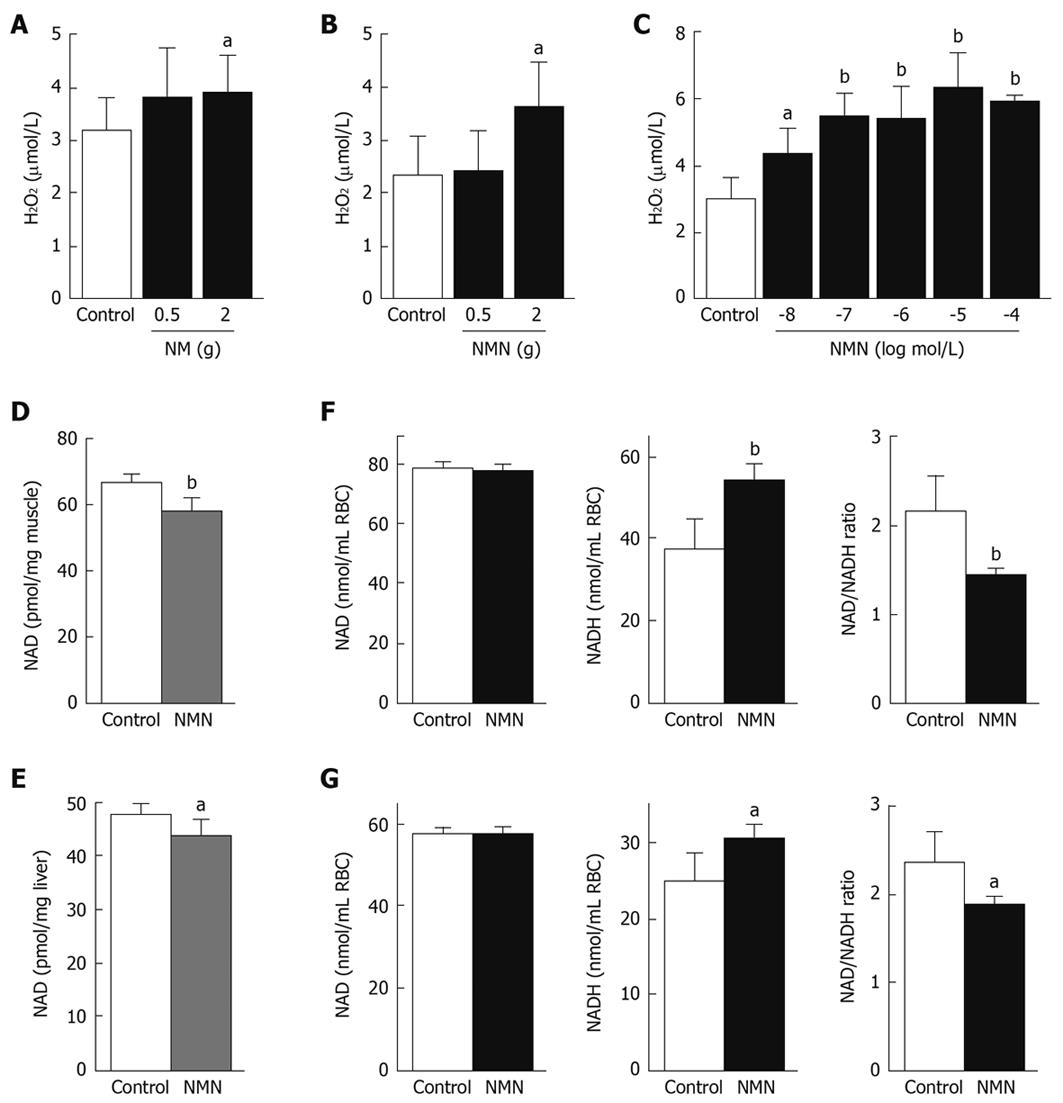
Figure 4 Effects of N1-methylnicotinamide on H2O2 generation and NAD levels.
A, B: Cumulative effects of nicotinamide (NM, 0.5 or 2 g/kg) and N1-methylnicotinamide (NMN, 0.5 or 2 g/kg) on rat plasma H2O2 levels; C: H2O2 concentrations in the supernatant of cultured human erythrocytes with or without 3 h exposure to different concentrations of NMN. For each concentration, n = 4; D, E: NAD (NAD+ and NADH) contents in muscle (D) and liver (E) of rats treated with saline (control) or a cumulative dose of 2 g/kg NMN; F: NAD and NADH contents and NAD/NADH ratio in the erythrocytes (RBCs) of rats with or without cumulative exposure to NMN; G: NAD and NADH contents, and NAD/NADH ratio in human RBCs with (n = 4) or without (control, n = 4) 4 h exposure to 10 μmol/L NMN in vitro. aP < 0.05 vs control, bP < 0.01 vs control. Bar graphs indicate mean ± SD.
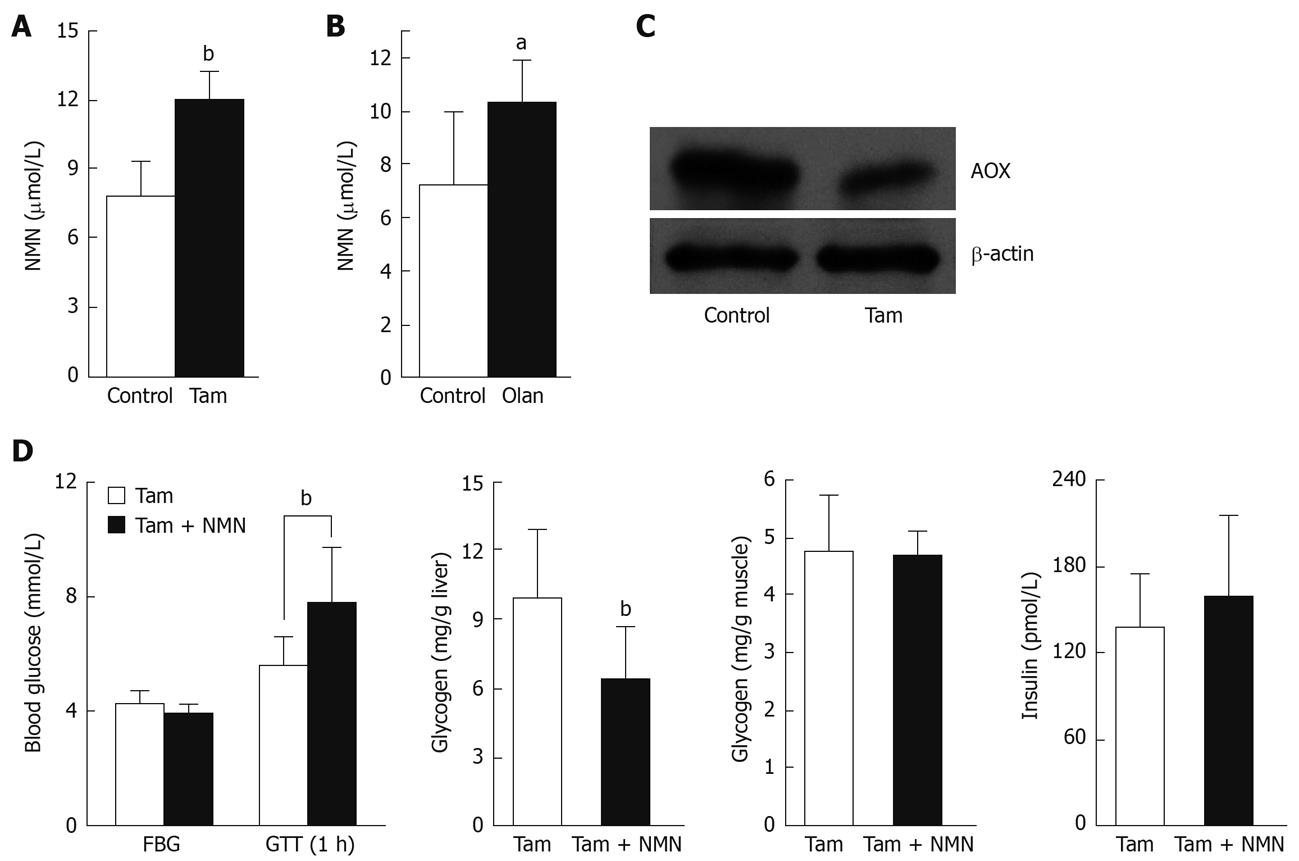
Figure 5 Effects of aldehyde oxidase (AOX) inhibitors on plasma N1-methylnicotinamide levels and glucose metabolism in rats.
A and B: Plasma N1-methylnicotinamide (NMN) levels 5 h after nicotinamide load (100 mg/kg, ip) in rats treated with or without AOX inhibitors tamoxifen (Tam, A) or olanzapine (Olan, B) (each group, n = 6). aP < 0.05 vs control, bP < 0.01 vs control; C: Liver AOX expression in rats with or without 7 wk tamoxifen treatment. The blot is representative of four independent experiments; D: Responses to a glucose tolerance test in rats after 9 wk treatment with tamoxifen with or without NMN (100 mg/kg per day) treatment in the last 2 wk. FBG: Fasting blood glucose; GTT (1 h): Blood glucose measured 1 h after glucose tolerance test. bP < 0.01 vs control. Bar graph indicates mean ± SD.
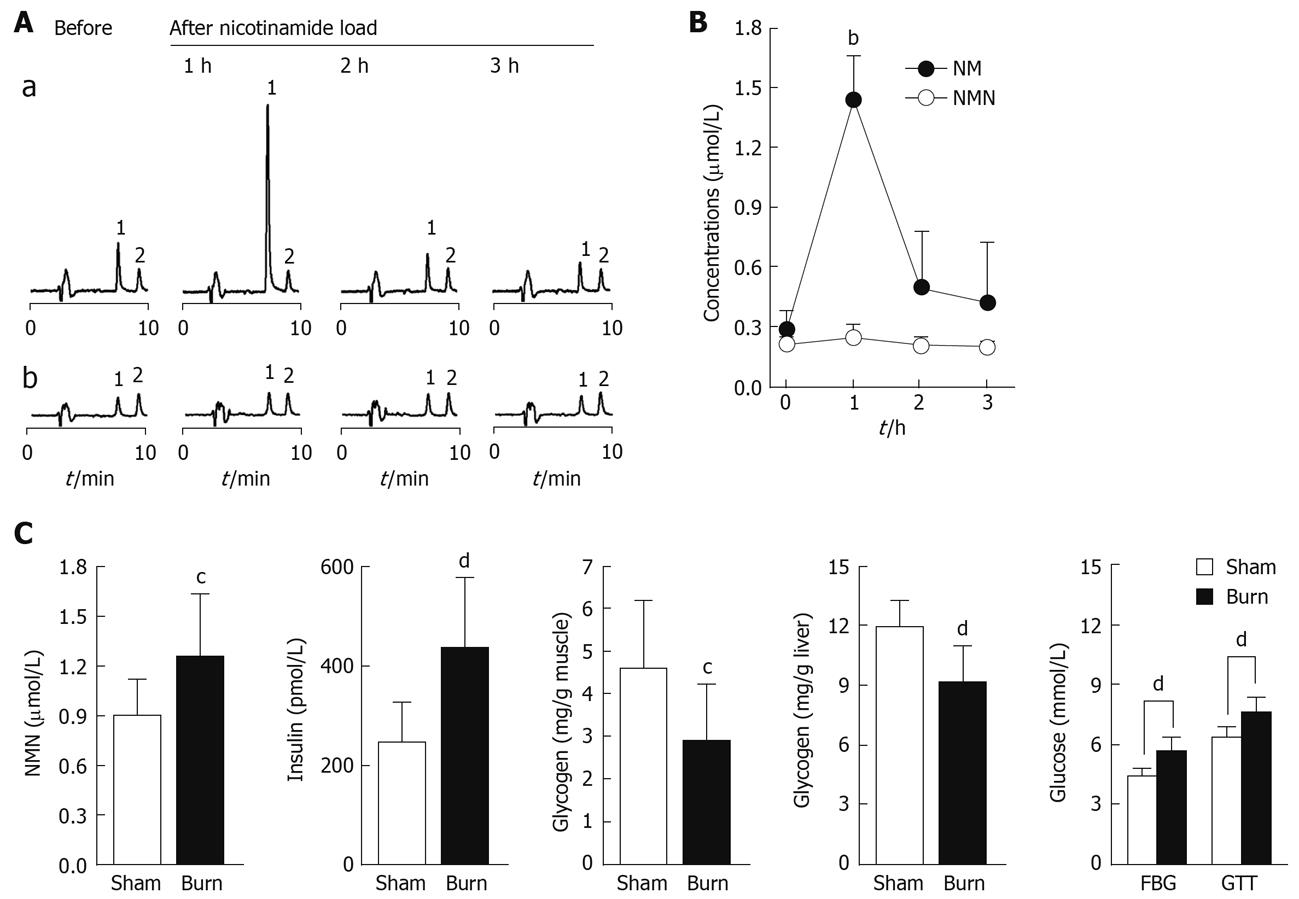
Figure 6 Role of skin in nicotinamide metabolism and insulin resistance.
A: Representative HPLC chromatograms showing changes of sweat nicotinamide (NM) and N1-methylnicotinamide (NMN) concentrations in a subject before and 1, 2 and 3 h after 100 mg nicotinamide loading. 1 and 2 in Aa are NM and internal standard N1-ethylnicotinamide, respectively; 1 and 2 in Ab are NMN and internal standard N1-ethylnicotinamide, respectively; B: Summary of the measurements shown in A. bP < 0.0001 vs control; C: Comparison of plasma NMN and insulin levels, muscle and liver glycogen contents, and blood glucose between sham-burn (n = 7) and burn (n = 11) rats after glucose load. FBG: Fasting blood glucose; GTT: Blood glucose 1 h after glucose injection. Bar graphs show mean ± SD. cP < 0.05, dP < 0.01 vs control.
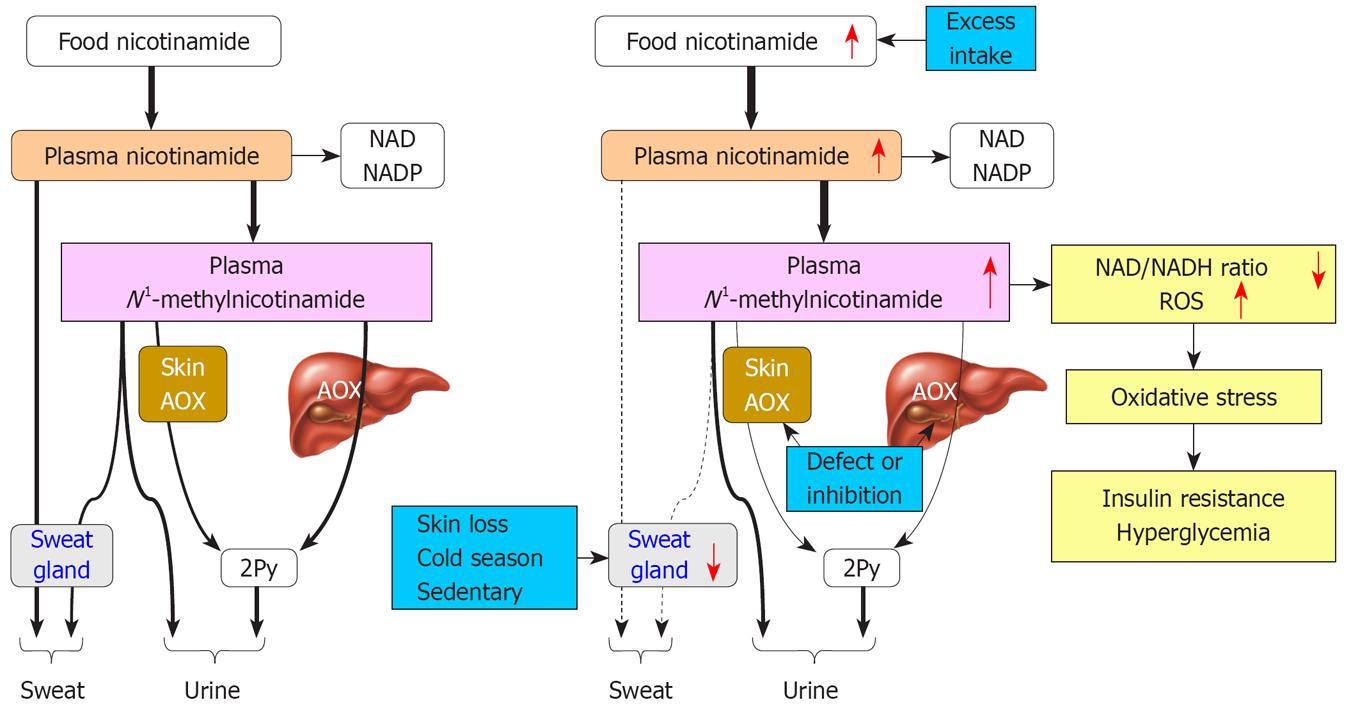
Figure 7 Proposed model of the role of nicotinamide overload in the development of type 2 diabetes.
Normally, if nicotinamide intake is slightly more than the body needs, excess nicotinamide will be detoxified rapidly and eliminated mainly via the N1-methylnicotinamide to 2Py pathway, which involves liver and skin functions (left). Frequent excess nicotinamide intake, low N1-methylnicotinamide detoxification, or sweat gland inactivity induces a substantial rise in plasma N1-methylnicotinamide concentrations and residence time after each meal, and consequently induces oxidative stress and insulin resistance (right). The change trends are indicated by red arrows or line thickness.
- Citation: Zhou SS, Li D, Sun WP, Guo M, Lun YZ, Zhou YM, Xiao FC, Jing LX, Sun SX, Zhang LB, Luo N, Bian FN, Zou W, Dong LB, Zhao ZG, Li SF, Gong XJ, Yu ZG, Sun CB, Zheng CL, Jiang DJ, Li ZN. Nicotinamide overload may play a role in the development of type 2 diabetes. World J Gastroenterol 2009; 15(45): 5674-5684
- URL: https://www.wjgnet.com/1007-9327/full/v15/i45/5674.htm
- DOI: https://dx.doi.org/10.3748/wjg.15.5674


