Copyright
©2009 The WJG Press and Baishideng.
World J Gastroenterol. Nov 28, 2009; 15(44): 5579-5585
Published online Nov 28, 2009. doi: 10.3748/wjg.15.5579
Published online Nov 28, 2009. doi: 10.3748/wjg.15.5579
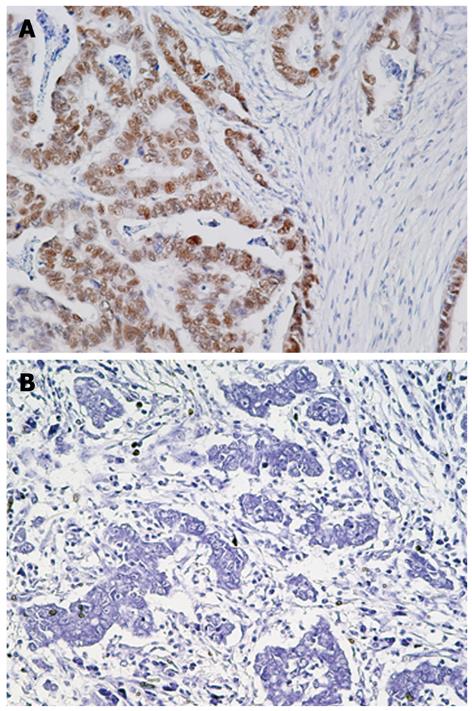
Figure 1 Immunohistochemistry for JCV T-Ag in gastric cancer tissues.
A: Gastric adenocarcinoma positive for JCV T-Ag; B: Gastric adenocarcinoma negative for JCV T-Ag. Original magnification, × 200.
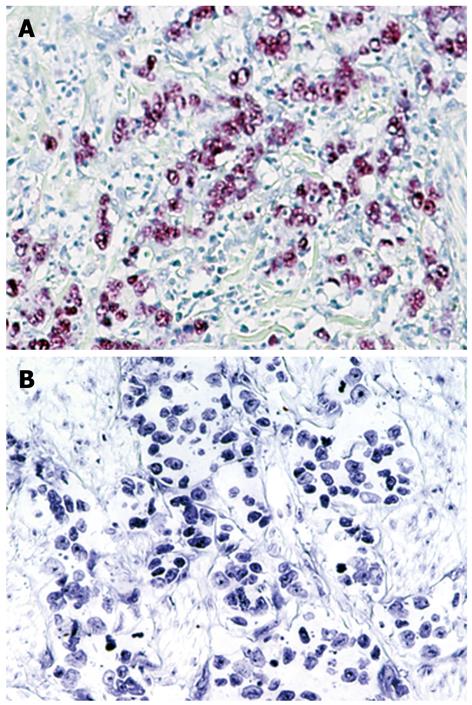
Figure 2 In situ hybridization for EBER-1 in gastric cancer tissues.
A: Gastric adenocarcinoma positive for EBER-1; B: Gastric adenocarcinoma negative for EBER-1. Original magnification, × 200.
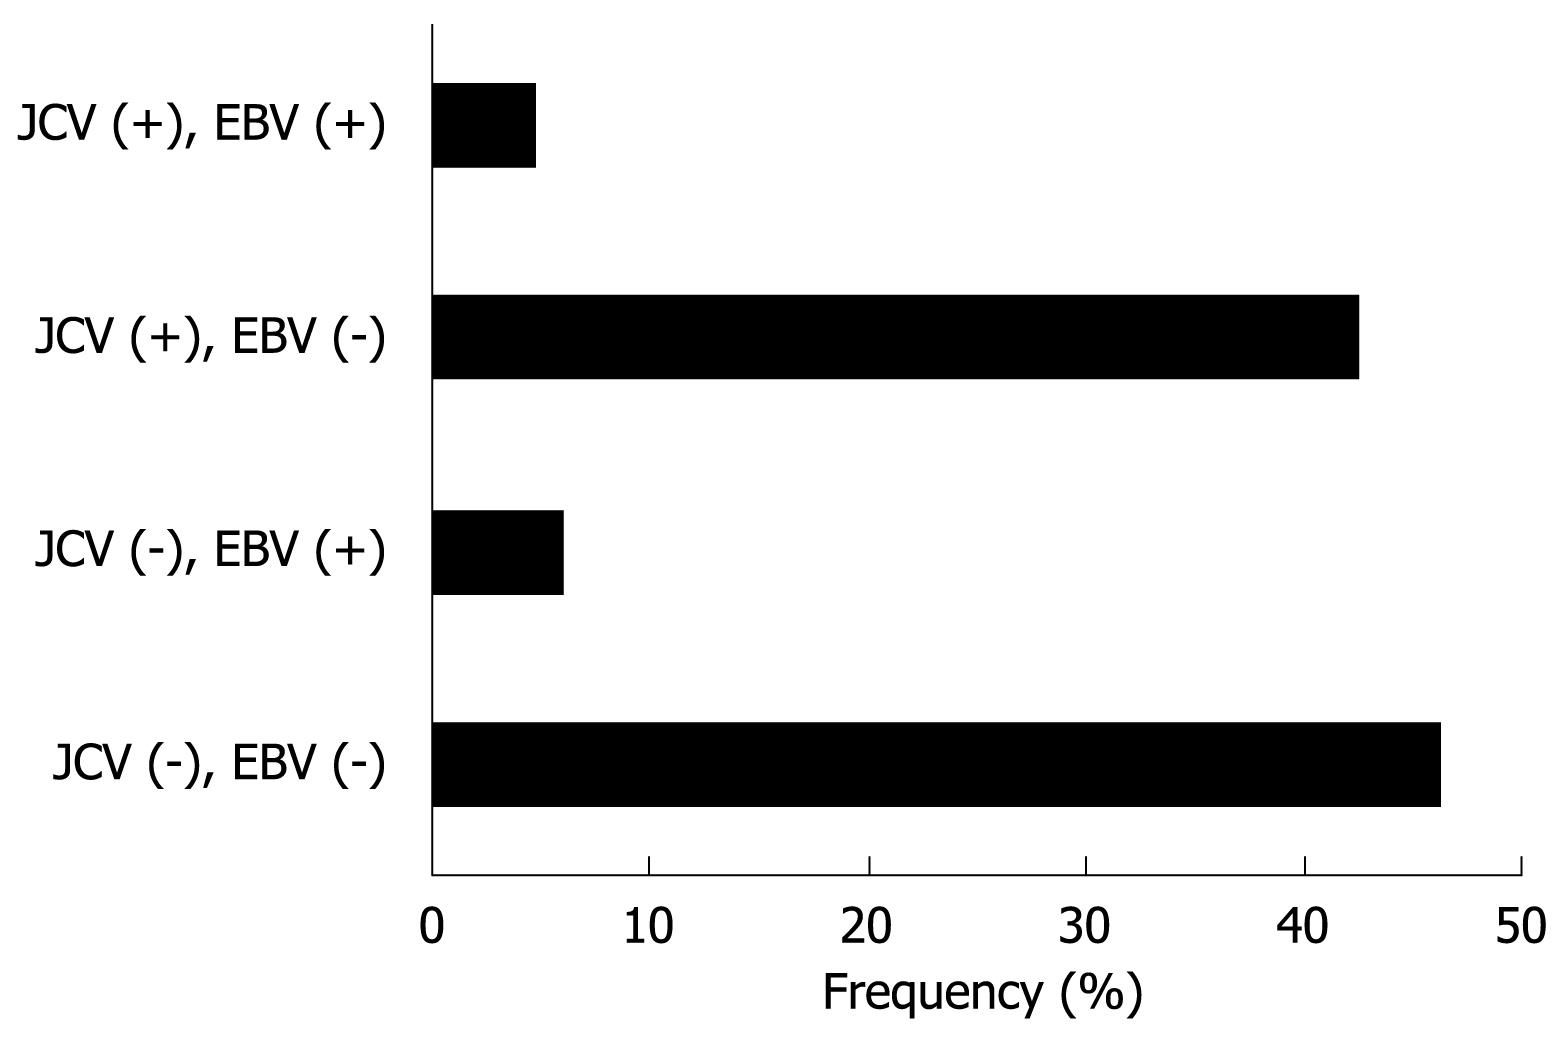
Figure 3 Classification of 90 gastric cancer tissues based on T-Ag protein expression and EBV infection.
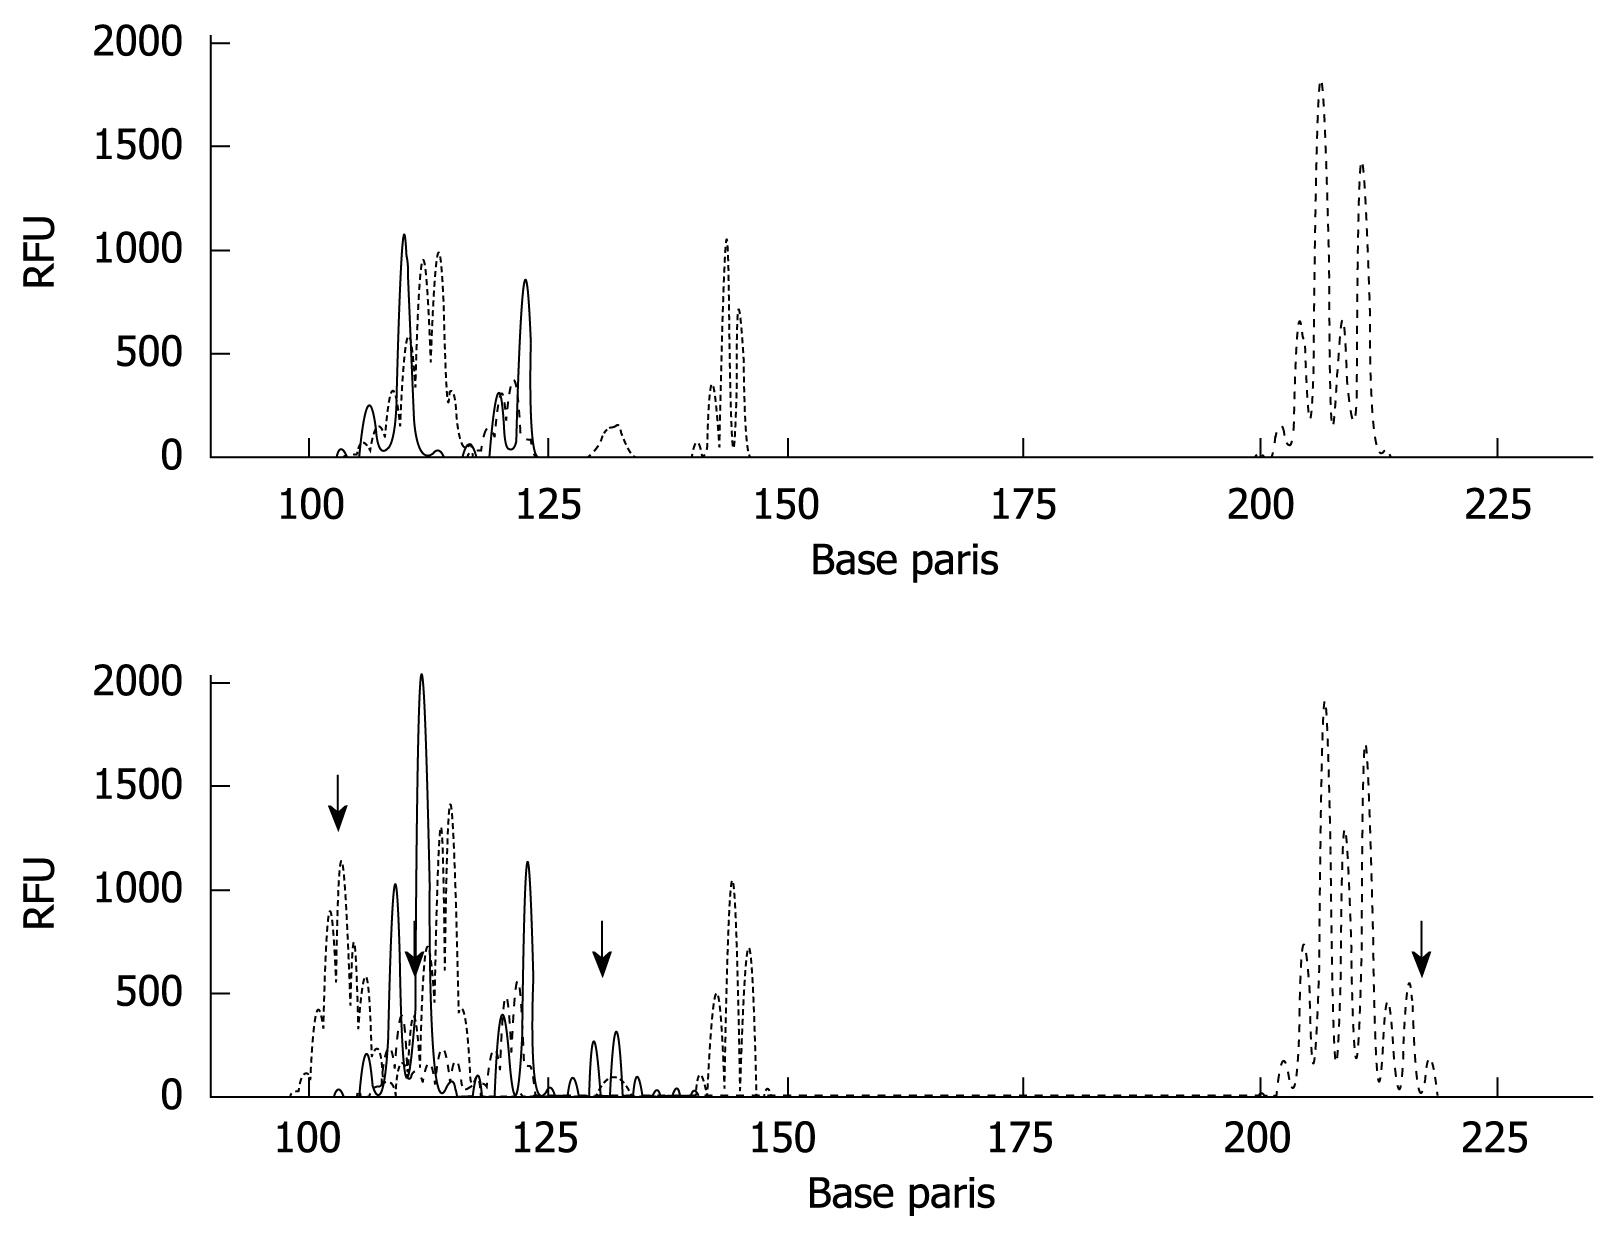
Figure 4 MSI analysis in gastric cancer tissues.
MSI was analyzed by PCR using the mononucleotide (BAT26 and BAT25) and dinucleotide markers (D2S123, D5S346, and D17S250). Results of matched normal (upper panel) and tumor (bottom panel) samples (MSI-H) are shown. The arrows mean instability positive marker. RFU: Relative fluorescent units.
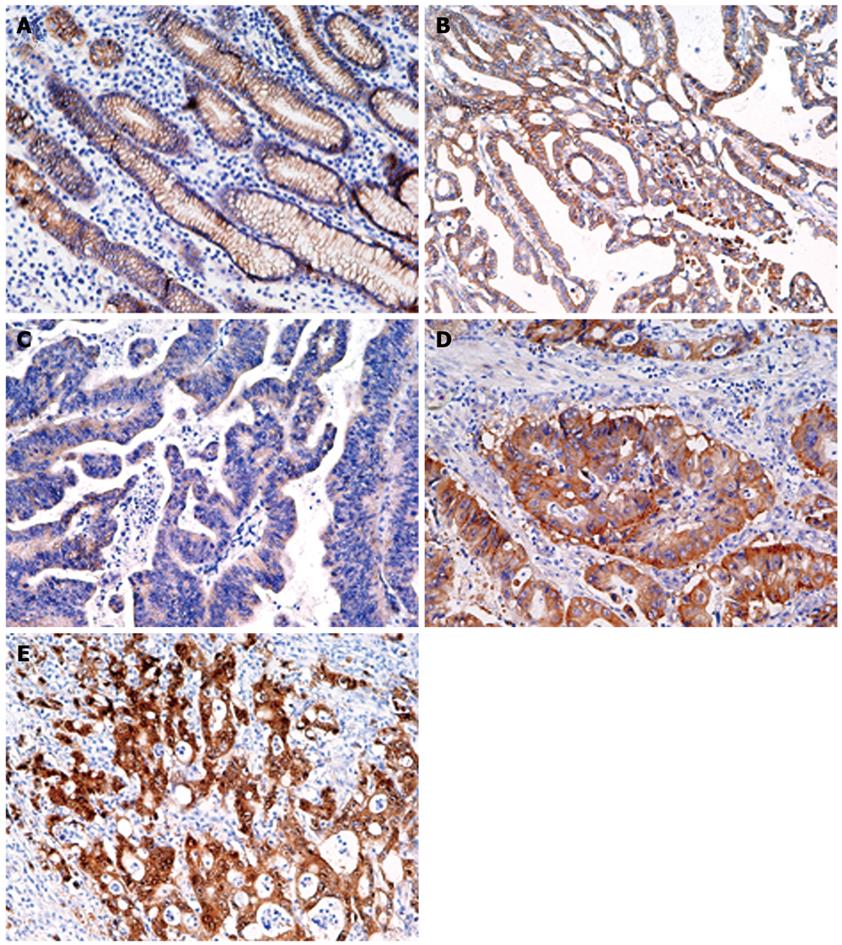
Figure 5 Immunohistochemistry for β-catenin in gastric normal (A) and cancer (B-E) tissues.
A: Moderate membrane staining; B: Membrane staining pattern similar to that seen in normal epithelium; C: Weak staining; D: Diffuse staining in the cytoplasm and membrane; E: Strong staining of the nucleus and cytoplasm (Original magnification, × 200).
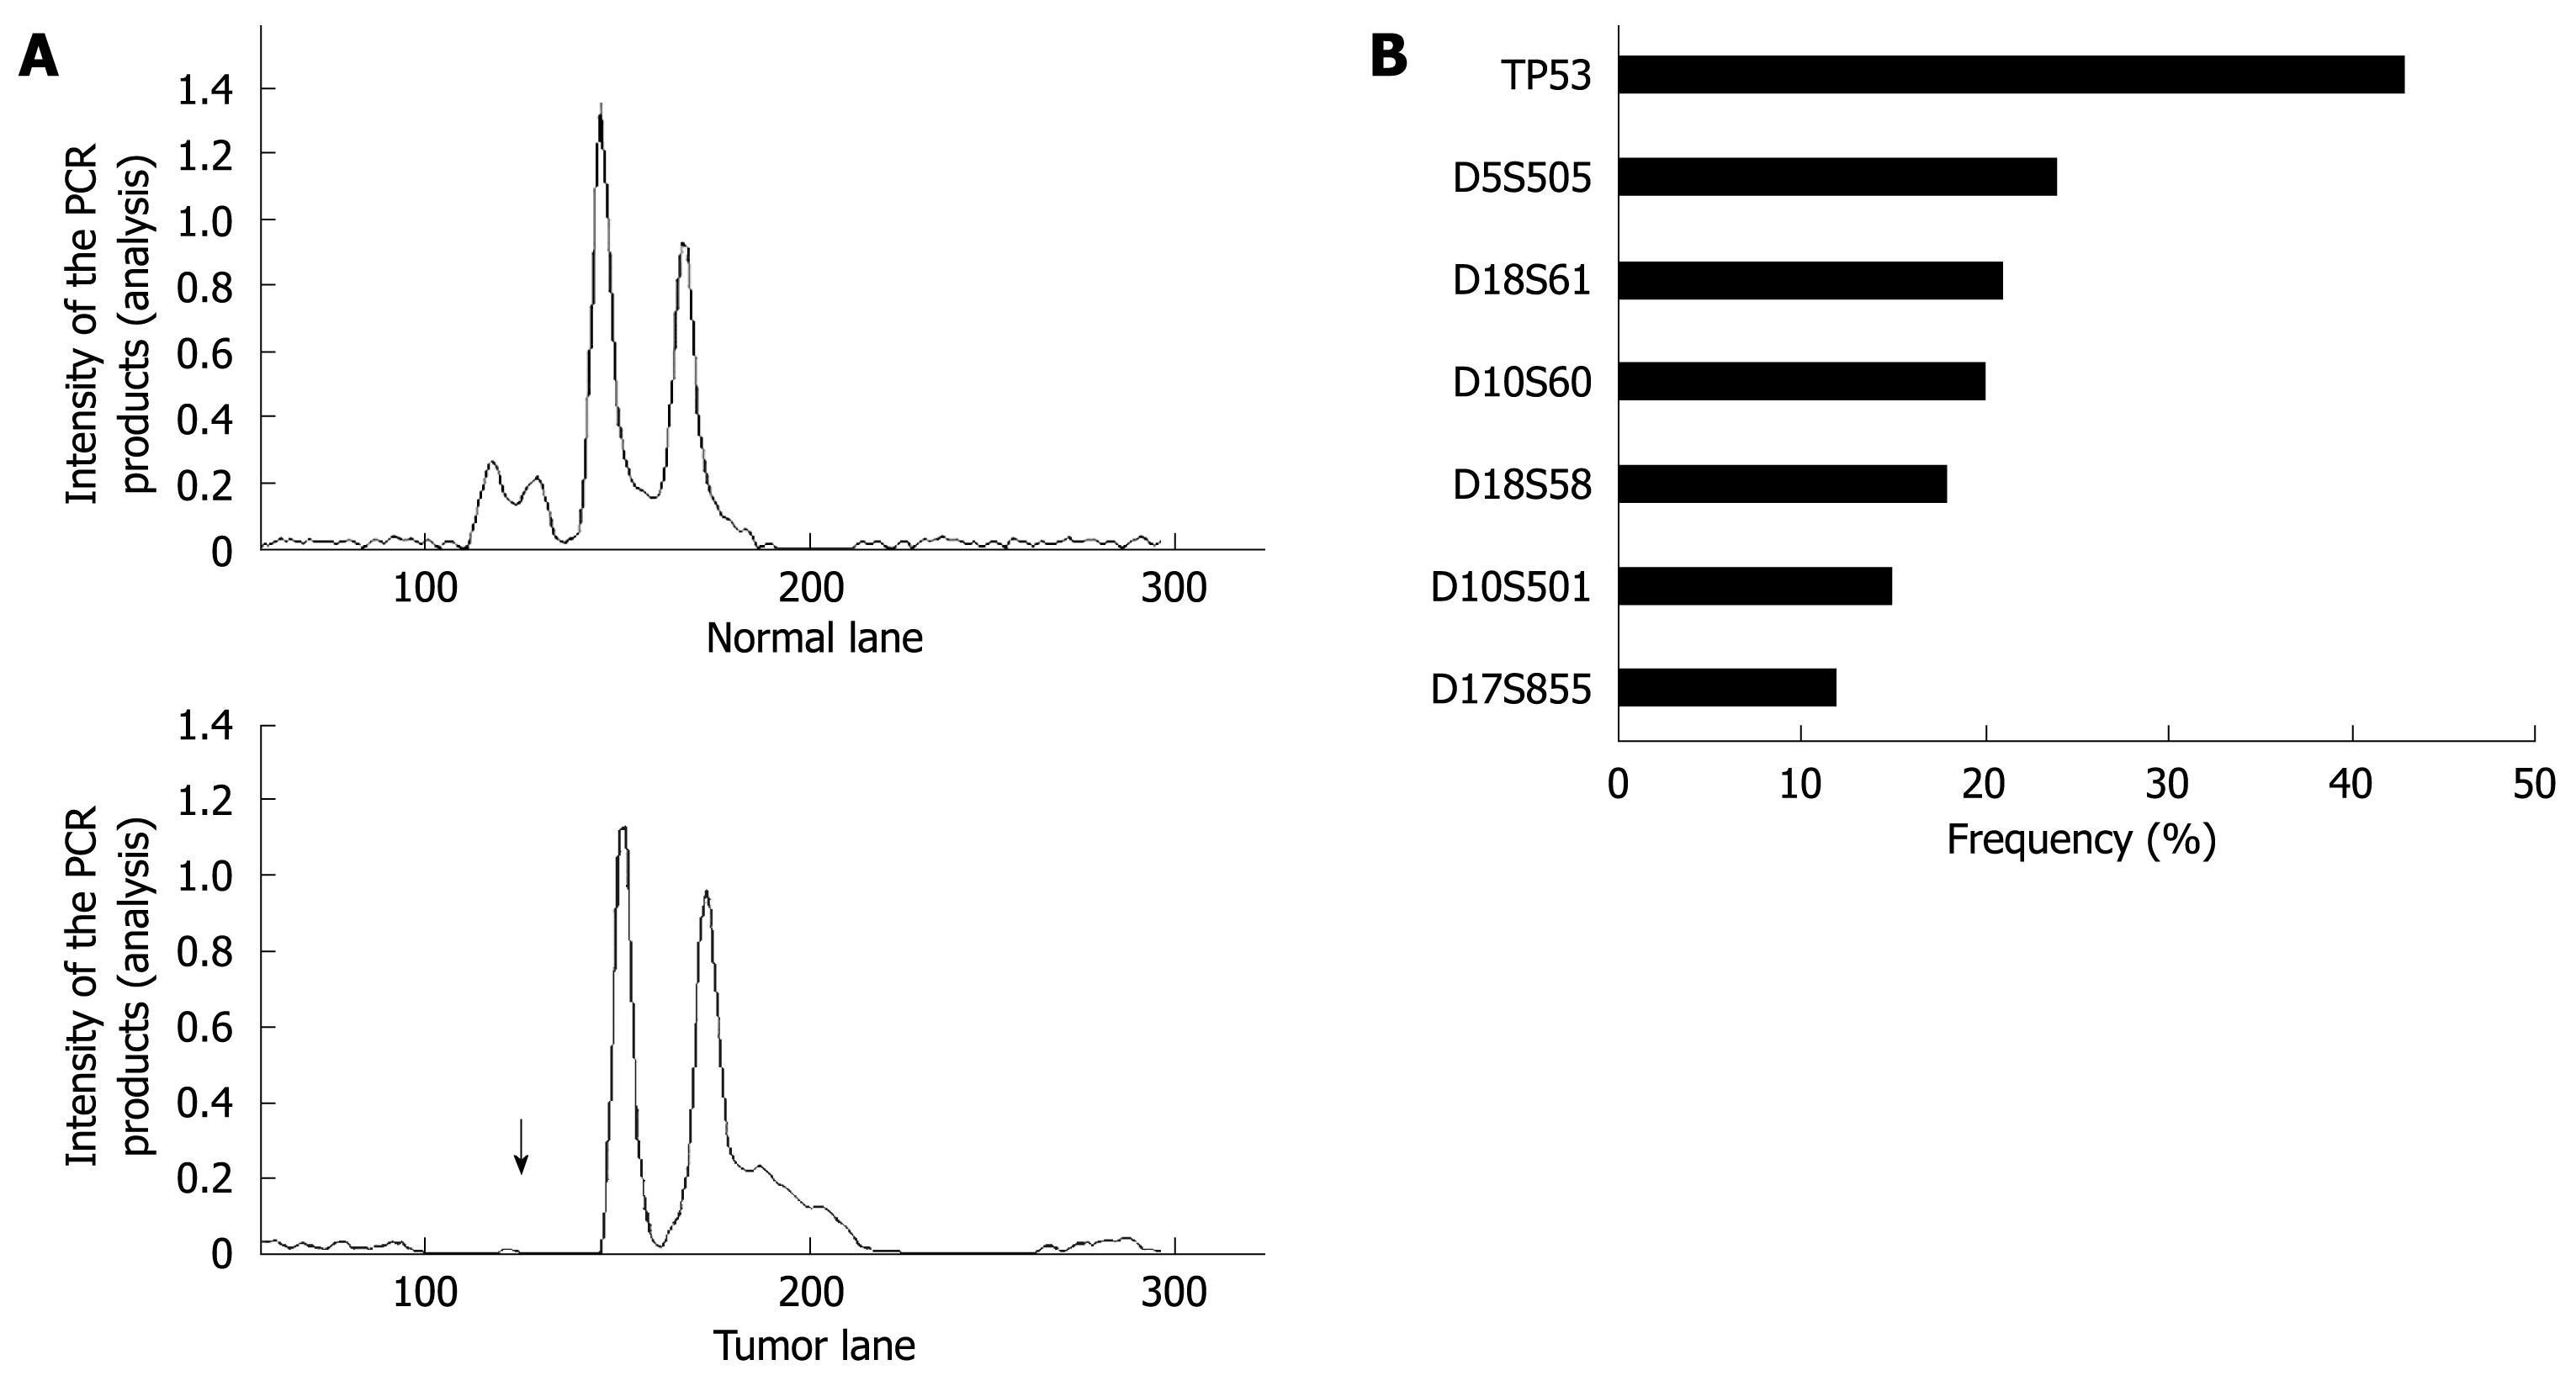
Figure 6 LOH analysis in gastric cancer tissues.
A: A representative example of a tumor with allelic loss in 5q21 (D5S505) is shown. The upper and bottom panels show the intensity plots of both the normal and tumor lane, respectively, demonstrating reduced relative intensity of allele one in the tumor sample (arrow) compared to the corresponding normal sample; B: LOH frequencies based on each individual marker.
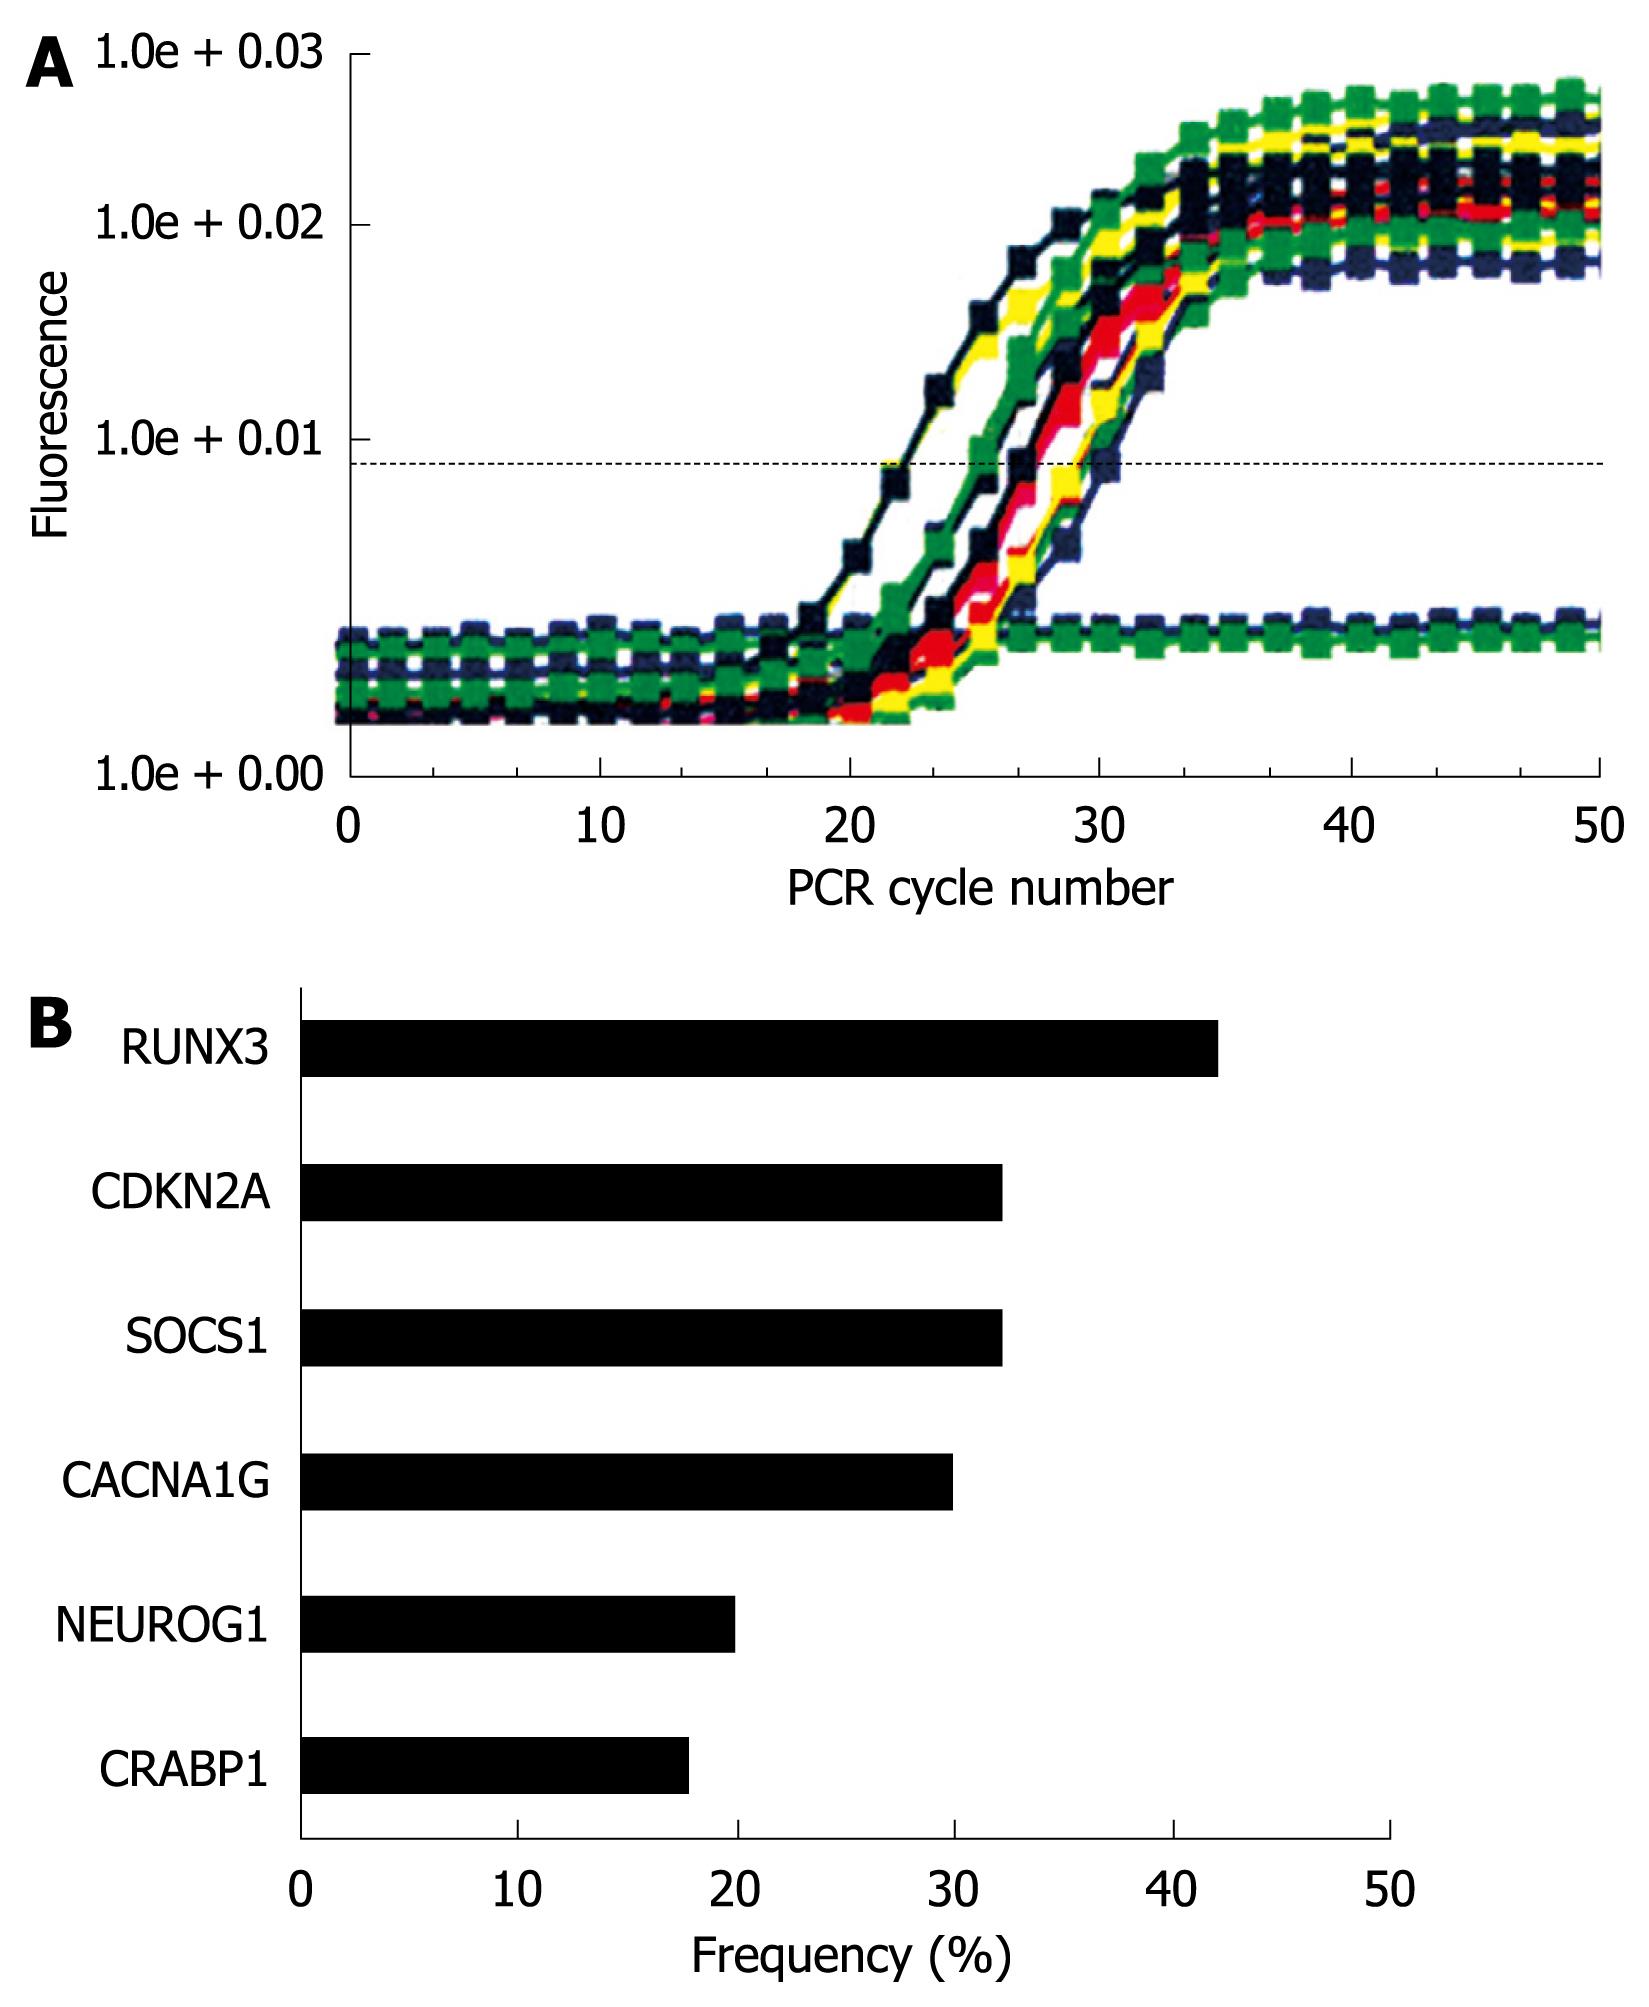
Figure 7 MethyLight analysis in gastric cancer tissues.
A: Results of the CRABP1 gene are shown. Bisulfite-converted DNA was used for quantitative methylation-specific PCR. The amount of hypermethylated DNA was determined by reading the midpoint of the linear portion of the S-shaped real-time curves, called the Ct point or threshold cycle. The Ct refers to the number of cycles it takes a sample to reach a specific fluorescence threshold; B: DNA methylation frequencies based on each individual marker.
- Citation: Yamaoka S, Yamamoto H, Nosho K, Taniguchi H, Adachi Y, Sasaki S, Arimura Y, Imai K, Shinomura Y. Genetic and epigenetic characteristics of gastric cancers with JC virus T-antigen. World J Gastroenterol 2009; 15(44): 5579-5585
- URL: https://www.wjgnet.com/1007-9327/full/v15/i44/5579.htm
- DOI: https://dx.doi.org/10.3748/wjg.15.5579


