Copyright
©2009 The WJG Press and Baishideng.
World J Gastroenterol. Nov 28, 2009; 15(44): 5541-5548
Published online Nov 28, 2009. doi: 10.3748/wjg.15.5541
Published online Nov 28, 2009. doi: 10.3748/wjg.15.5541
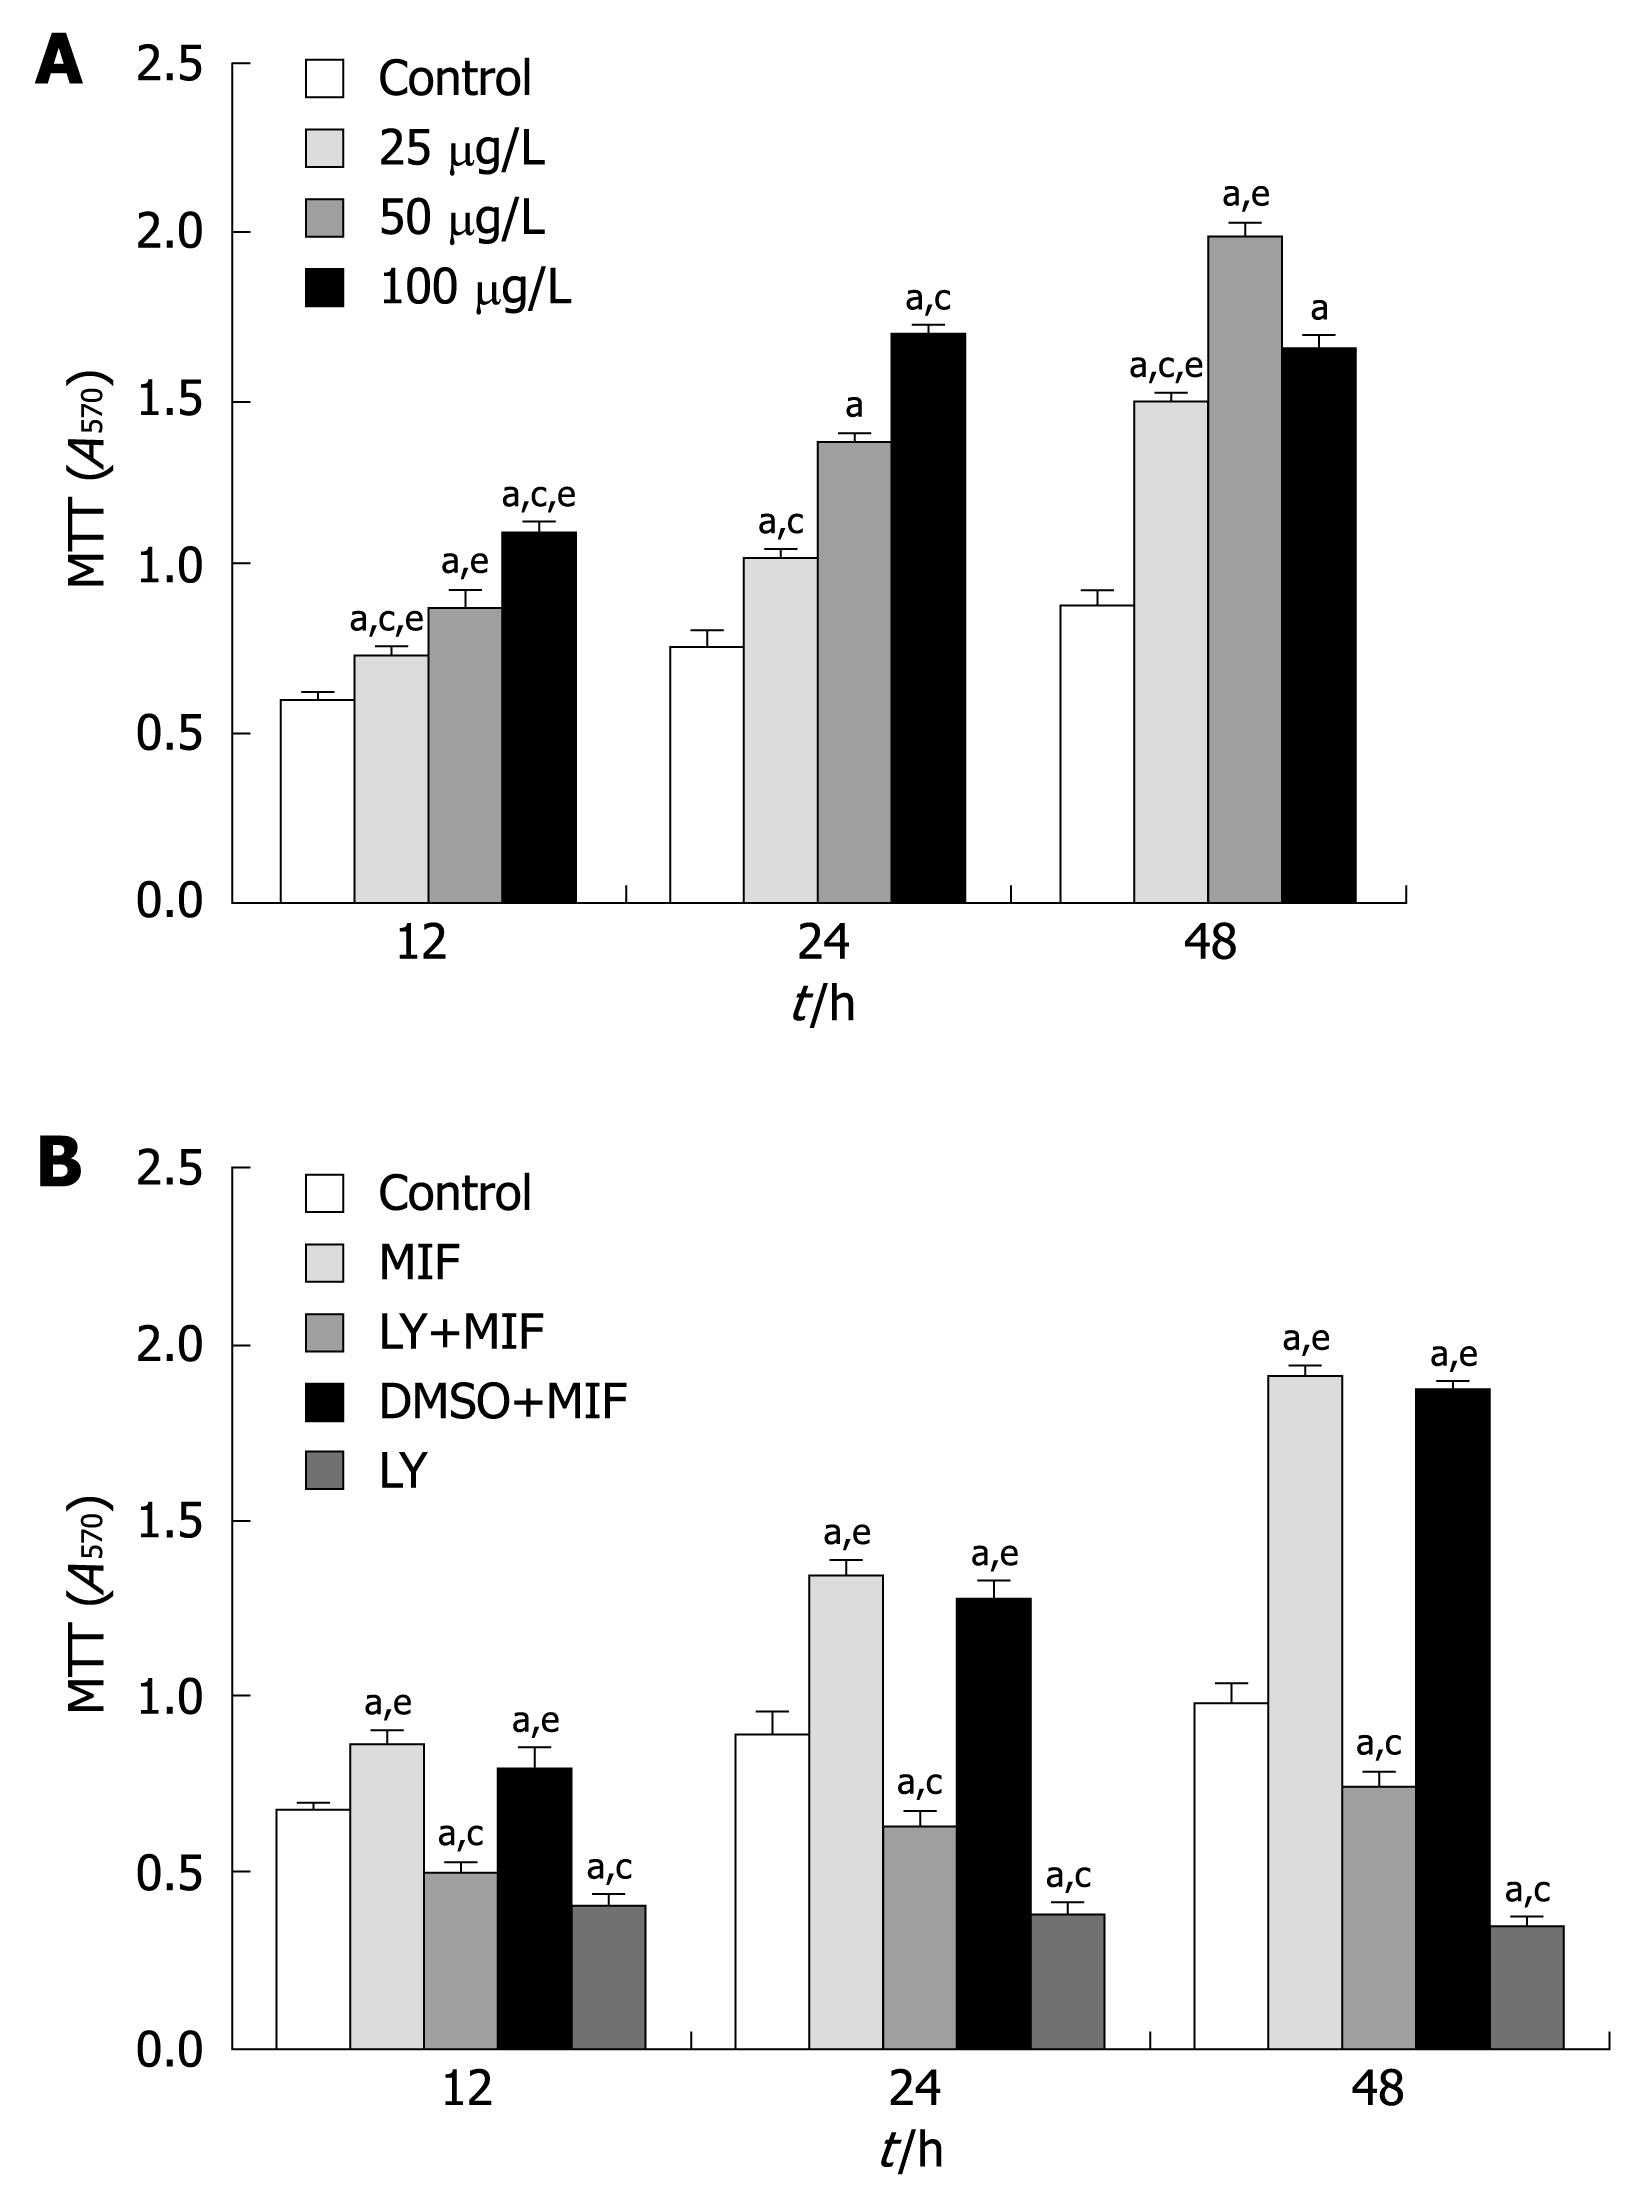
Figure 1 Effects of recombinant human migration inhibitory factor (rhMIF) and LY294002 on the proliferation of MGC-803 cells.
A: MGC-803 cells were treated with 25, 50 and 100 μg/L rhMIF for the indicated periods of time and cell proliferation was examined by MTT assay. aP < 0.05 vs control group; cP < 0.05 vs 50 μg/L MIF group; eP < 0.05 vs 24 h group; B: With or without 1-h pretreatment with 25 μmol/L LY294002, MGC-803 cells were exposed to 50 μg/L rhMIF for the indicated periods of time, with a vehicle control of dimethyl sulfoxide (DMSO) (less than 0.1%) included. aP < 0.05 vs control group; cP < 0.05 vs MIF group; eP < 0.05 vs LY+MIF group. Data were represented as mean ± SD of three independent experiments. DMSO (the menstruum of LY294002, less than 0.1%) had little impact on the rhMIF effect.
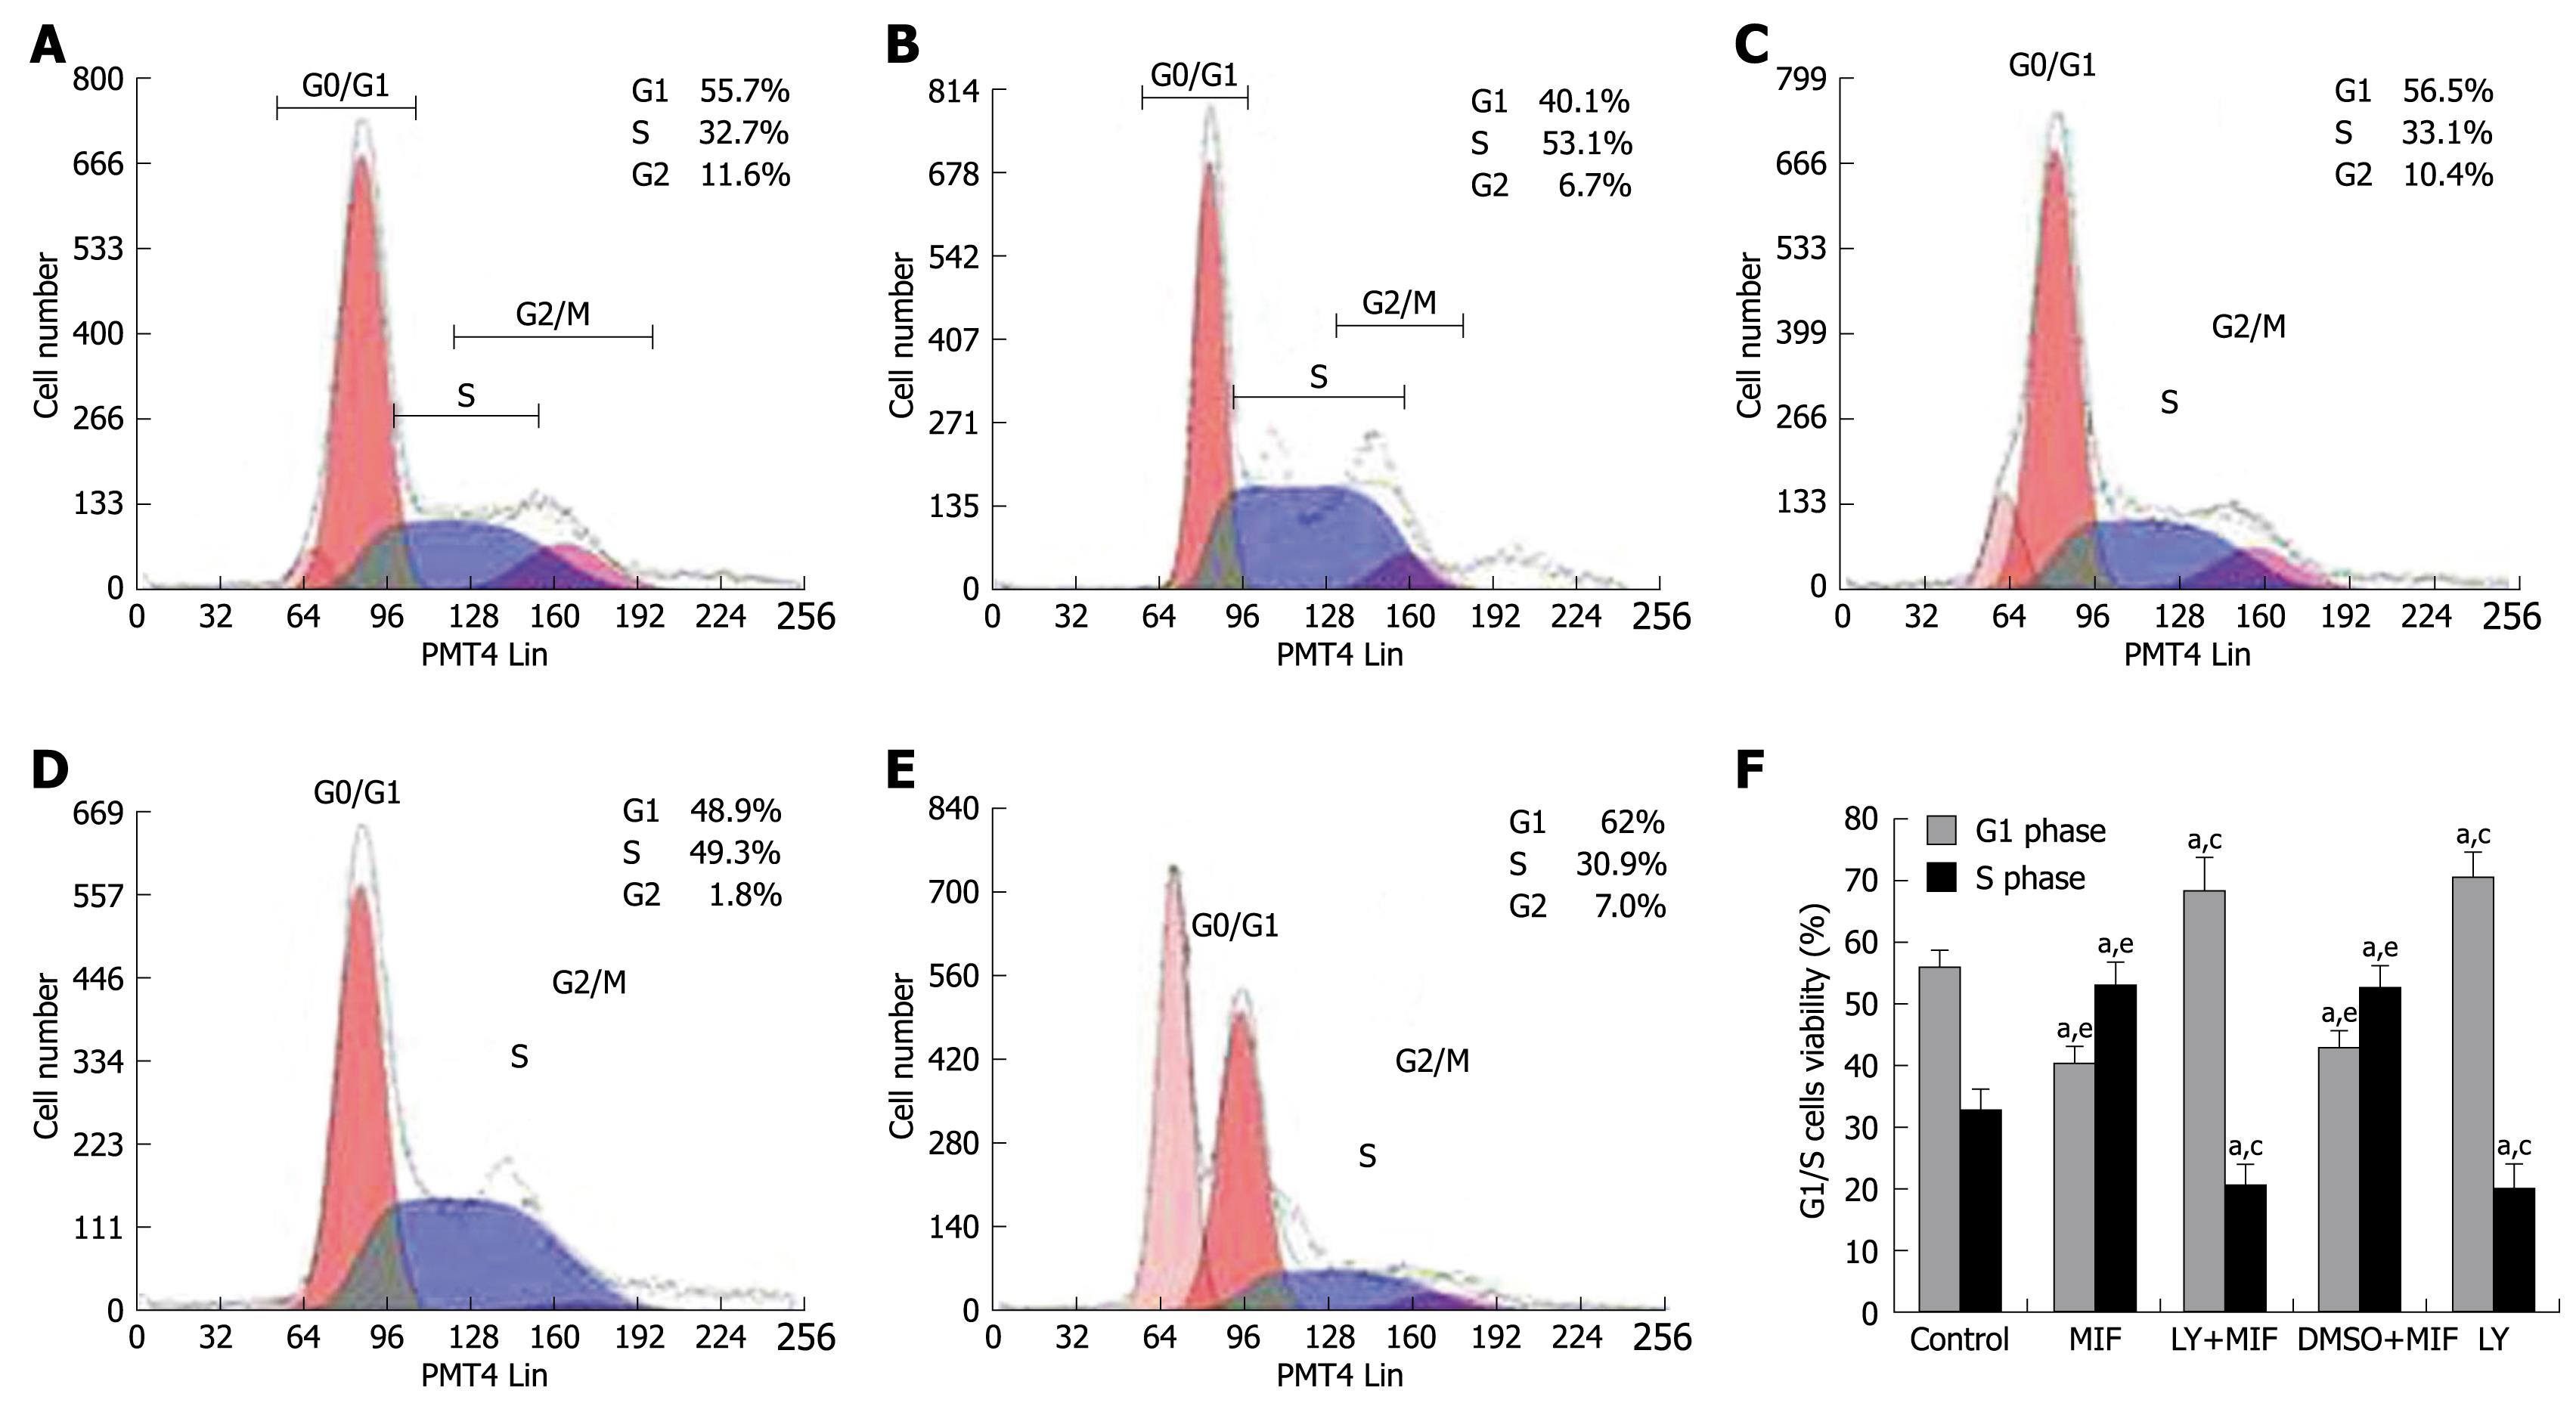
Figure 2 Effects of rhMIF and LY294002 on cell cycle of MGC-803 cells.
With or without 1-h pretreatment with 25 μmol/l LY294002, MGC-803 cells were exposed to 50 μg/L rhMIF for 24 h. A vehicle control of DMSO (less than 0.1%) was included. Cell lysates were prepared for the cell cycle detection. The cell cycle distribution was analyzed using an Eics-XL II flow cytometer. A: Control; B: MIF group; C: LY+MIF group; D: DMSO+MIF group; E: LY group; F: Quantification of G1/S viability(%) analysis of MGC-803 cells. Data were represented as mean ± SD of three independent experiments. aP < 0.05 vs control group; cP < 0.05 vs MIF group; eP < 0.05 vs LY+MIF group. DMSO (the menstruum of LY294002, less than 0.1%) had little impact on the rhMIF effect.
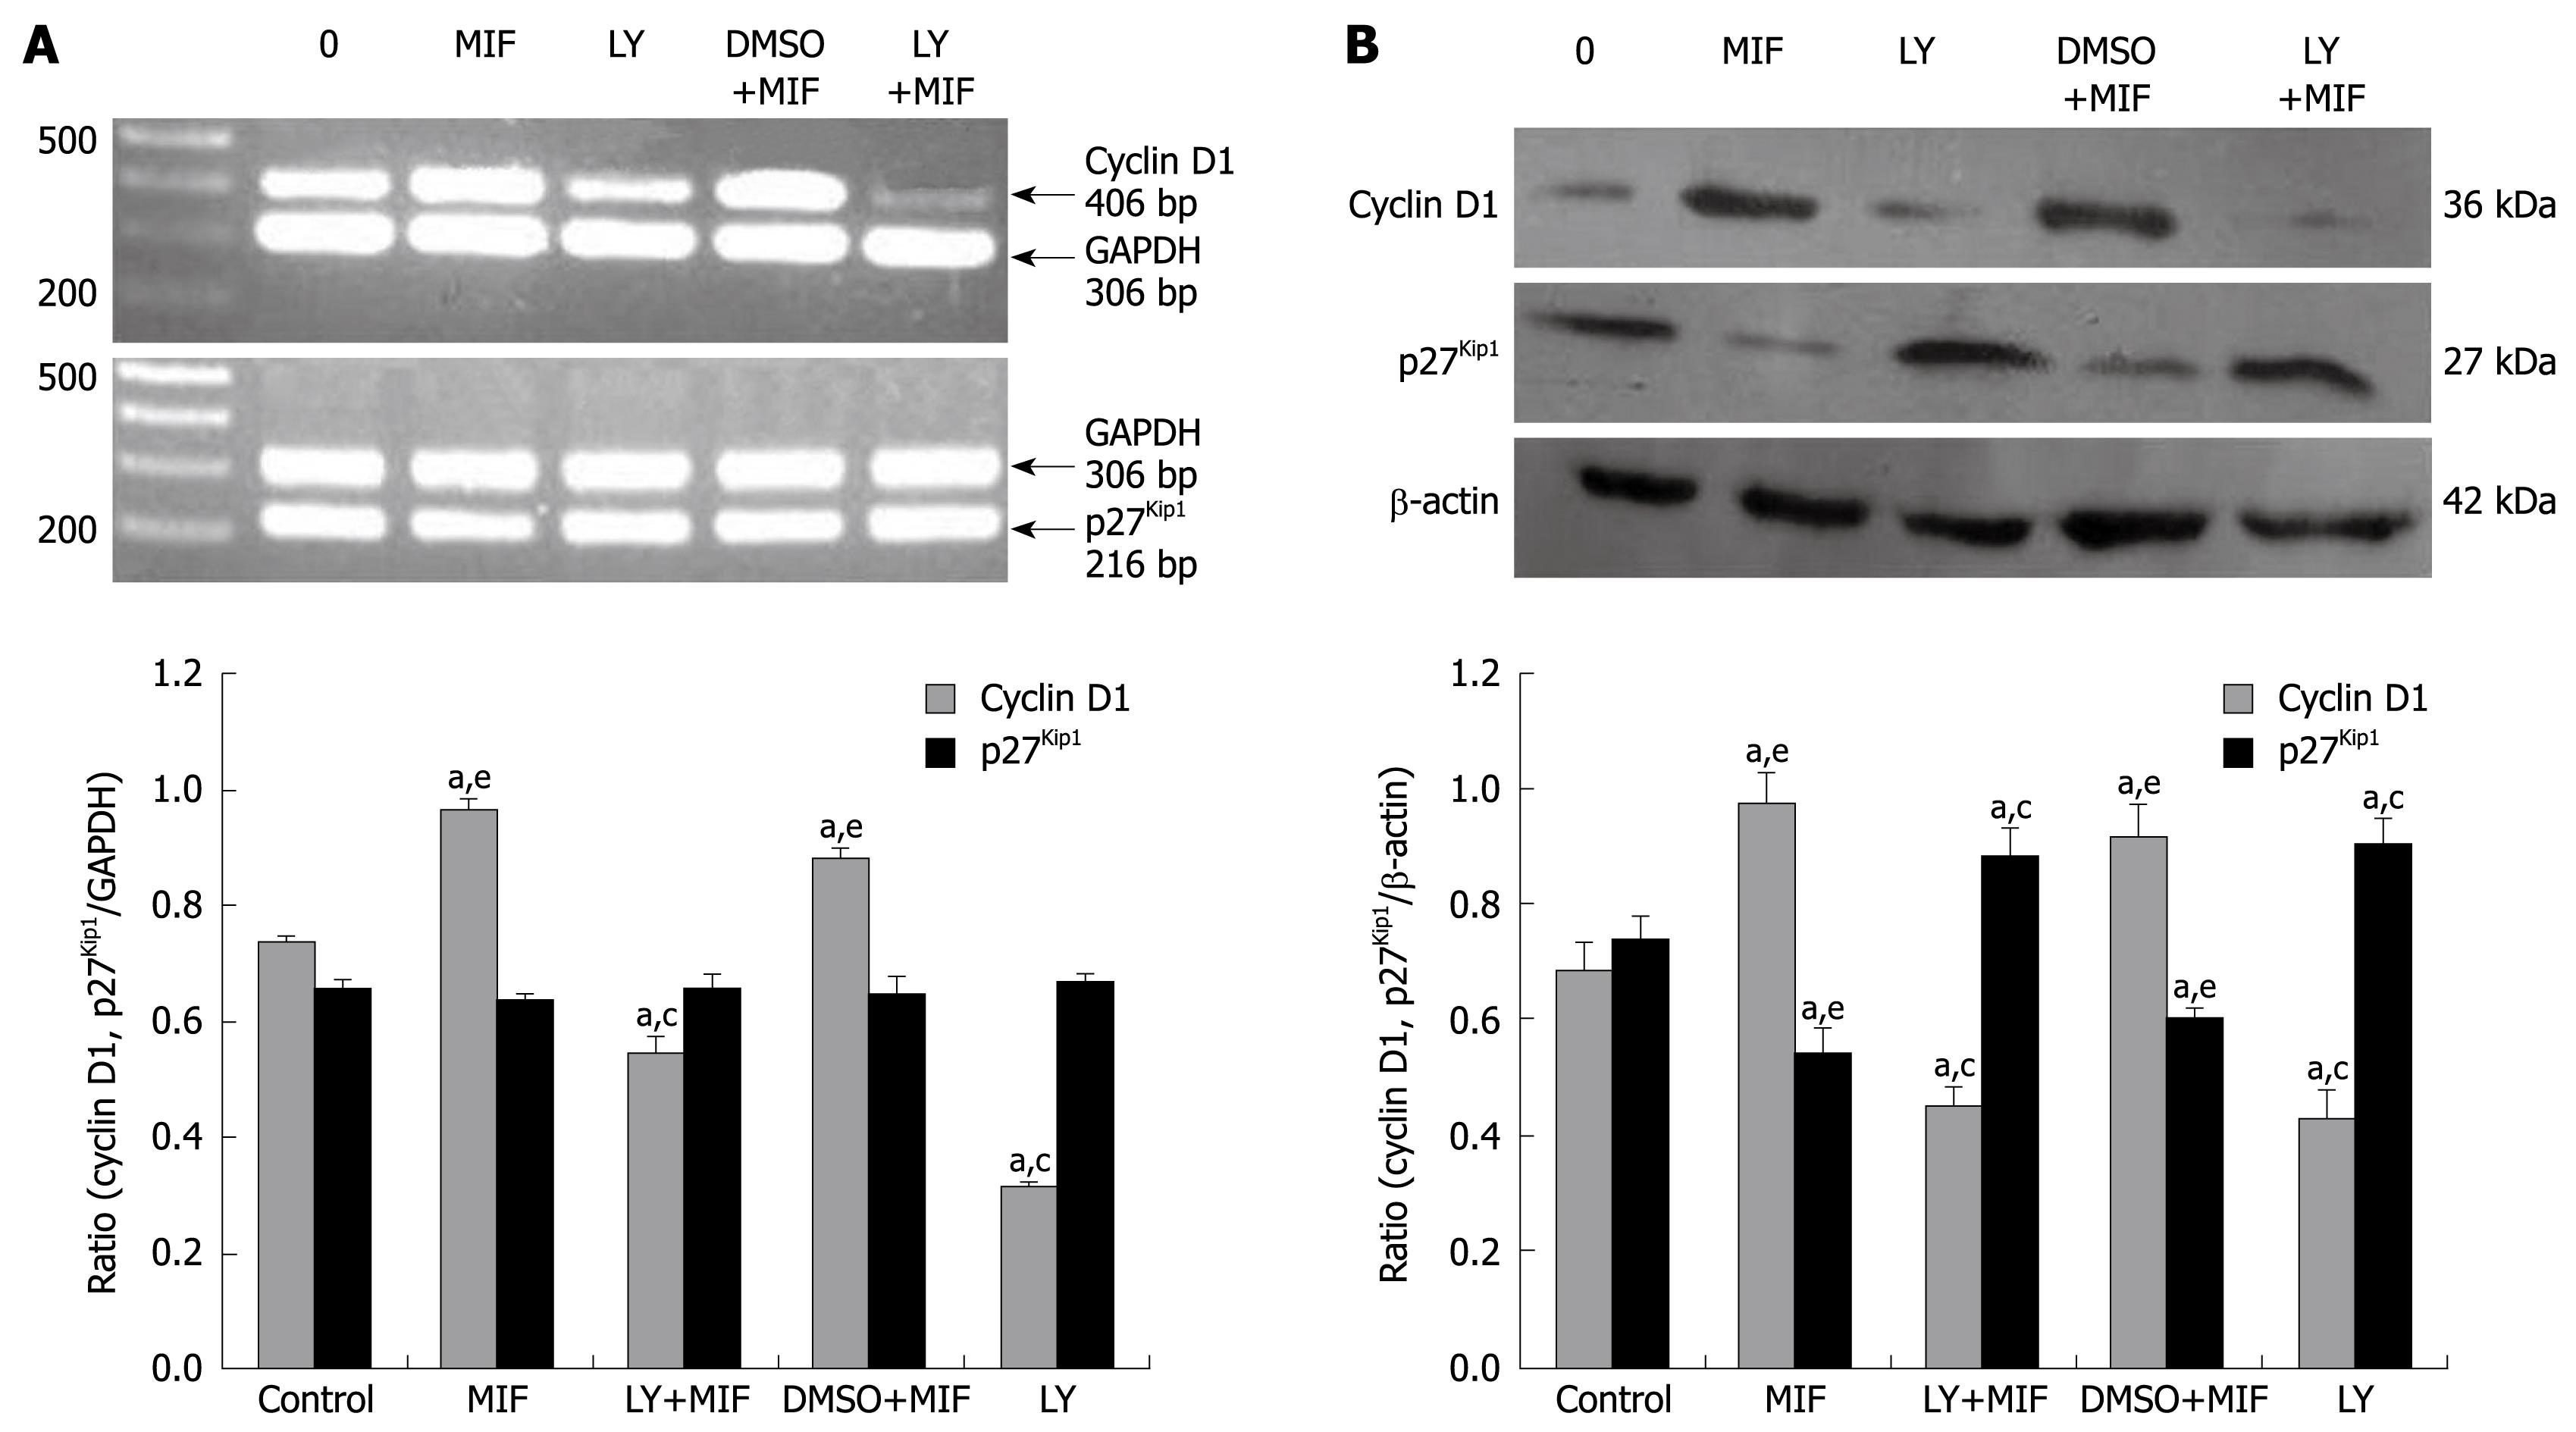
Figure 3 Effects of rhMIF and LY294002 on the expression of cyclin D1 and p27kip1 in MGC-803 cells.
With or without 1-h pretreatment with 25 μmol/L LY294002, MGC-803 cells were exposed to 50 μg/L rhMIF for 24 h. A vehicle control of DMSO (less than 0.1%) was included. A: RT-PCR; B: Western blotting. The results were represented as mean ± SD of three independent experiments. aP < 0.05 vs control group; cP < 0.05 vs MIF group; eP < 0.05 vs LY+MIF group. DMSO (the menstruum of LY294002, less than 0.1%) had little impact on the rhMIF effect.
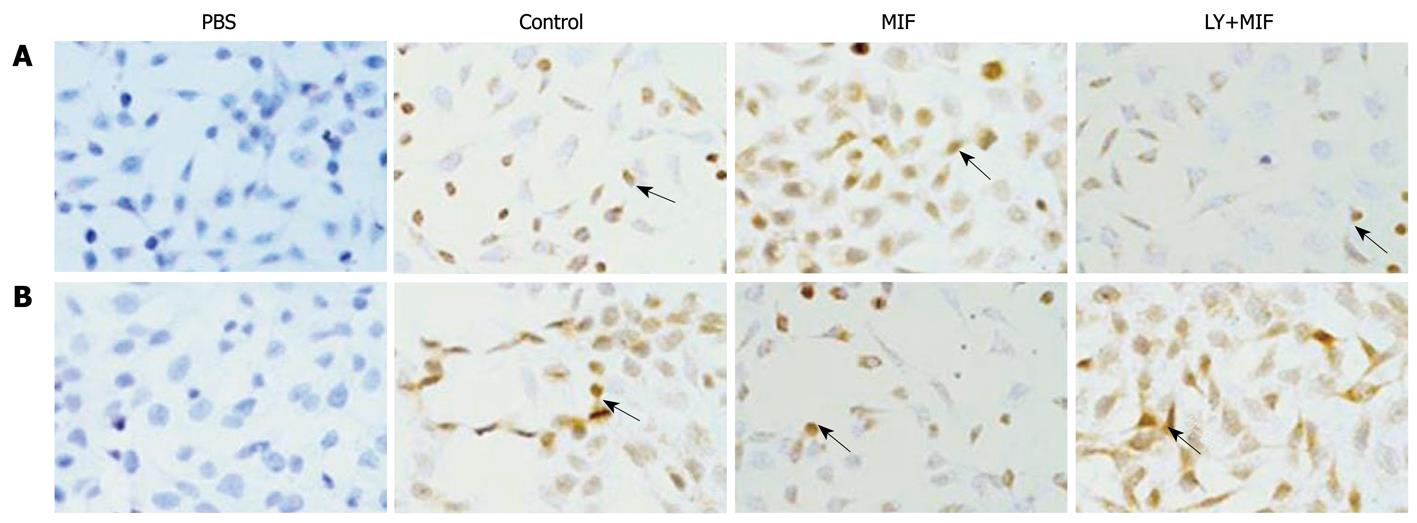
Figure 4 Effects of rhMIF and LY294002 on the translocation of cyclin D1 (A) and p27kip1 (B) in MGC-803 cells.
With or without 1-h pretreatment with 25 μmol/L LY294002, MGC-803 cells were exposed to 50 μg/L rhMIF for 24 h. The arrow symbols represent immunocytochemical staining for nuclear and cytoplasmic expression of cyclin D1 (Original magnification, × 200) and p27kip1 (Original magnification, × 200) in MGC-803. PBS: Phosphate buffered saline.
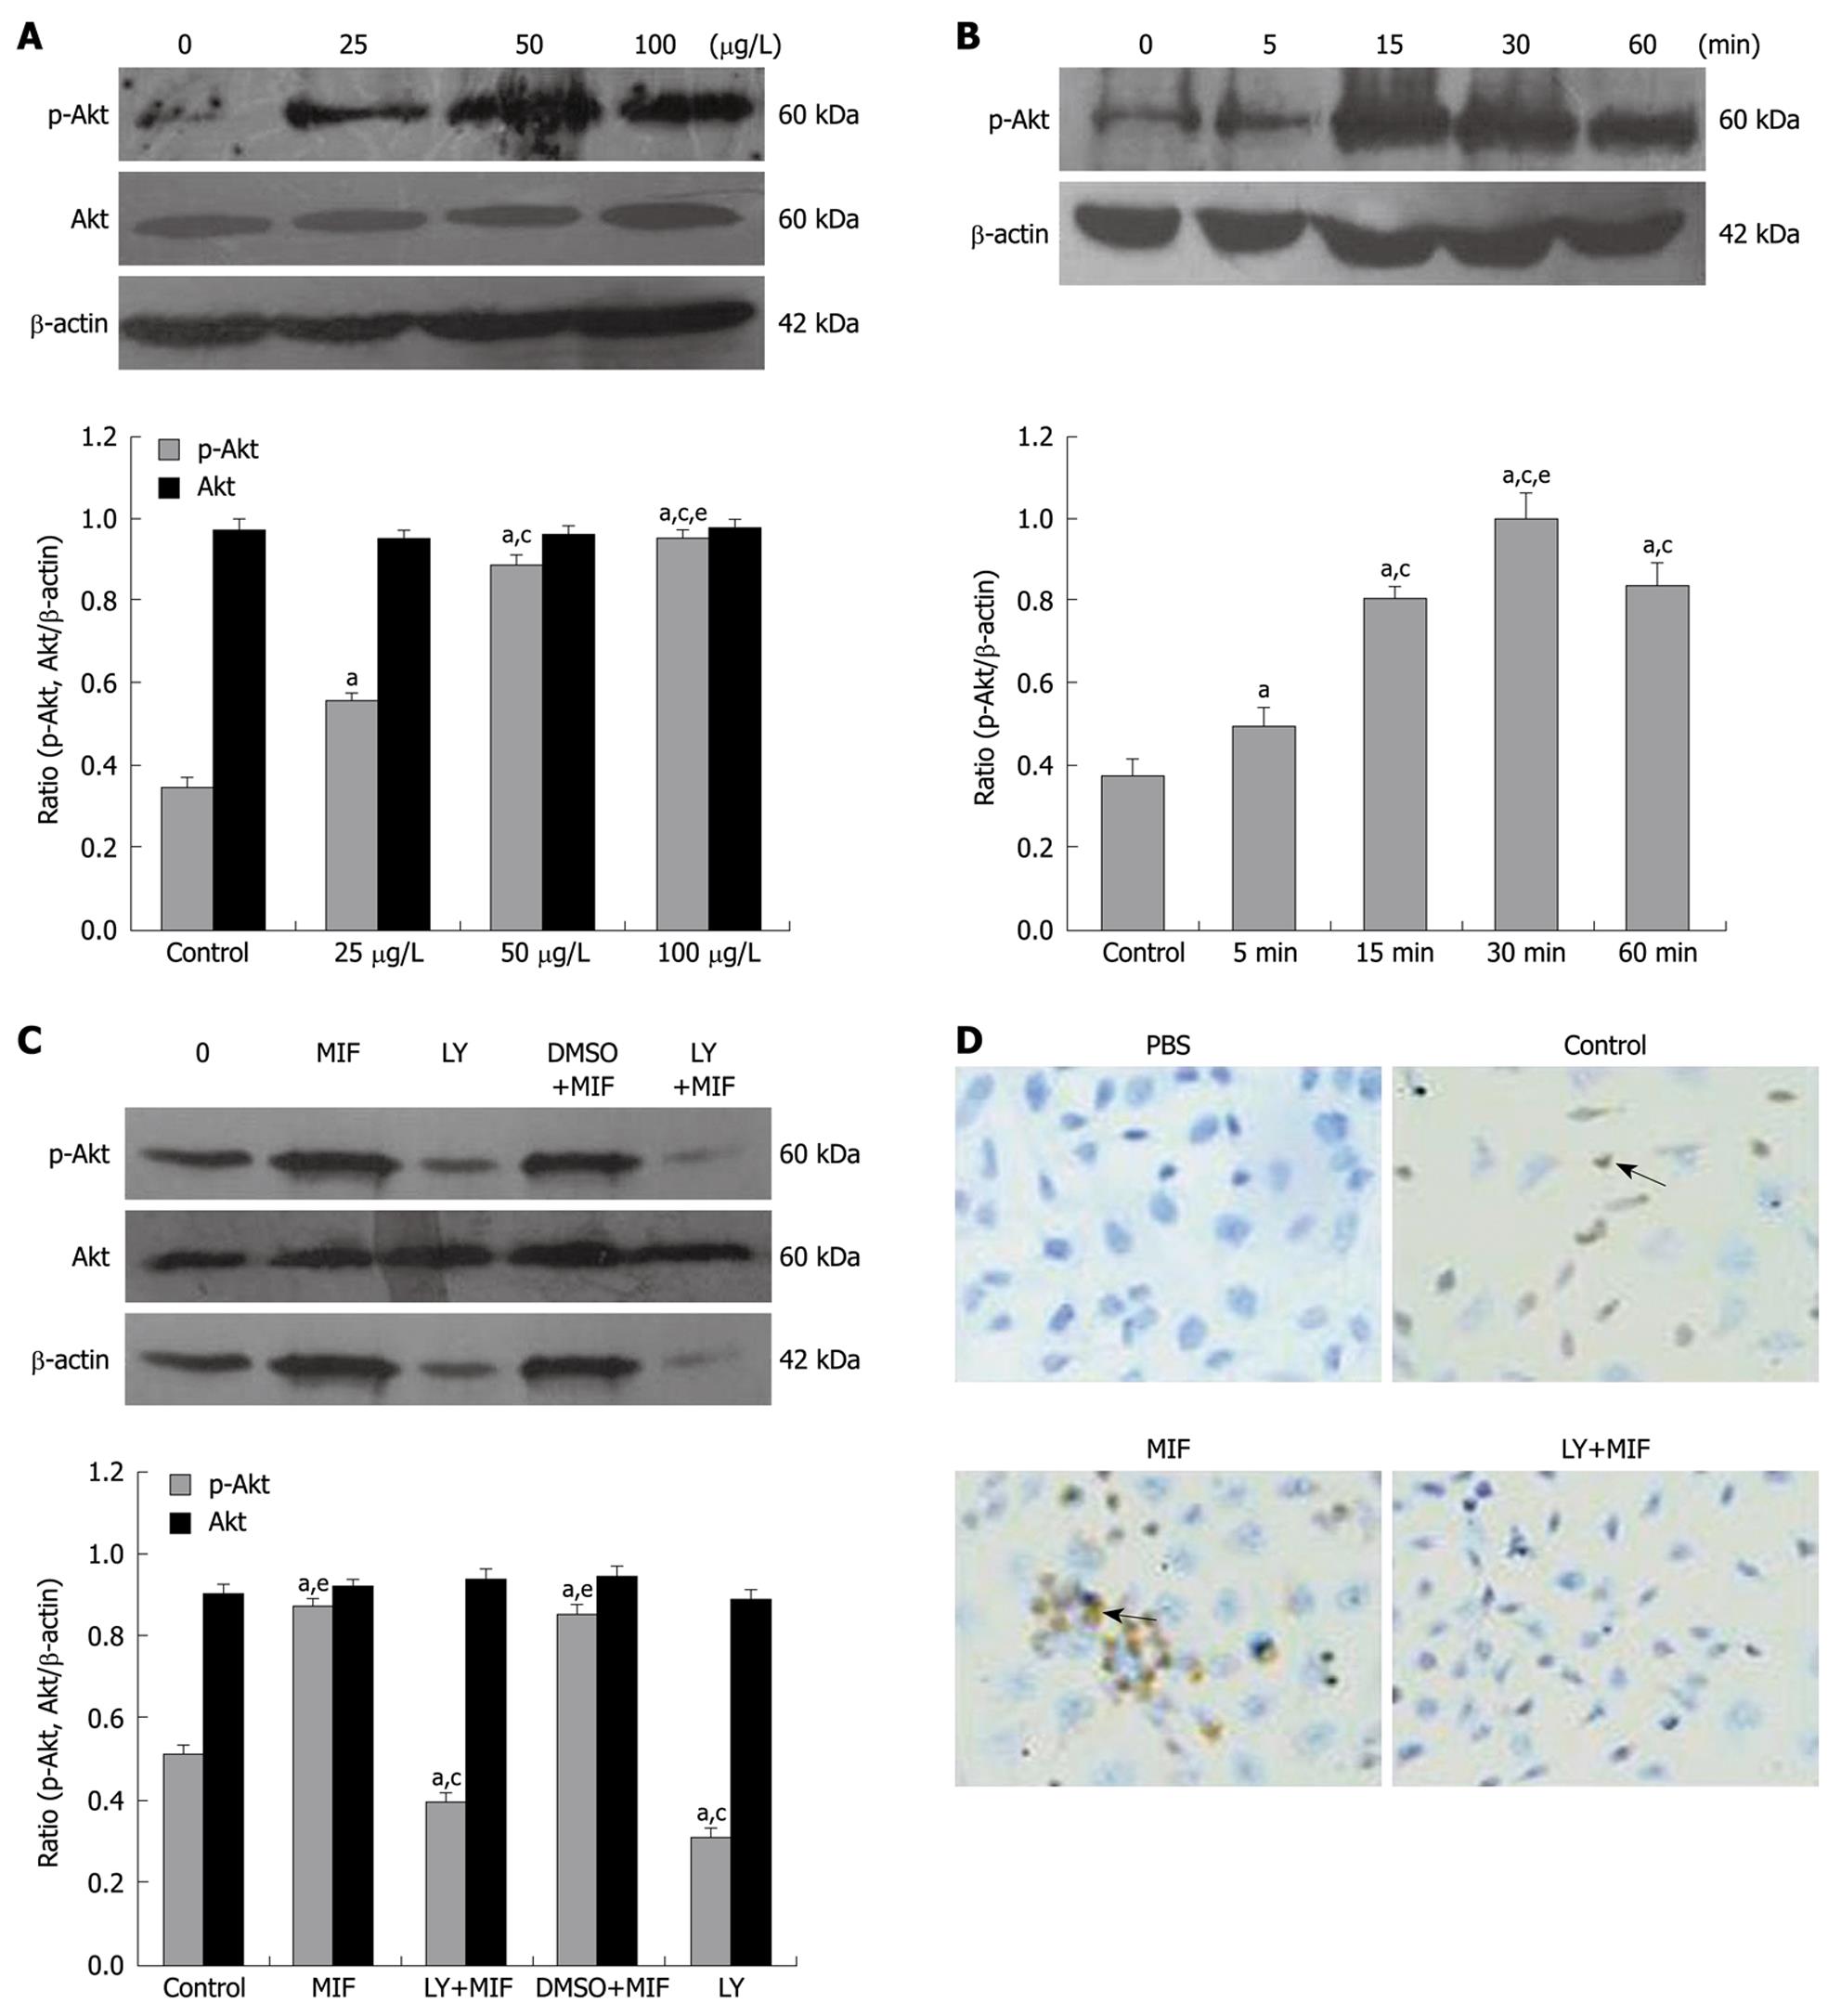
Figure 5 Effects of rhMIF on the expression of p-Akt and Akt in MGC-803 cells.
Cell lysates were isolated for Western blotting to detect the expression of p-Akt and Akt (A, B). A: MGC-803 cells were treated with 25, 50 and 100 μg/L rhMIF for 30 min. aP < 0.05 vs control group; cP < 0.05 vs 25 μg/L MIF group; eP < 0.05 vs 50 μg/L MIF group; B: MGC-803 cells were treated with 50 μg/L rhMIF at different time points (5, 15, 30 and 60 min). aP < 0.05 vs control group; cP < 0.05 vs 5 min group; eP < 0.05 vs 15 min and 60 min groups; C: With or without 1-h pretreatment with 25 μmol/L LY294002, MGC-803 cells were exposed to 50 μg/L rhMIF for 30 min with a vehicle control of DMSO (less than 0.1%) included, and then the expression of p-Akt and Akt was determined by Western blotting. aP < 0.05 vs control group; cP < 0.05 vs MIF group; eP < 0.05 vs LY+MIF group; D: The arrow symbols represent immunocytochemical staining for nuclear and cytoplasmic expression of p-Akt (original magnification, × 200) in MGC-803 cells. The results were represent as mean ± SD of three independent experiments. DMSO (the menstruum of LY294002, less than 0.1%) had little impact on the rhMIF effect.
-
Citation: Li GQ, Xie J, Lei XY, Zhang L. Macrophage migration inhibitory factor regulates proliferation of gastric cancer cells
via the PI3K/Akt pathway. World J Gastroenterol 2009; 15(44): 5541-5548 - URL: https://www.wjgnet.com/1007-9327/full/v15/i44/5541.htm
- DOI: https://dx.doi.org/10.3748/wjg.15.5541


