Copyright
©2009 The WJG Press and Baishideng.
World J Gastroenterol. Nov 28, 2009; 15(44): 5525-5532
Published online Nov 28, 2009. doi: 10.3748/wjg.15.5525
Published online Nov 28, 2009. doi: 10.3748/wjg.15.5525
Figure 1 Diagram of patients with liver biopsy for CHC in the University Hospital Bucharest during the 18-mo study period.
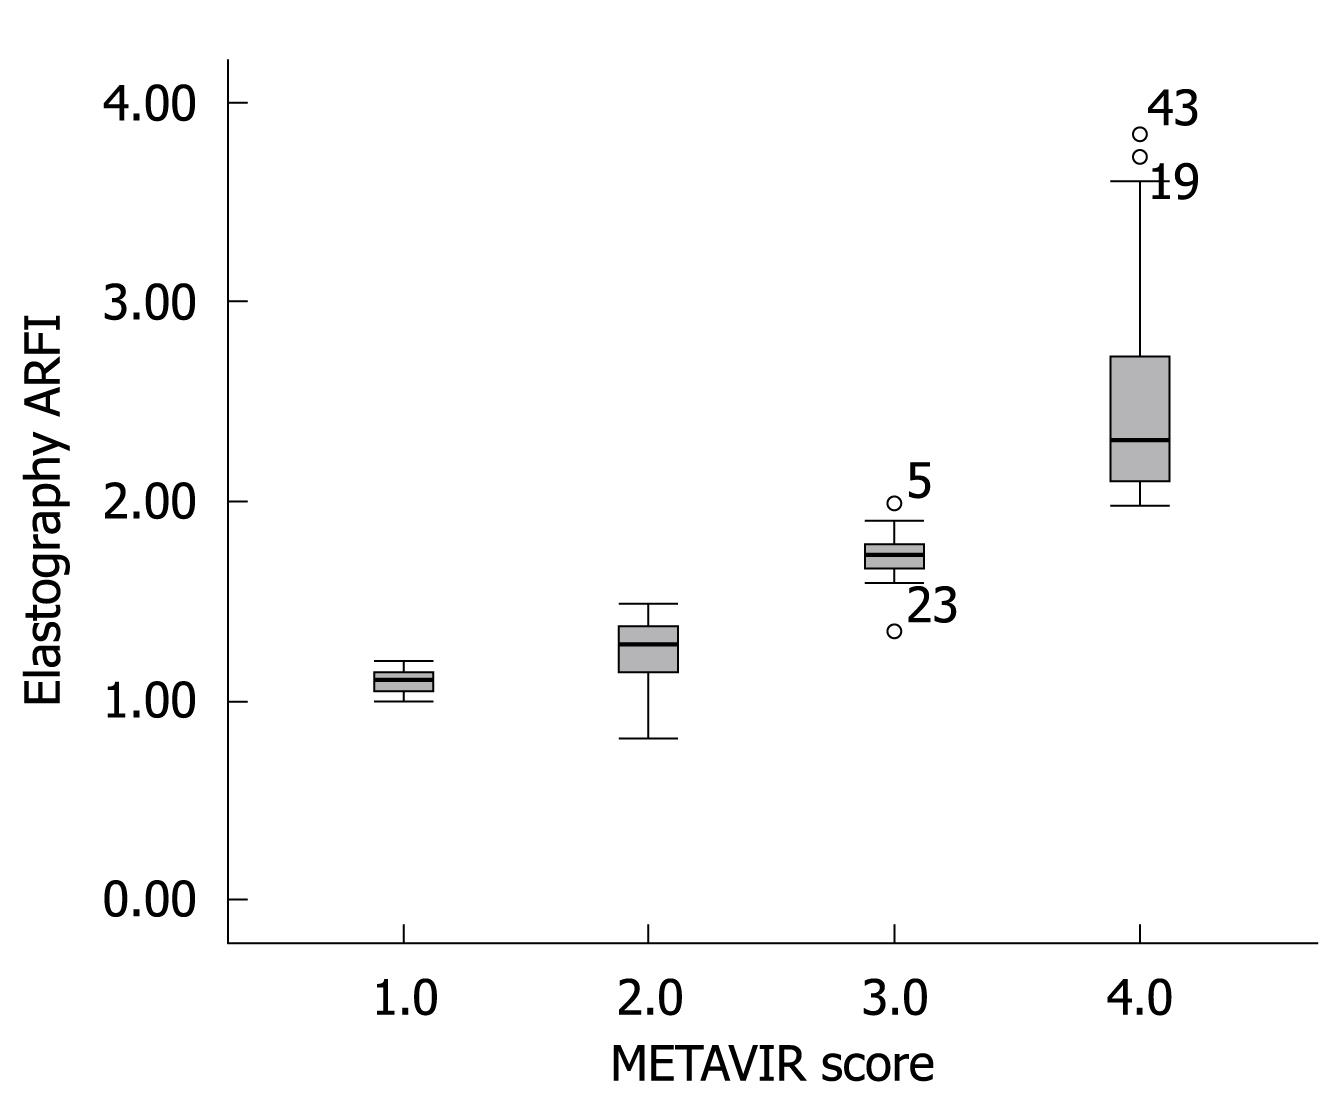
Figure 2 Box plot of METAVIR score and ARFI elastography.
Top and bottom of boxes represent first and third quartiles, respectively. Length of box represents interquartile range within which 50% of values are located. Thick line through each box represents the median. Error bars mark minimum and maximum values (range). Small circles represent outliers. Skewed data for fibrosis stage 0/1 can be explained by the small number of patients in this group.
Figure 3 ROC curves: elastography predicting ≥ F2 fibrosis, ≥ F3 fibrosis and F4 fibrosis.
Figure 4 Cutoff points for degrees of fibrosis.
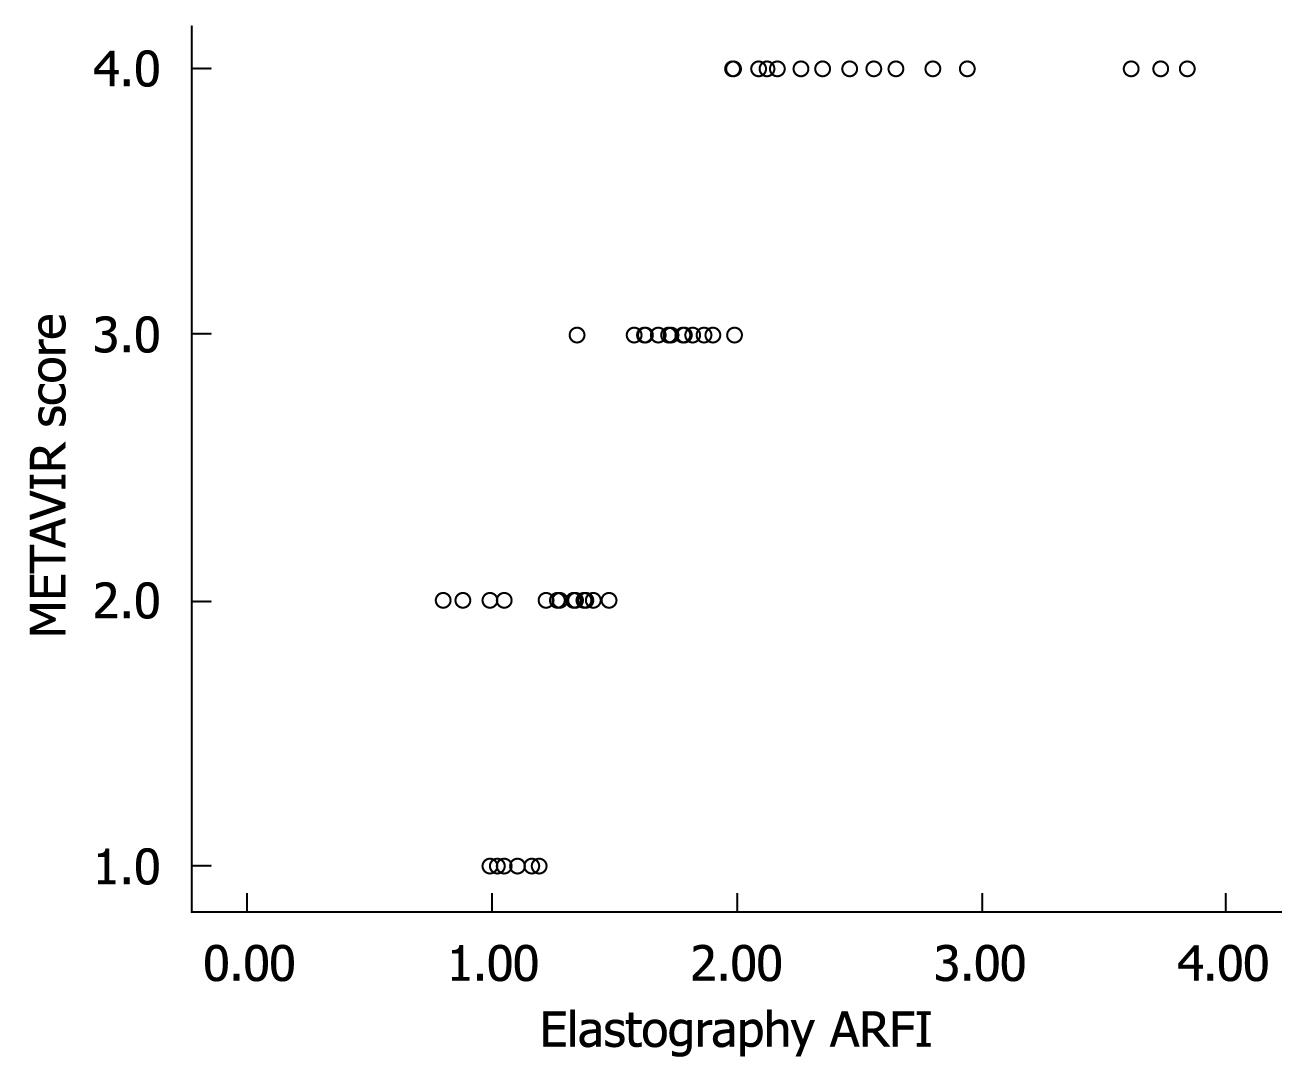
Figure 5 Correlation between METAVIR and ARFI elastography.
Correlation between METAVIR and ARFI elastography showed that the overlap between stages F1 and F2 fibrosis limits the discriminatory value of the test in this context.
- Citation: Fierbinteanu-Braticevici C, Andronescu D, Usvat R, Cretoiu D, Baicus C, Marinoschi G. Acoustic radiation force imaging sonoelastography for noninvasive staging of liver fibrosis. World J Gastroenterol 2009; 15(44): 5525-5532
- URL: https://www.wjgnet.com/1007-9327/full/v15/i44/5525.htm
- DOI: https://dx.doi.org/10.3748/wjg.15.5525


