Copyright
©2009 The WJG Press and Baishideng.
World J Gastroenterol. Oct 28, 2009; 15(40): 5020-5027
Published online Oct 28, 2009. doi: 10.3748/wjg.15.5020
Published online Oct 28, 2009. doi: 10.3748/wjg.15.5020
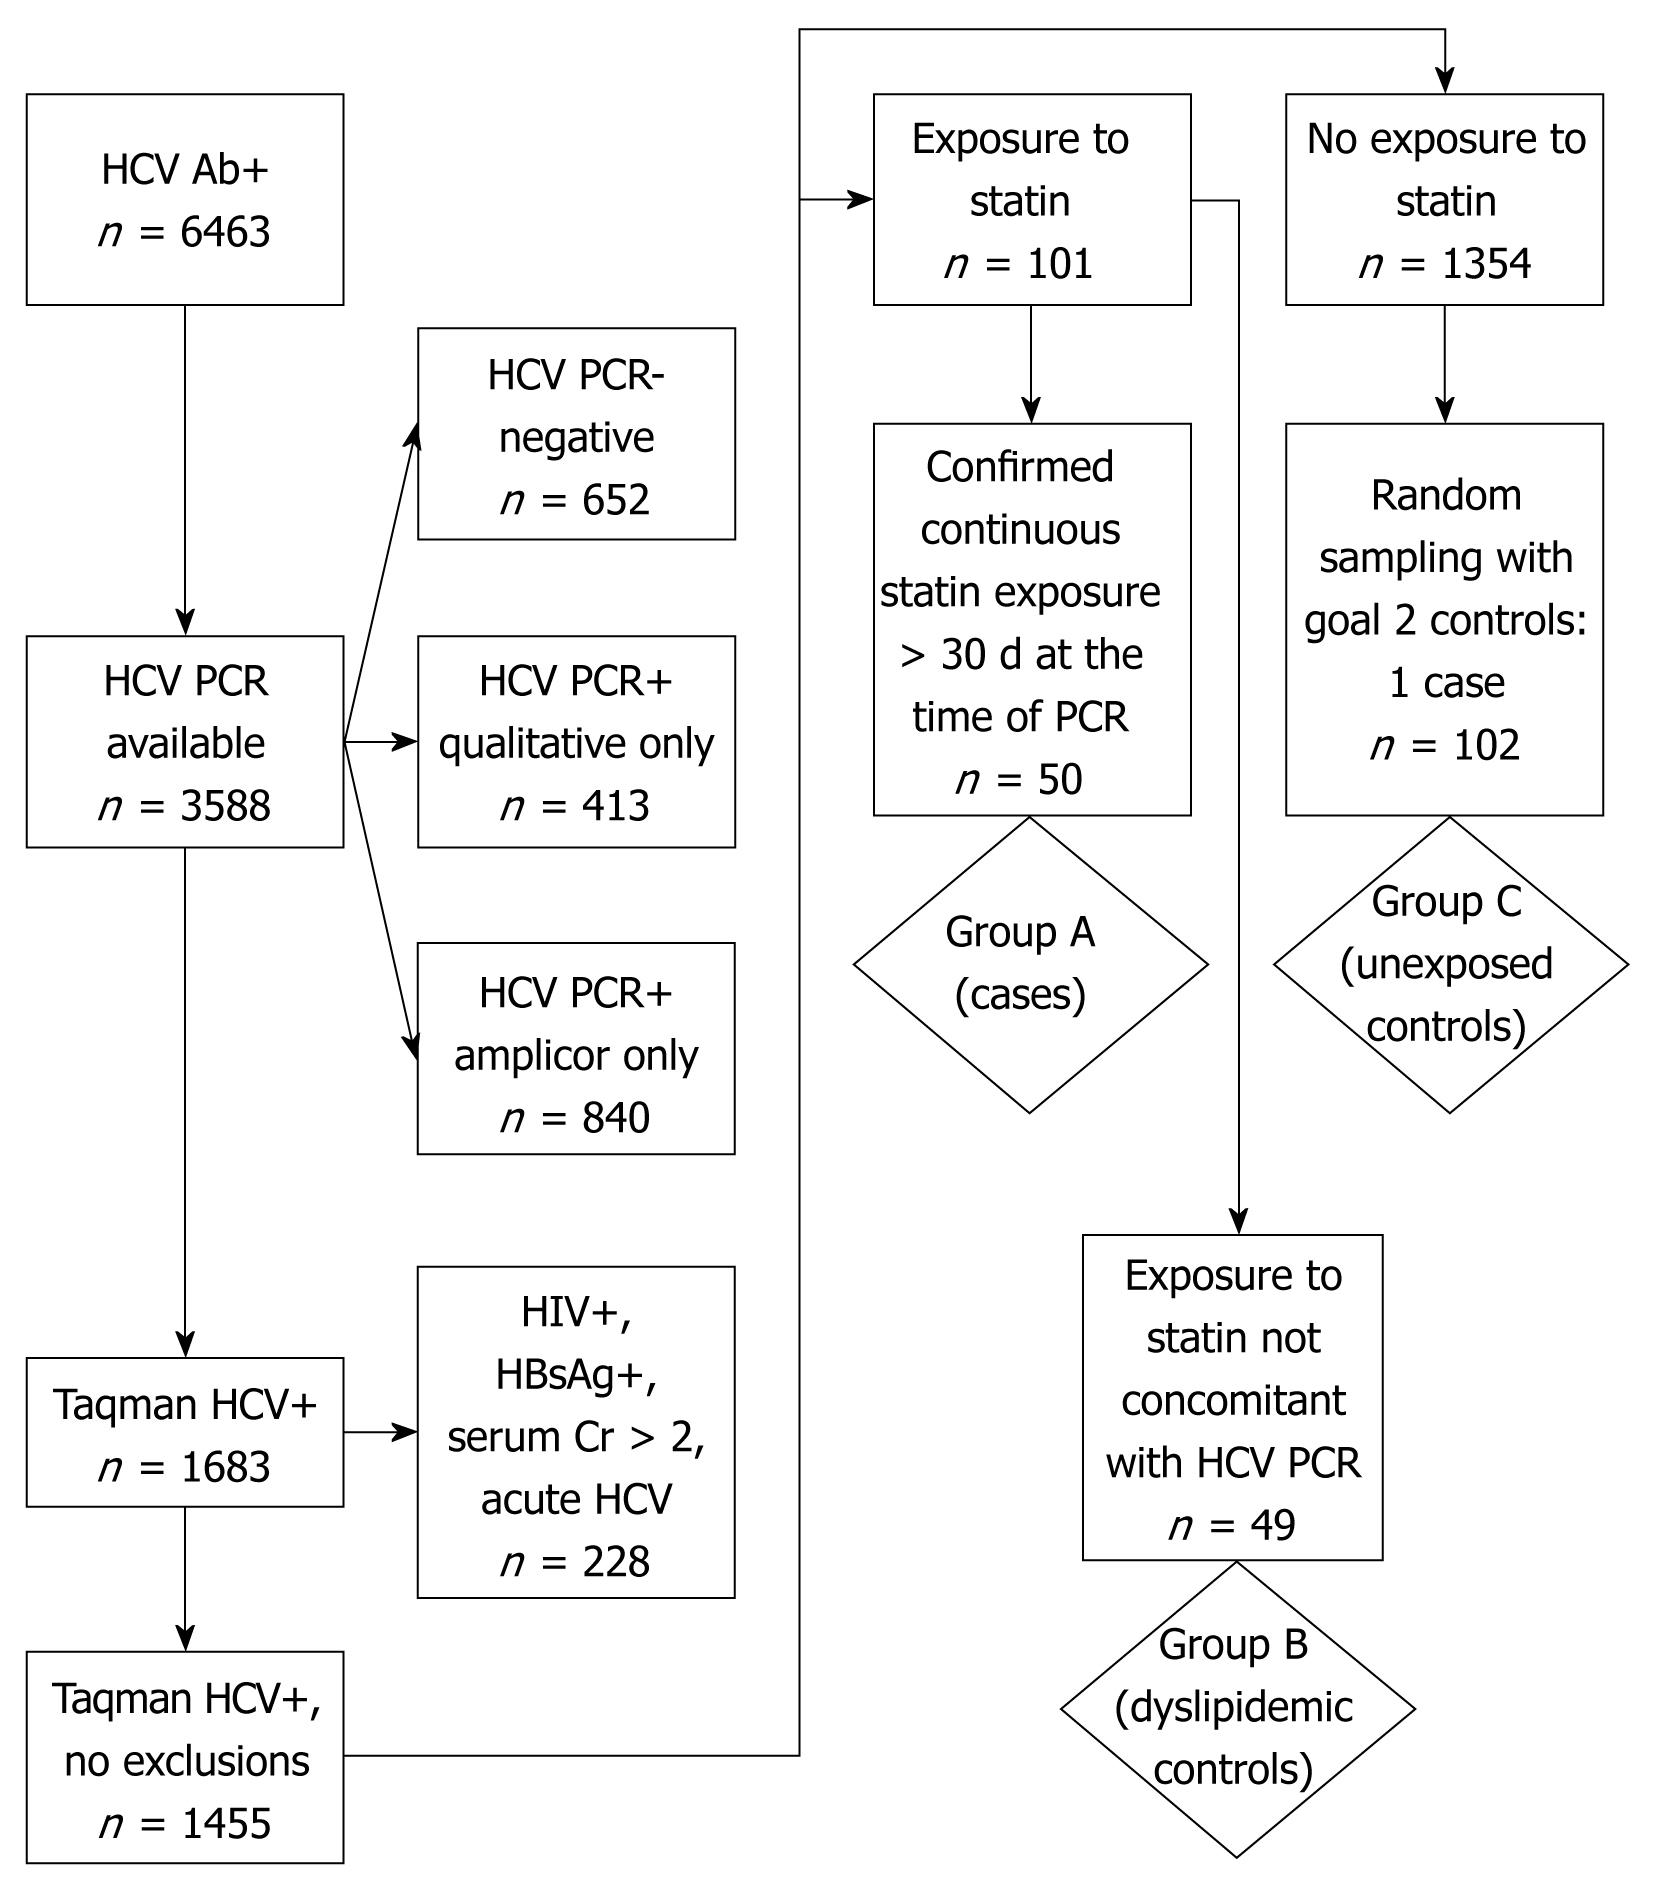
Figure 1 Patient assignment algorithm.
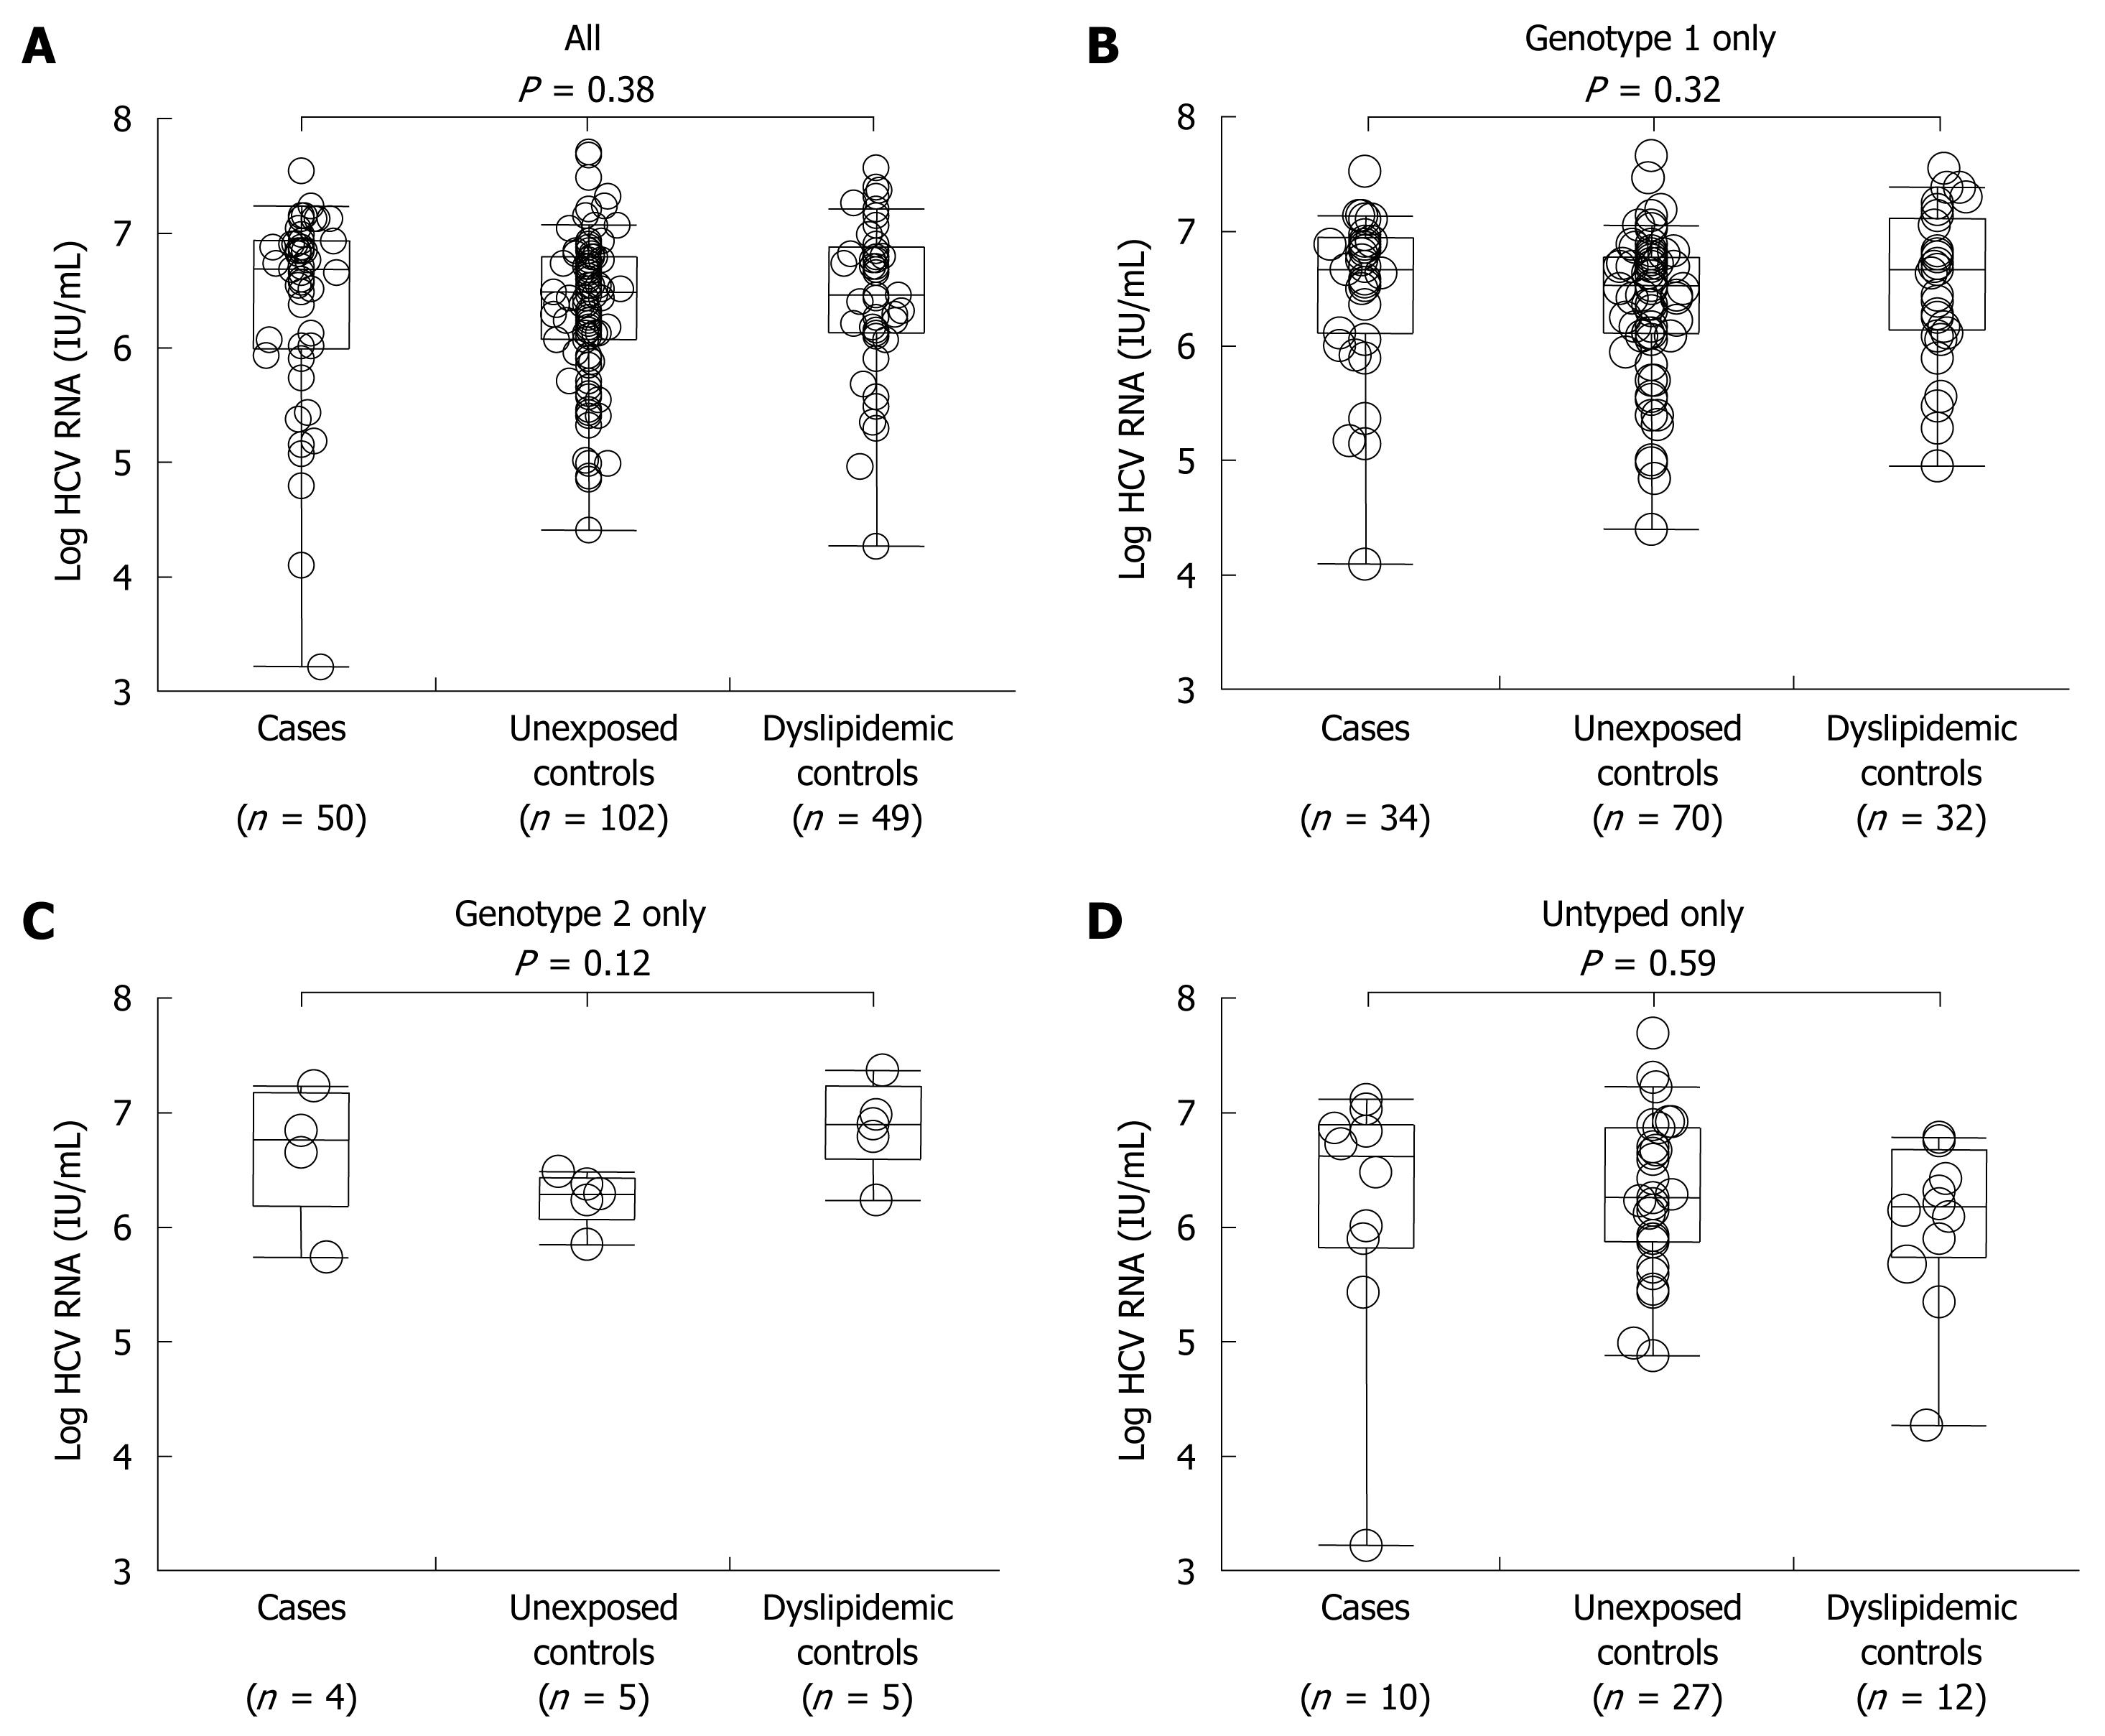
Figure 2 Hepatitis C RNA titers relative to HMG-coA reductase inhibitor exposure.
Log HCV RNA viral load (IU/mL) in Group A, Group B, and Group C subjects. A: Entire cohort; B: Genotype 1 patients; C: Genotype 2 patients; D: Patients in which genotype was not available. Box plots indicate median, 25th and 75th percentiles (box), and 5th and 95th percentiles. P-value obtained by Kruskal-Wallis test.
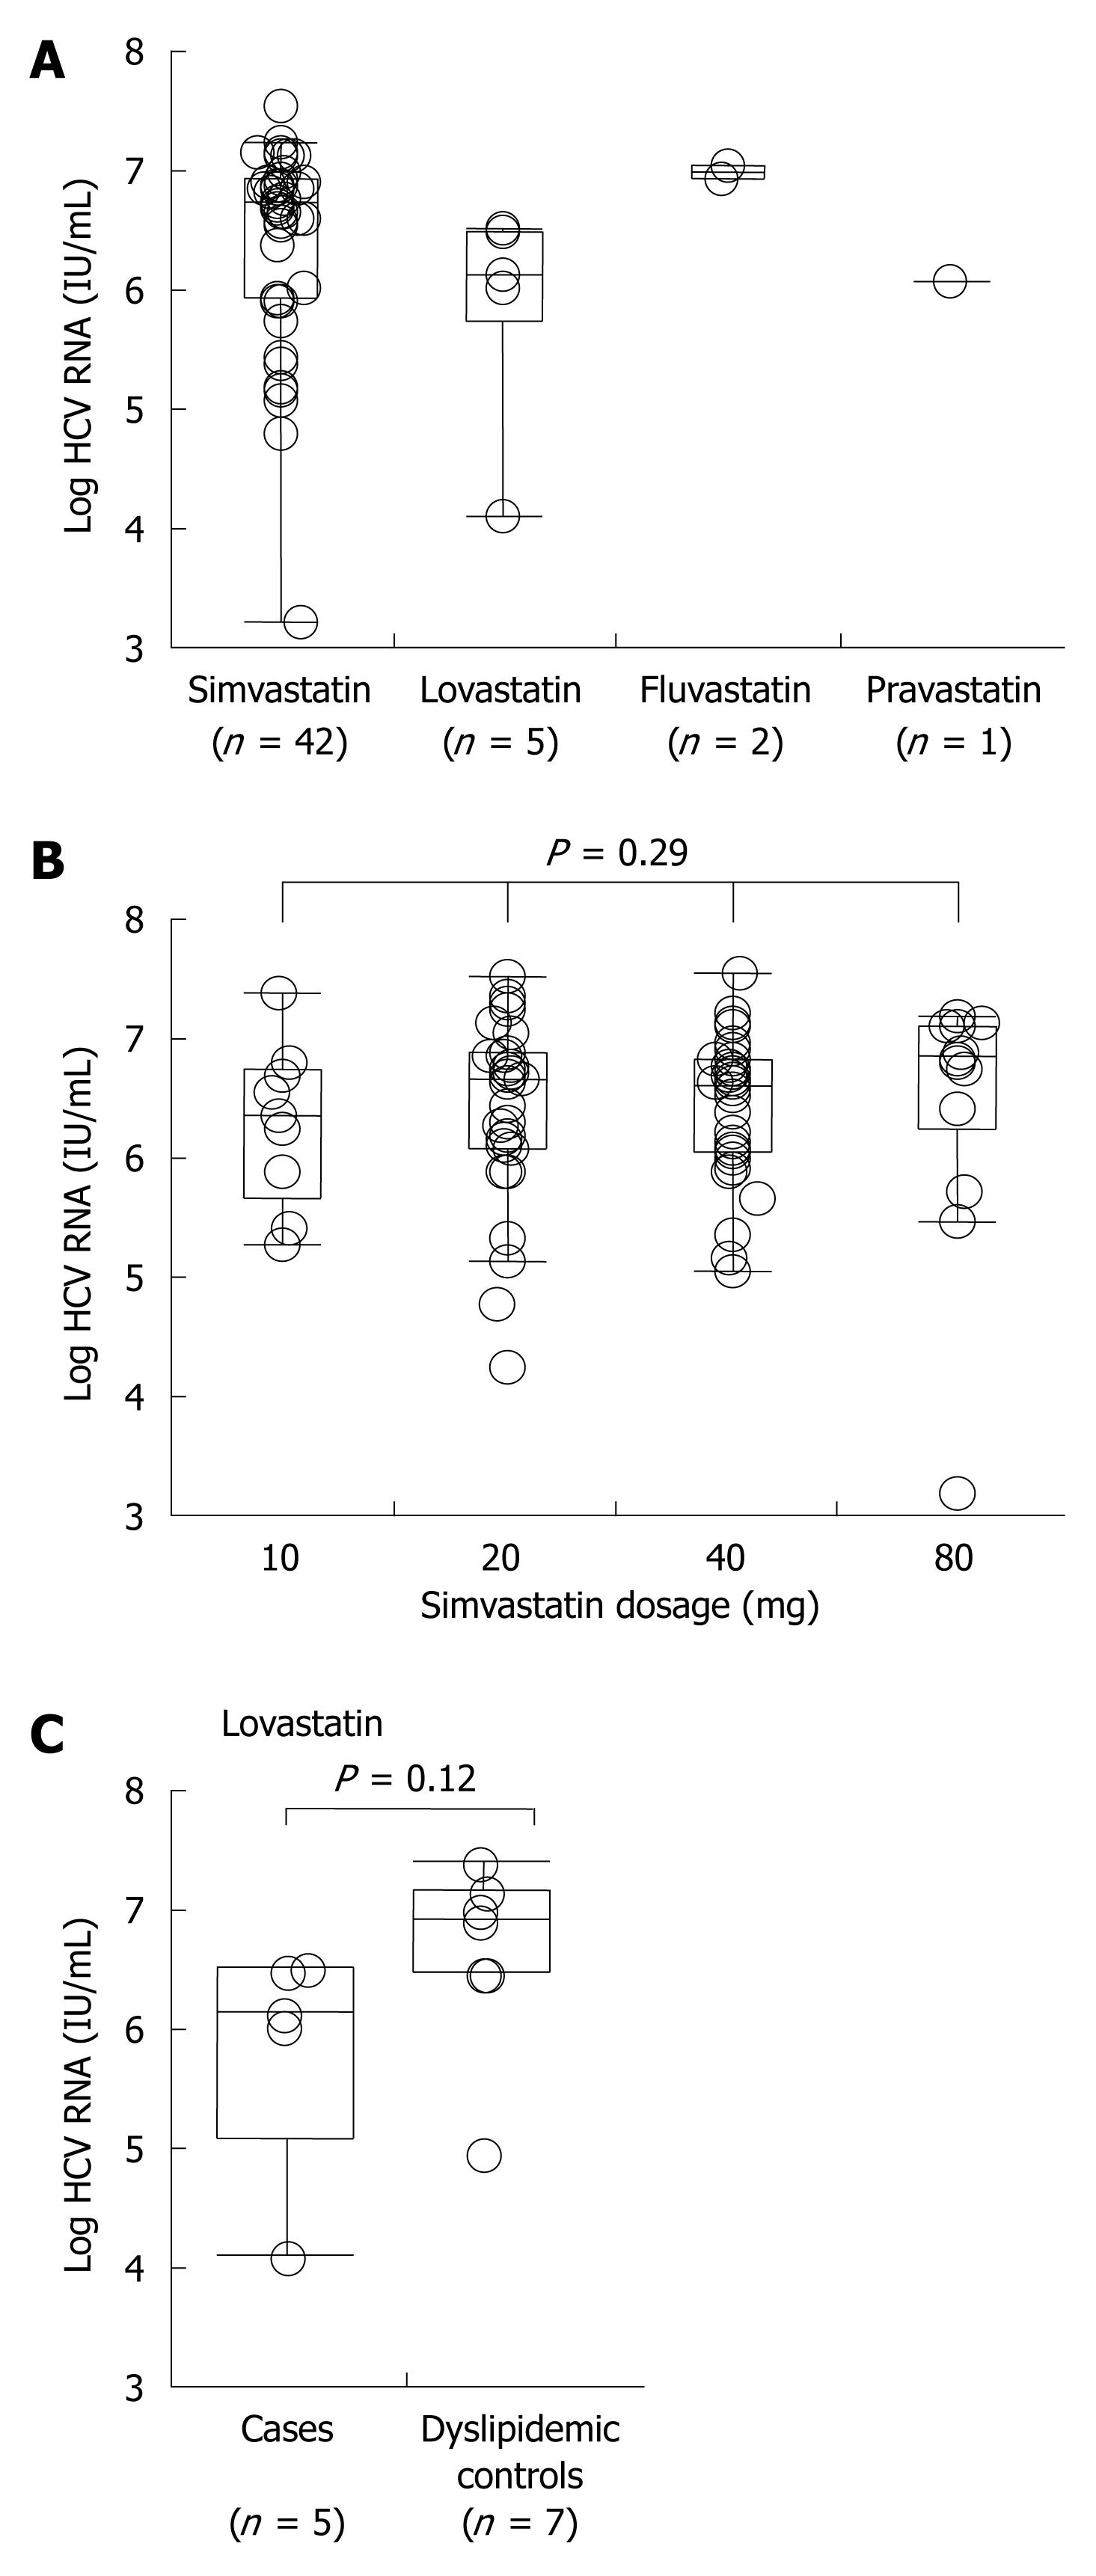
Figure 3 Antiviral effects of individual HMG-CoA reductase inhibitors.
A: Log HCV RNA viral load (IU/mL) for Group A subjects who received simvastatin (n = 42), lovastatin (n = 5), fluvastatin (n = 2) and pravastatin (n = 1); B: Log HCV RNA viral load (IU/mL) for simvastatin-exposed subjects who were receiving 10 mg (n = 4), 20 mg (n = 8), 40 mg (n = 20), 80 mg (n = 10). P-value obtained by Kruskal-Wallis Test; C: Pairwise comparison of median HCV RNA titers in lovastatin-exposed Group A subjects and Group B subjects who received lovastatin but were not being treated at the time of the RNA determination. P-value from Wilcoxon sign rank test.
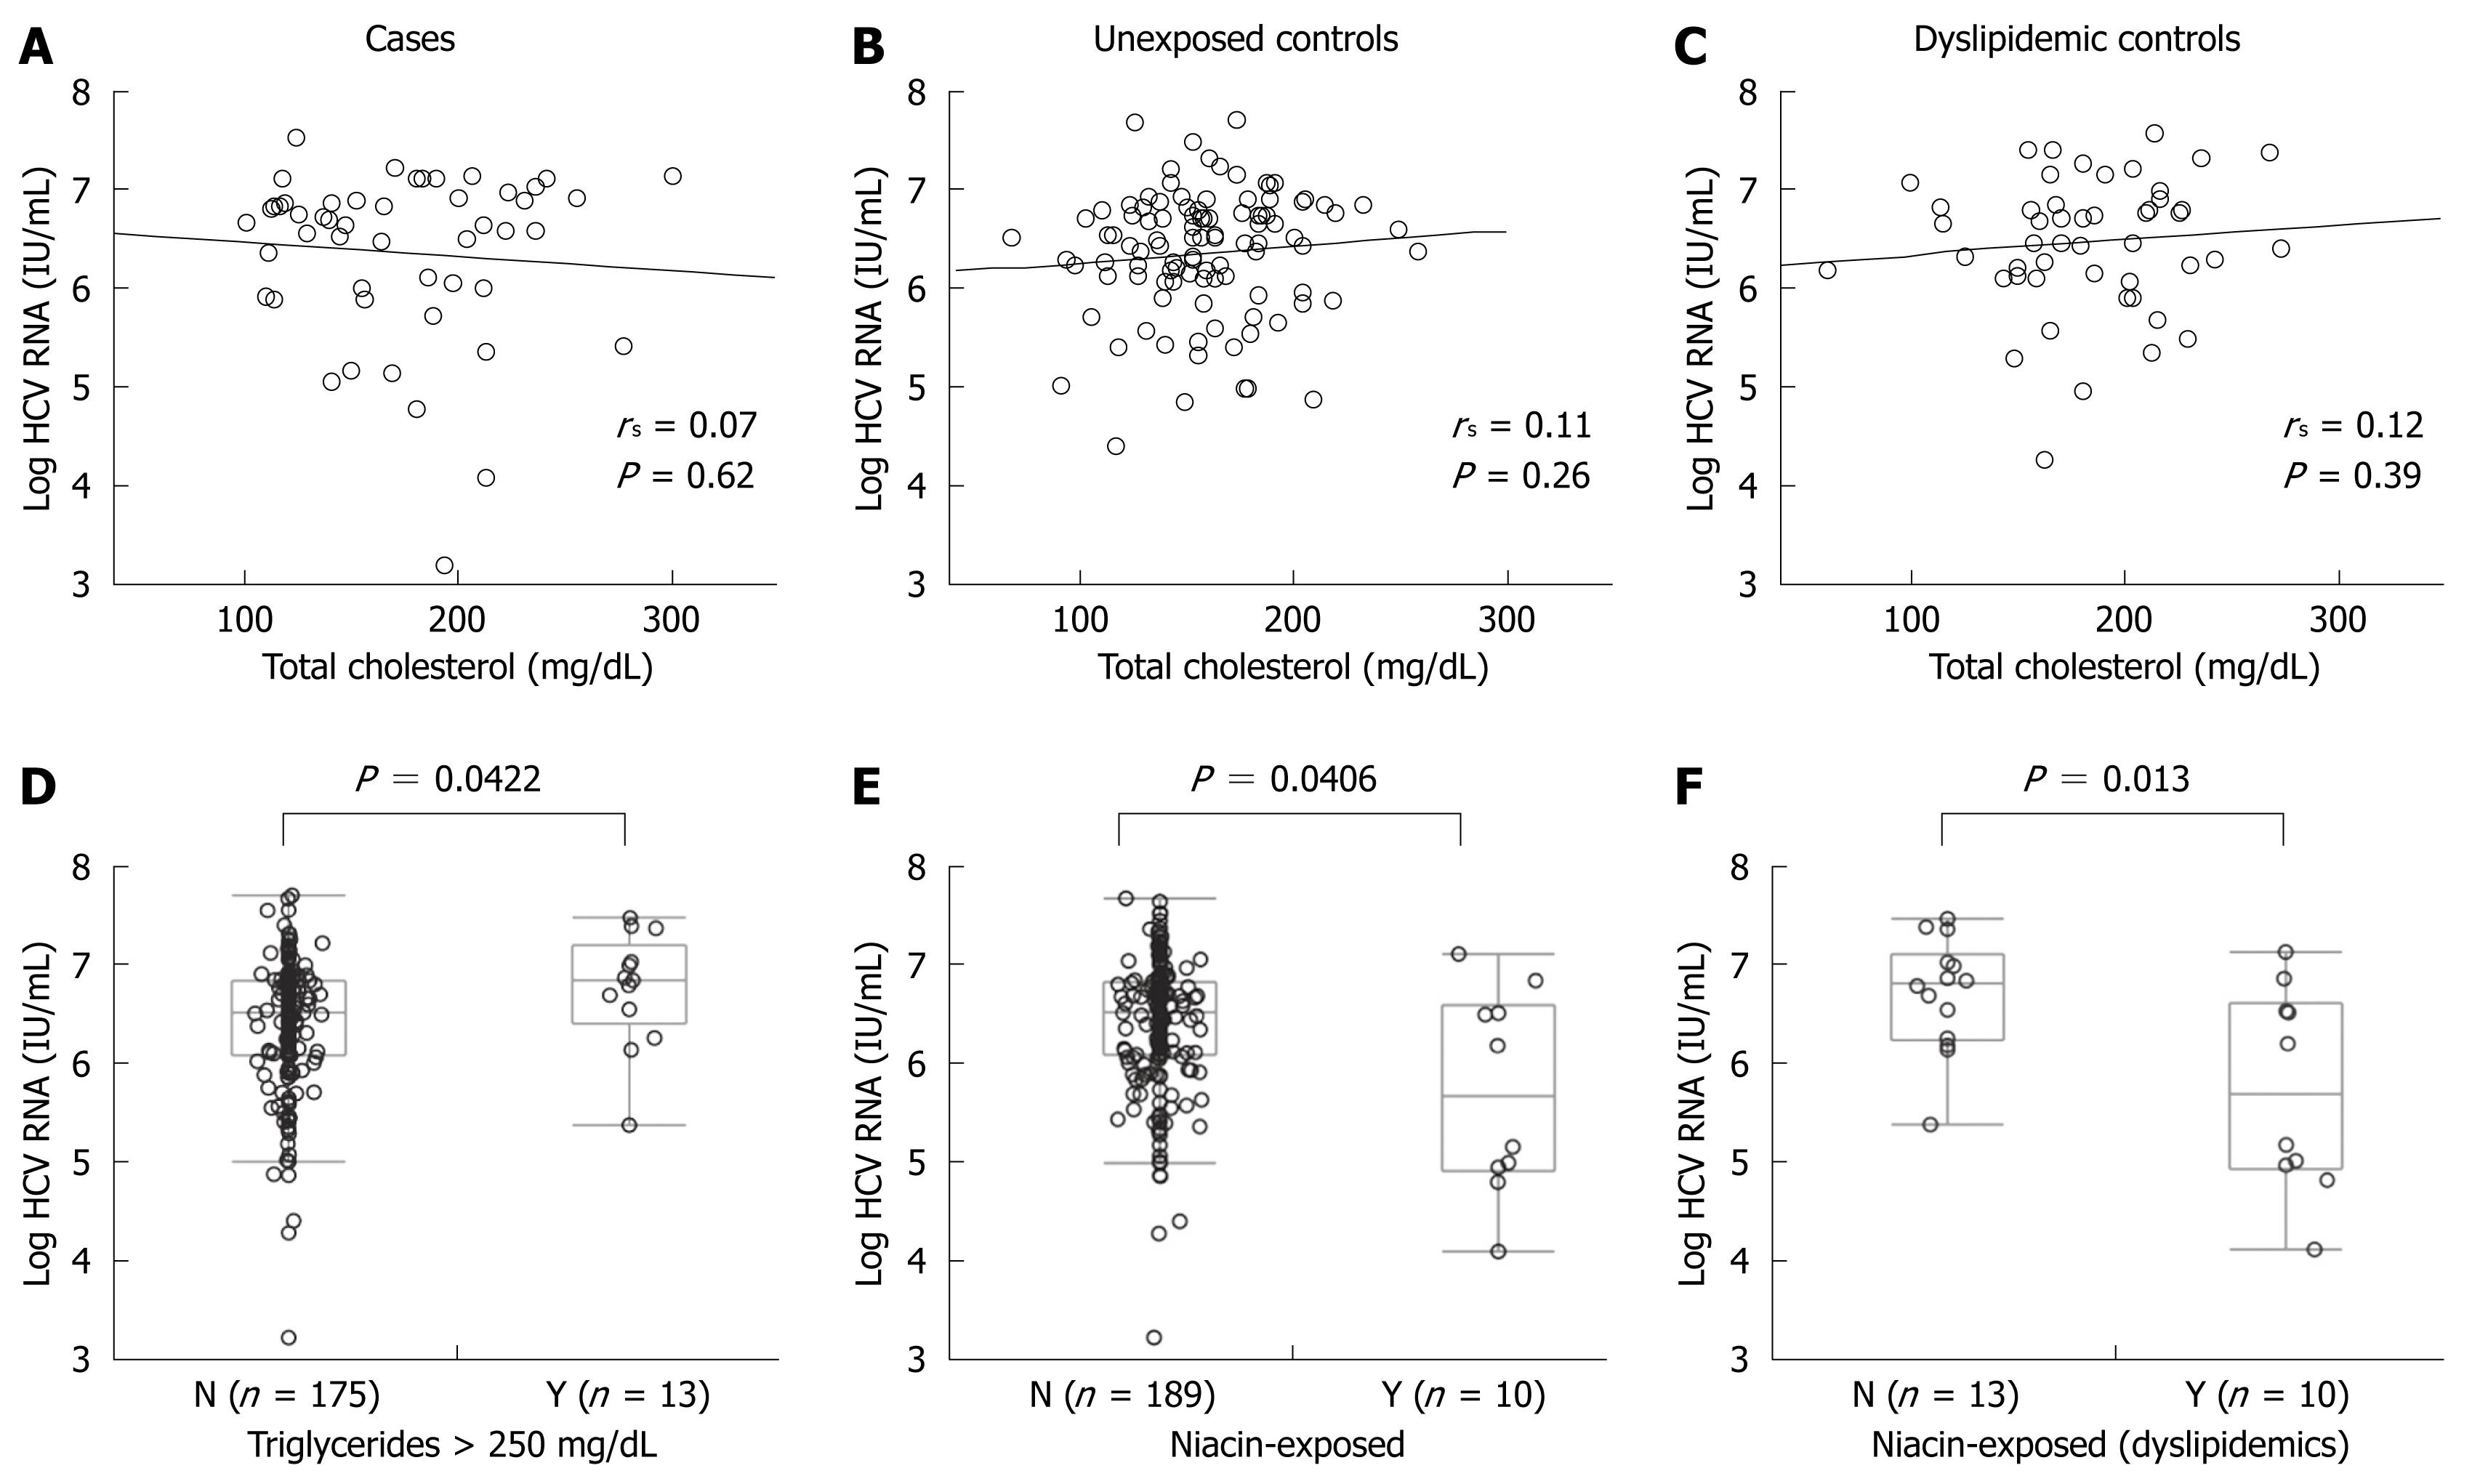
Figure 4 Lack of correlation between serum cholesterol and HCV RNA viral load, but apparent association with hypertriglyceridemia.
Linear correlation of log HCV RNA titers (IU/mL) and serum total cholesterol (mg/dL) in Group A (A), Group B (B), and Group C (C). P-values obtained by Spearman correlation; D: Log HCV RNA titers for patients with serum triglycerides greater than or below 250 mg/dL excluding patients on gemfibrozil or niacin (> 250 mg/dL: median 6 760 000 IU/mL vs < 250 mg/dL: median 3 130 000 IU/mL, P = 0.042); E: Log HCV RNA titers for patients with or without exposure to niacin, excluding patients on gemfibrozil (exposed: median 835 000 IU/mL vs unexposed: median 3 350 000 IU/mL, P = 0.041); F: Log HCV RNA titer among patients with hypertriglyceridemia, excluding gemfibrozil therapy, with and without exposure to niacin shows lower HCV RNA viral load in niacin-treated patients (niacin-exposed: median 835 000 IU/mL vs unexposed: median 6 760 000 IU/mL, P = 0.013).
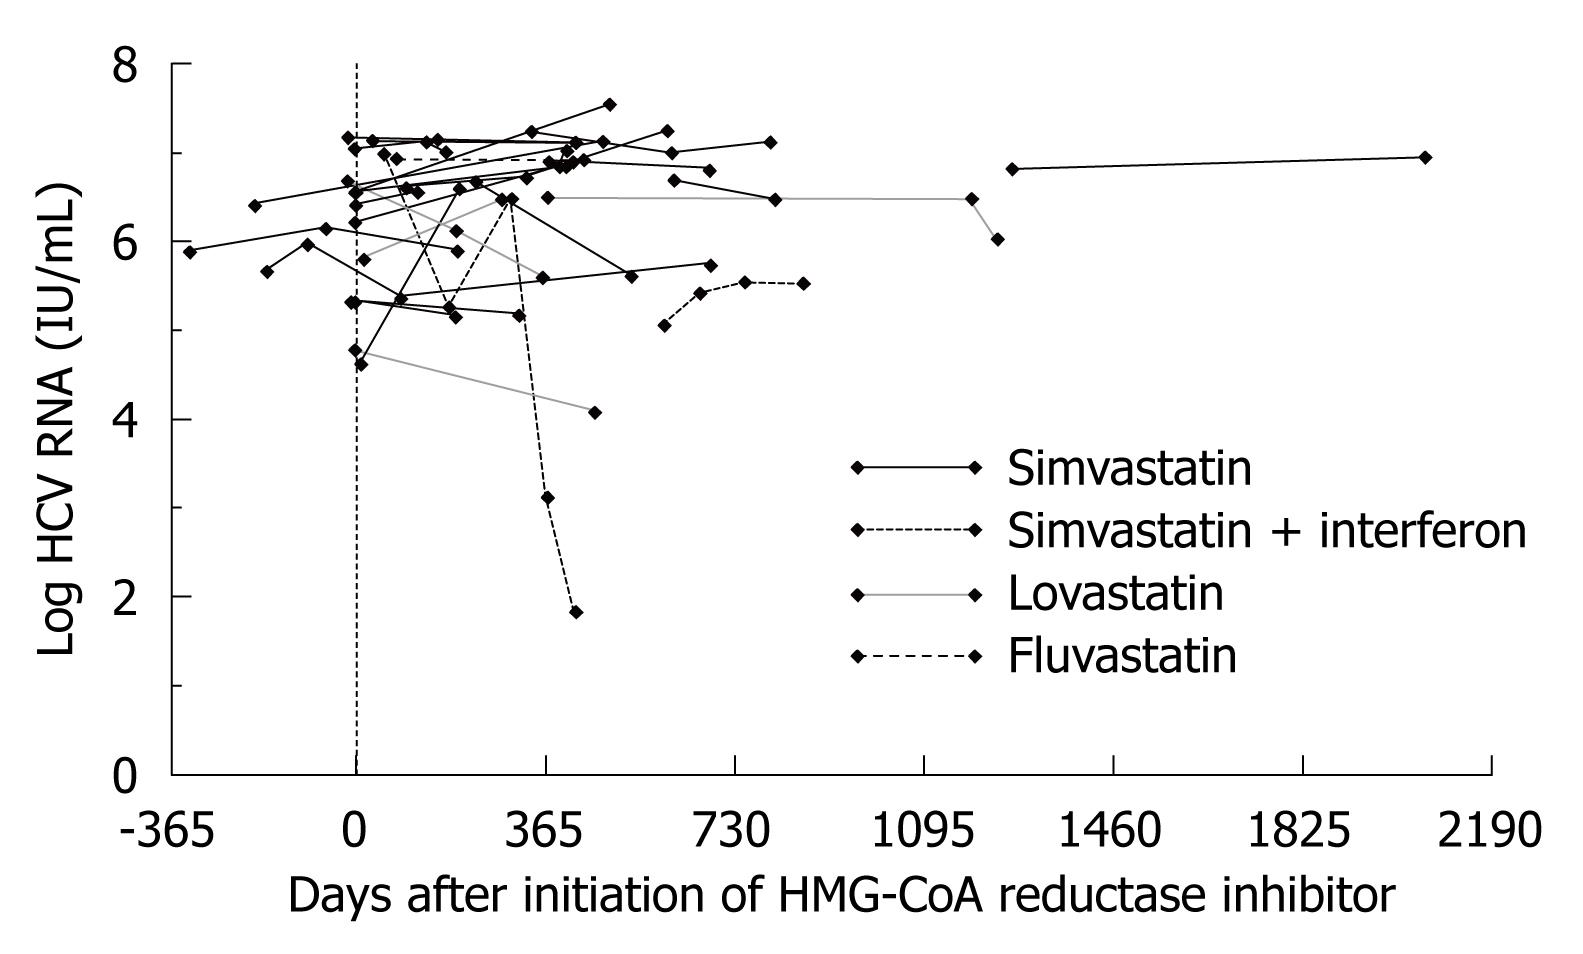
Figure 5 Longitudinal effect of statin therapy.
Log HCV RNA titer plotted against days relative to the statin initiation date for simvastatin (black lines, n = 21), simvastatin plus interferon (n = 2), lovastatin (grey lines, n = 4), and fluvastatin (big dotted line, n = 1) for patients with more than one determination of HCV RNA titer. Eleven subjects had HCV RNA titers measured before and after the initiation of statin therapy.
- Citation: Forde KA, Law C, O’Flynn R, Kaplan DE. Do statins reduce hepatitis C RNA titers during routine clinical use? World J Gastroenterol 2009; 15(40): 5020-5027
- URL: https://www.wjgnet.com/1007-9327/full/v15/i40/5020.htm
- DOI: https://dx.doi.org/10.3748/wjg.15.5020


