Copyright
©2009 The WJG Press and Baishideng.
World J Gastroenterol. Jan 28, 2009; 15(4): 431-440
Published online Jan 28, 2009. doi: 10.3748/wjg.15.431
Published online Jan 28, 2009. doi: 10.3748/wjg.15.431
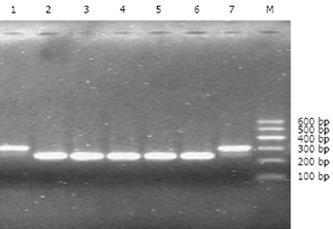
Figure 1 shRNA/mdr1 expression plasmids digested by restriction enzyme Bag II and Hind III, and a fragment produced in 1.
5% agarose gel electrophoresis. Lanes 1 and 7: positive clone size of 310 bp (insert element 64 bp).
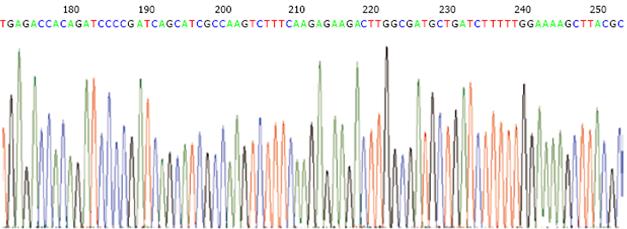
Figure 2 Sequence of pSUPER-shRNA/mdr1 (inserted element 64 bp).
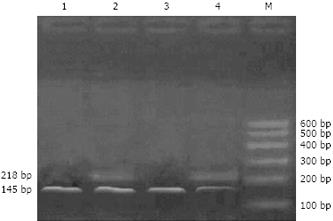
Figure 3 Real-time PCR showing significantly reduced mdr1 mRNA expression in cells treated with pSUPER-shRNA/mdr1 vector.
1: HepG2; 2: HepG2/mdr1; 3: HepG2/m-sh; 4: HepG2/mdr1 empty vector; M: Marker; Mdr1: 218 bp; GAPDH: 145 bp.
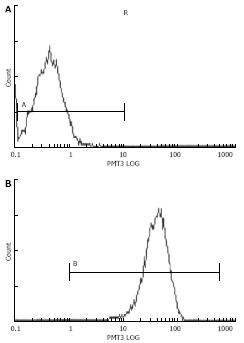
Figure 4 FCM showing P-gp expression of HepG2/mdr1 in test groups (A) and control groups (B).
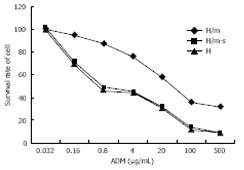
Figure 5 Sensitivity of HepG2/mdr1 and HepG2/mdr1-siRNA to ADM.
After transfected with pSUPER-shRNA/mdr1 vectors, the resistance of HepG2 cells to adiramycin and mytomycin decreased from 44.6-fold to 1.4-fold and from 138.1-fold to 1.14-fold.
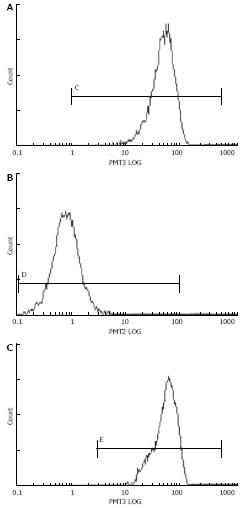
Figure 6 DNR accumulation of HepG2/mdr1 (A, B) and HepG2 cells (C) pre- and post-transfection.
Compared with control groups, accumulation of daunorubicin in cells treated with shRNA vectors increased significantly (79.32% vs 37.96%, P < 0.05). There was no difference in sensitive cells of HepG2 between test groups (79.32% vs 87.56%).
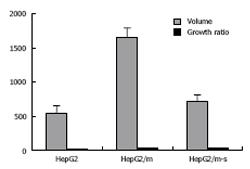
Figure 7 Changes in volume and growth ratio of tumor after treatment with ADM.
More changes in tumor volume occurred in transfected groups than in control groups (1695.70 ± 152.54 mm3vs 700.14 ± 25.61 mm3, P < 0.01).
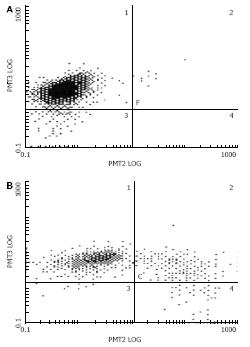
Figure 8 FCM showing lower P-gp expression in HepG2 cells (A) and HepG2/mdr1-shRNA (B) in test groups than in control groups (65% vs 94.
1%, P < 0.05). There was no significant difference between groups treated with in situ injection and intra-abdominal injection of pSUPER-mdr1 (65.1% vs 58.7%).
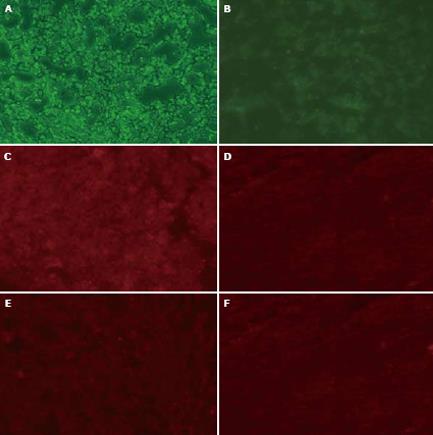
Figure 9 Immunohistochemistry showing green fluorescence in test groups (A) and control groups (B), P-gp expression in test groups (C) and control groups (D), P-gp expression in test groups transfected with in situs injection (E) and intra-abdominal injection of pSUPER-mdr1 (F) (× 200).
The transfection ratio for test groups was higher than that for control groups (86.70% vs 35.20%, P < 0.05). The expression of P-gp in test groups was lower than that in control groups (15.75% vs 97.90%, P < 0.05).
-
Citation: Pan GD, Yang JQ, Yan LN, Chu GP, Liu Q, Xiao Y, Yuan L. Reversal of multi-drug resistance by pSUPER-shRNA-mdr1
in vivo andin vitro . World J Gastroenterol 2009; 15(4): 431-440 - URL: https://www.wjgnet.com/1007-9327/full/v15/i4/431.htm
- DOI: https://dx.doi.org/10.3748/wjg.15.431


