Copyright
©2009 The WJG Press and Baishideng.
World J Gastroenterol. Oct 21, 2009; 15(39): 4962-4968
Published online Oct 21, 2009. doi: 10.3748/wjg.15.4962
Published online Oct 21, 2009. doi: 10.3748/wjg.15.4962
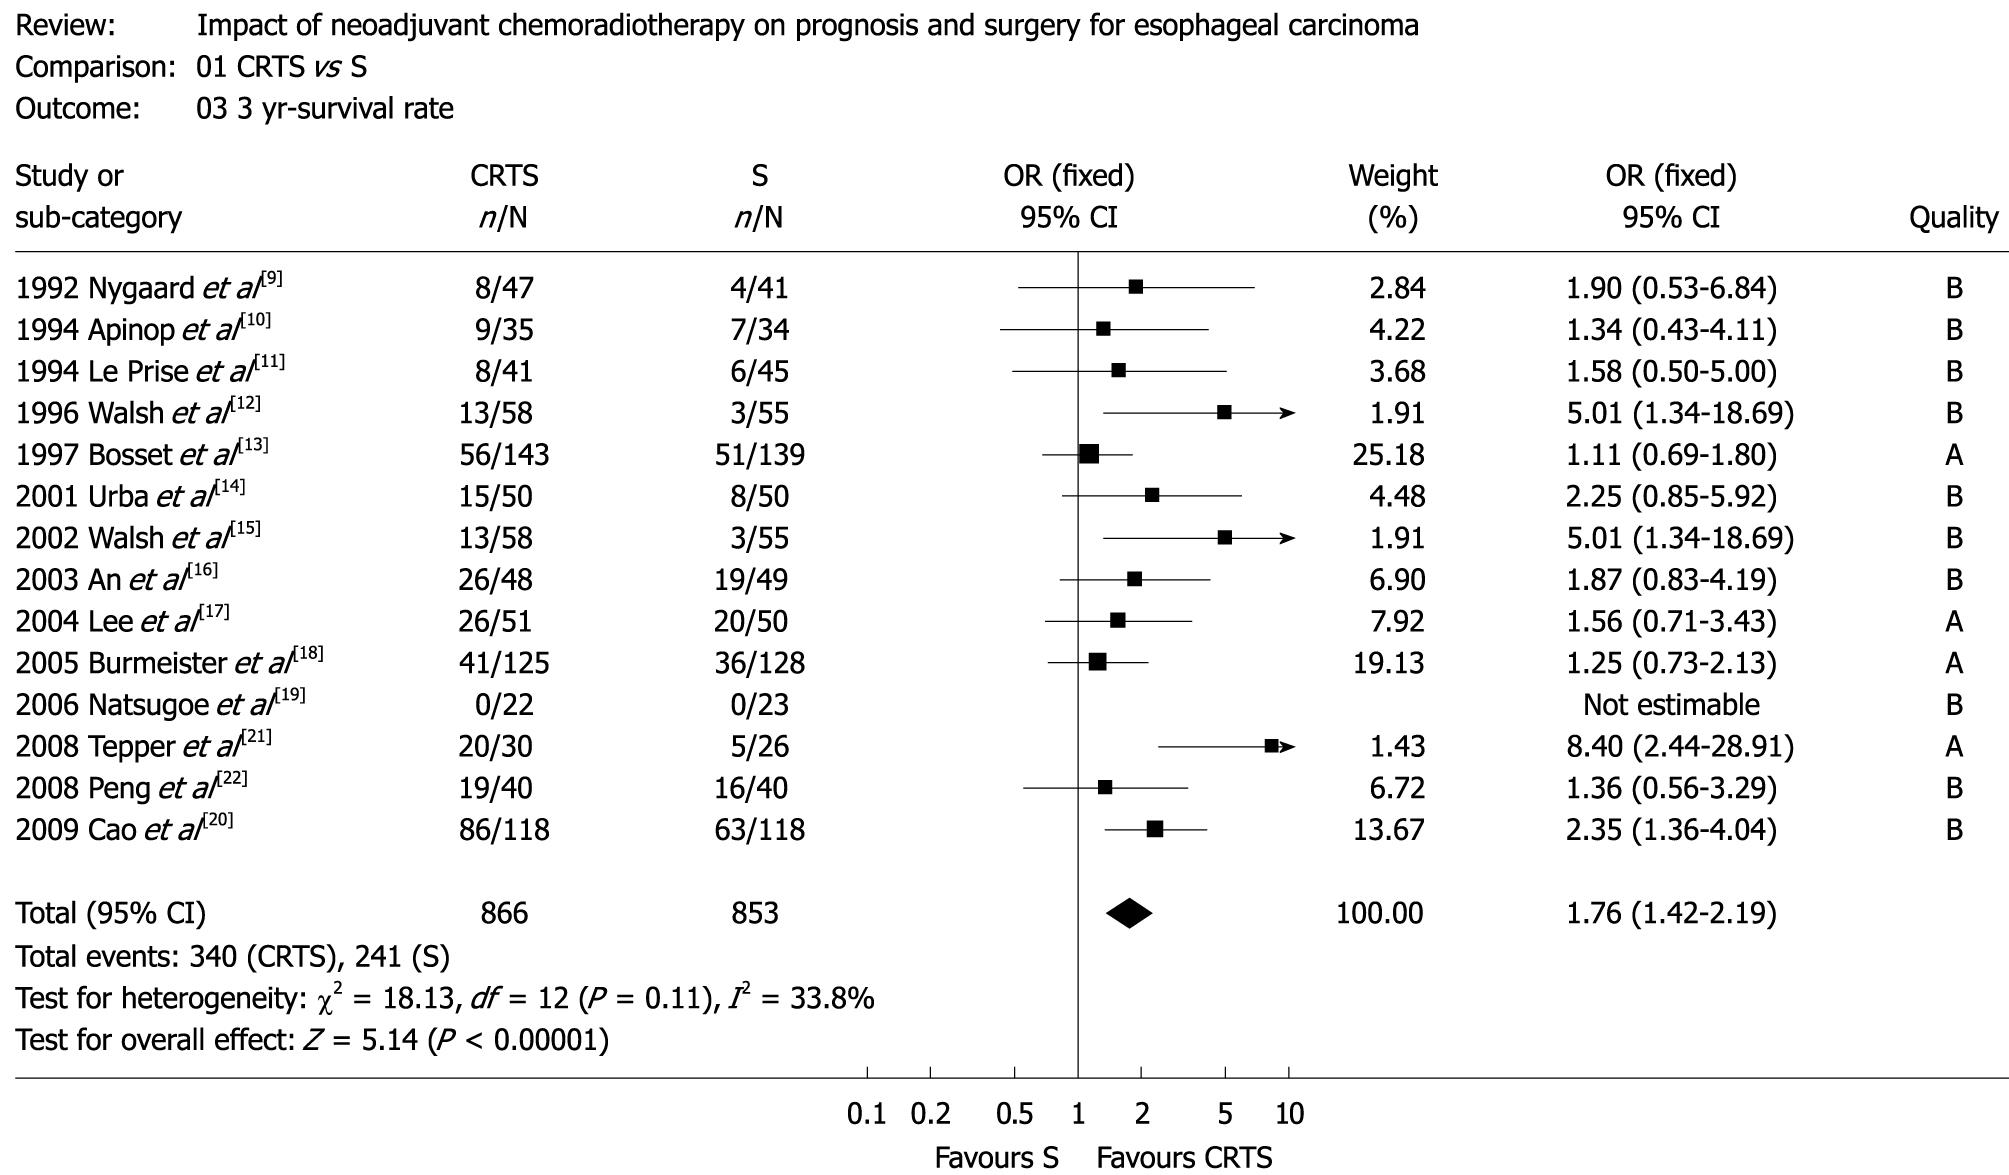
Figure 1 Three-year survival (OR: 1.
76, 95% CI: 1.42-2.19, P = 0.11). OR: Odds ratio; CI: Confidence interval; CRTS: Neoadjuvant chemoradiotherapy; S: Surgery alone.
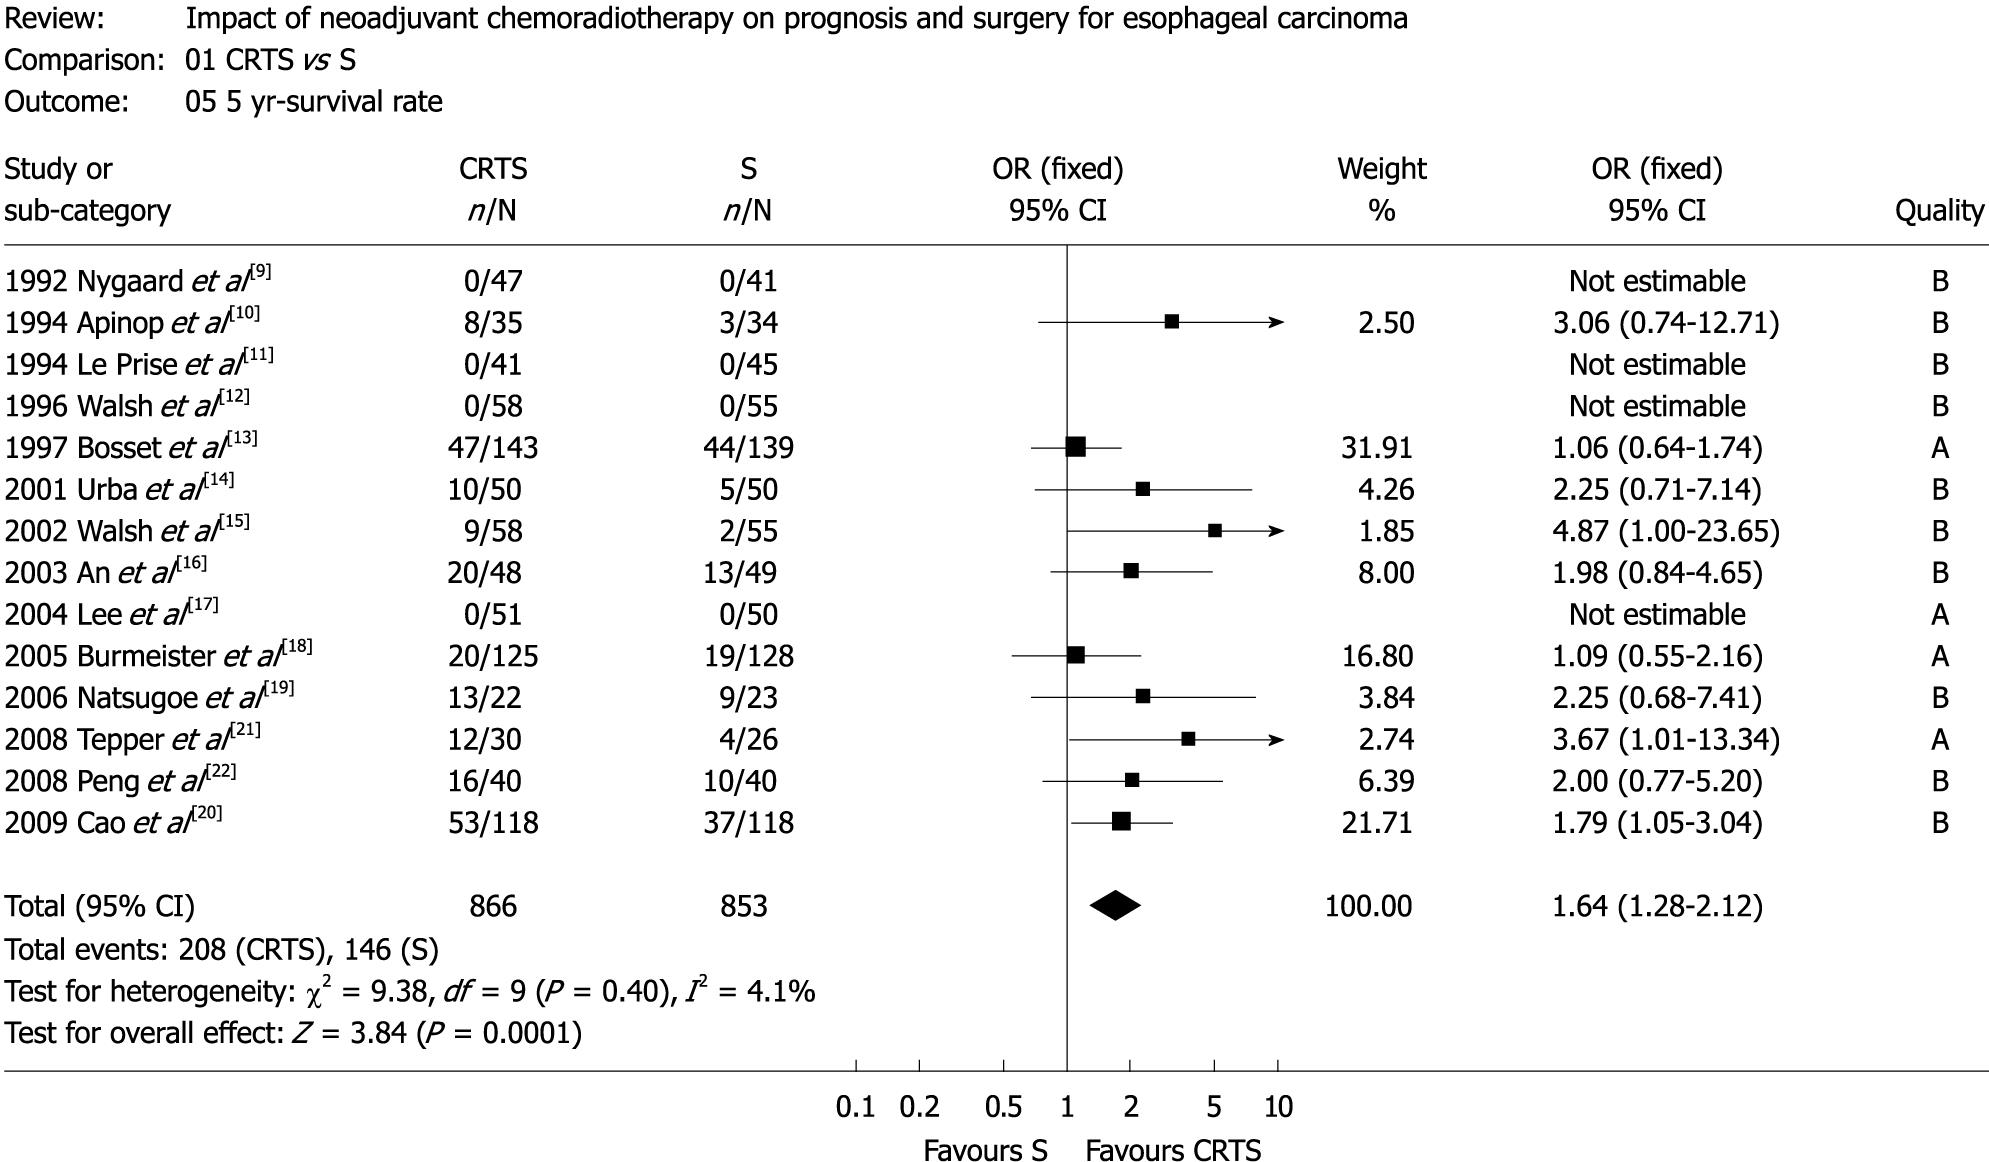
Figure 2 Five-year survival (OR: 1.
64, 95% CI: 1.28-2.12, P = 0.40).
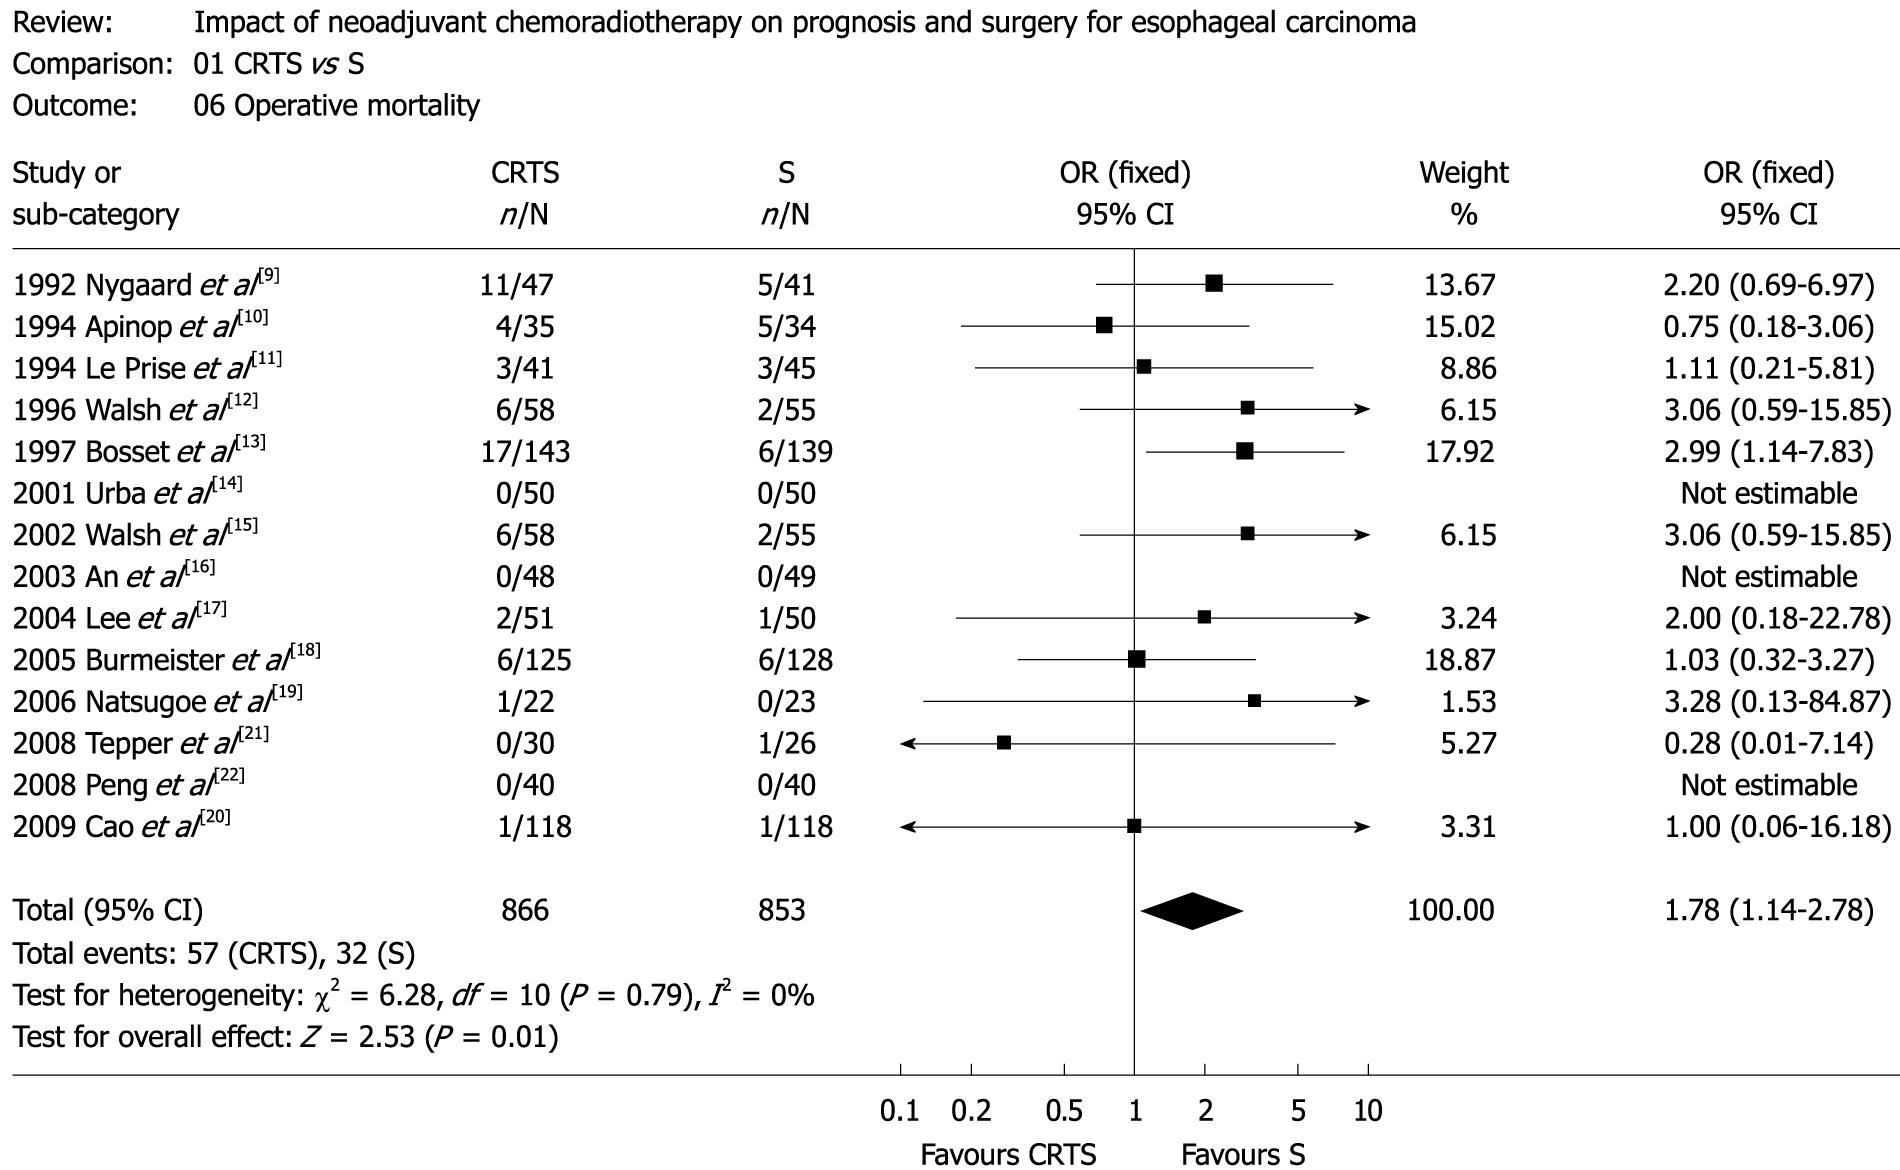
Figure 3 Operative mortality (OR: 1.
78, 95% CI: 1.14-2.78, P = 0.79).
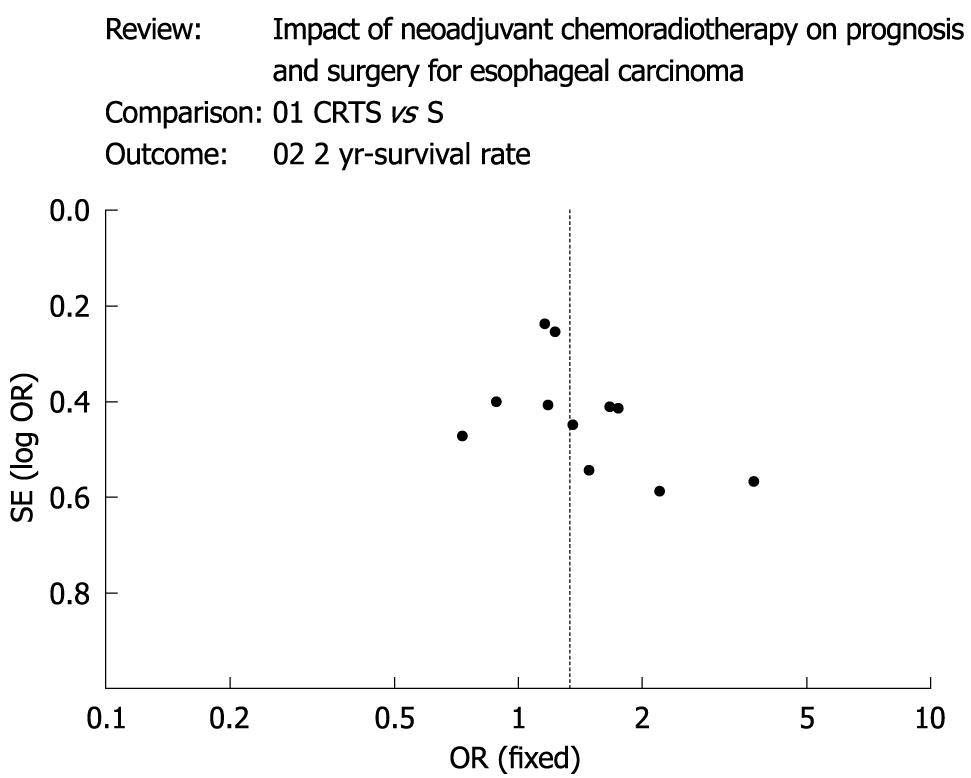
Figure 4 A funnel plot about 2-year survival with regard to the publication bias of all analysis, shows the basic symmetrical and inverted funnel-shaped graphics.
- Citation: Lv J, Cao XF, Zhu B, Ji L, Tao L, Wang DD. Effect of neoadjuvant chemoradiotherapy on prognosis and surgery for esophageal carcinoma. World J Gastroenterol 2009; 15(39): 4962-4968
- URL: https://www.wjgnet.com/1007-9327/full/v15/i39/4962.htm
- DOI: https://dx.doi.org/10.3748/wjg.15.4962


