Copyright
©2009 The WJG Press and Baishideng.
World J Gastroenterol. Sep 28, 2009; 15(36): 4587-4592
Published online Sep 28, 2009. doi: 10.3748/wjg.15.4587
Published online Sep 28, 2009. doi: 10.3748/wjg.15.4587
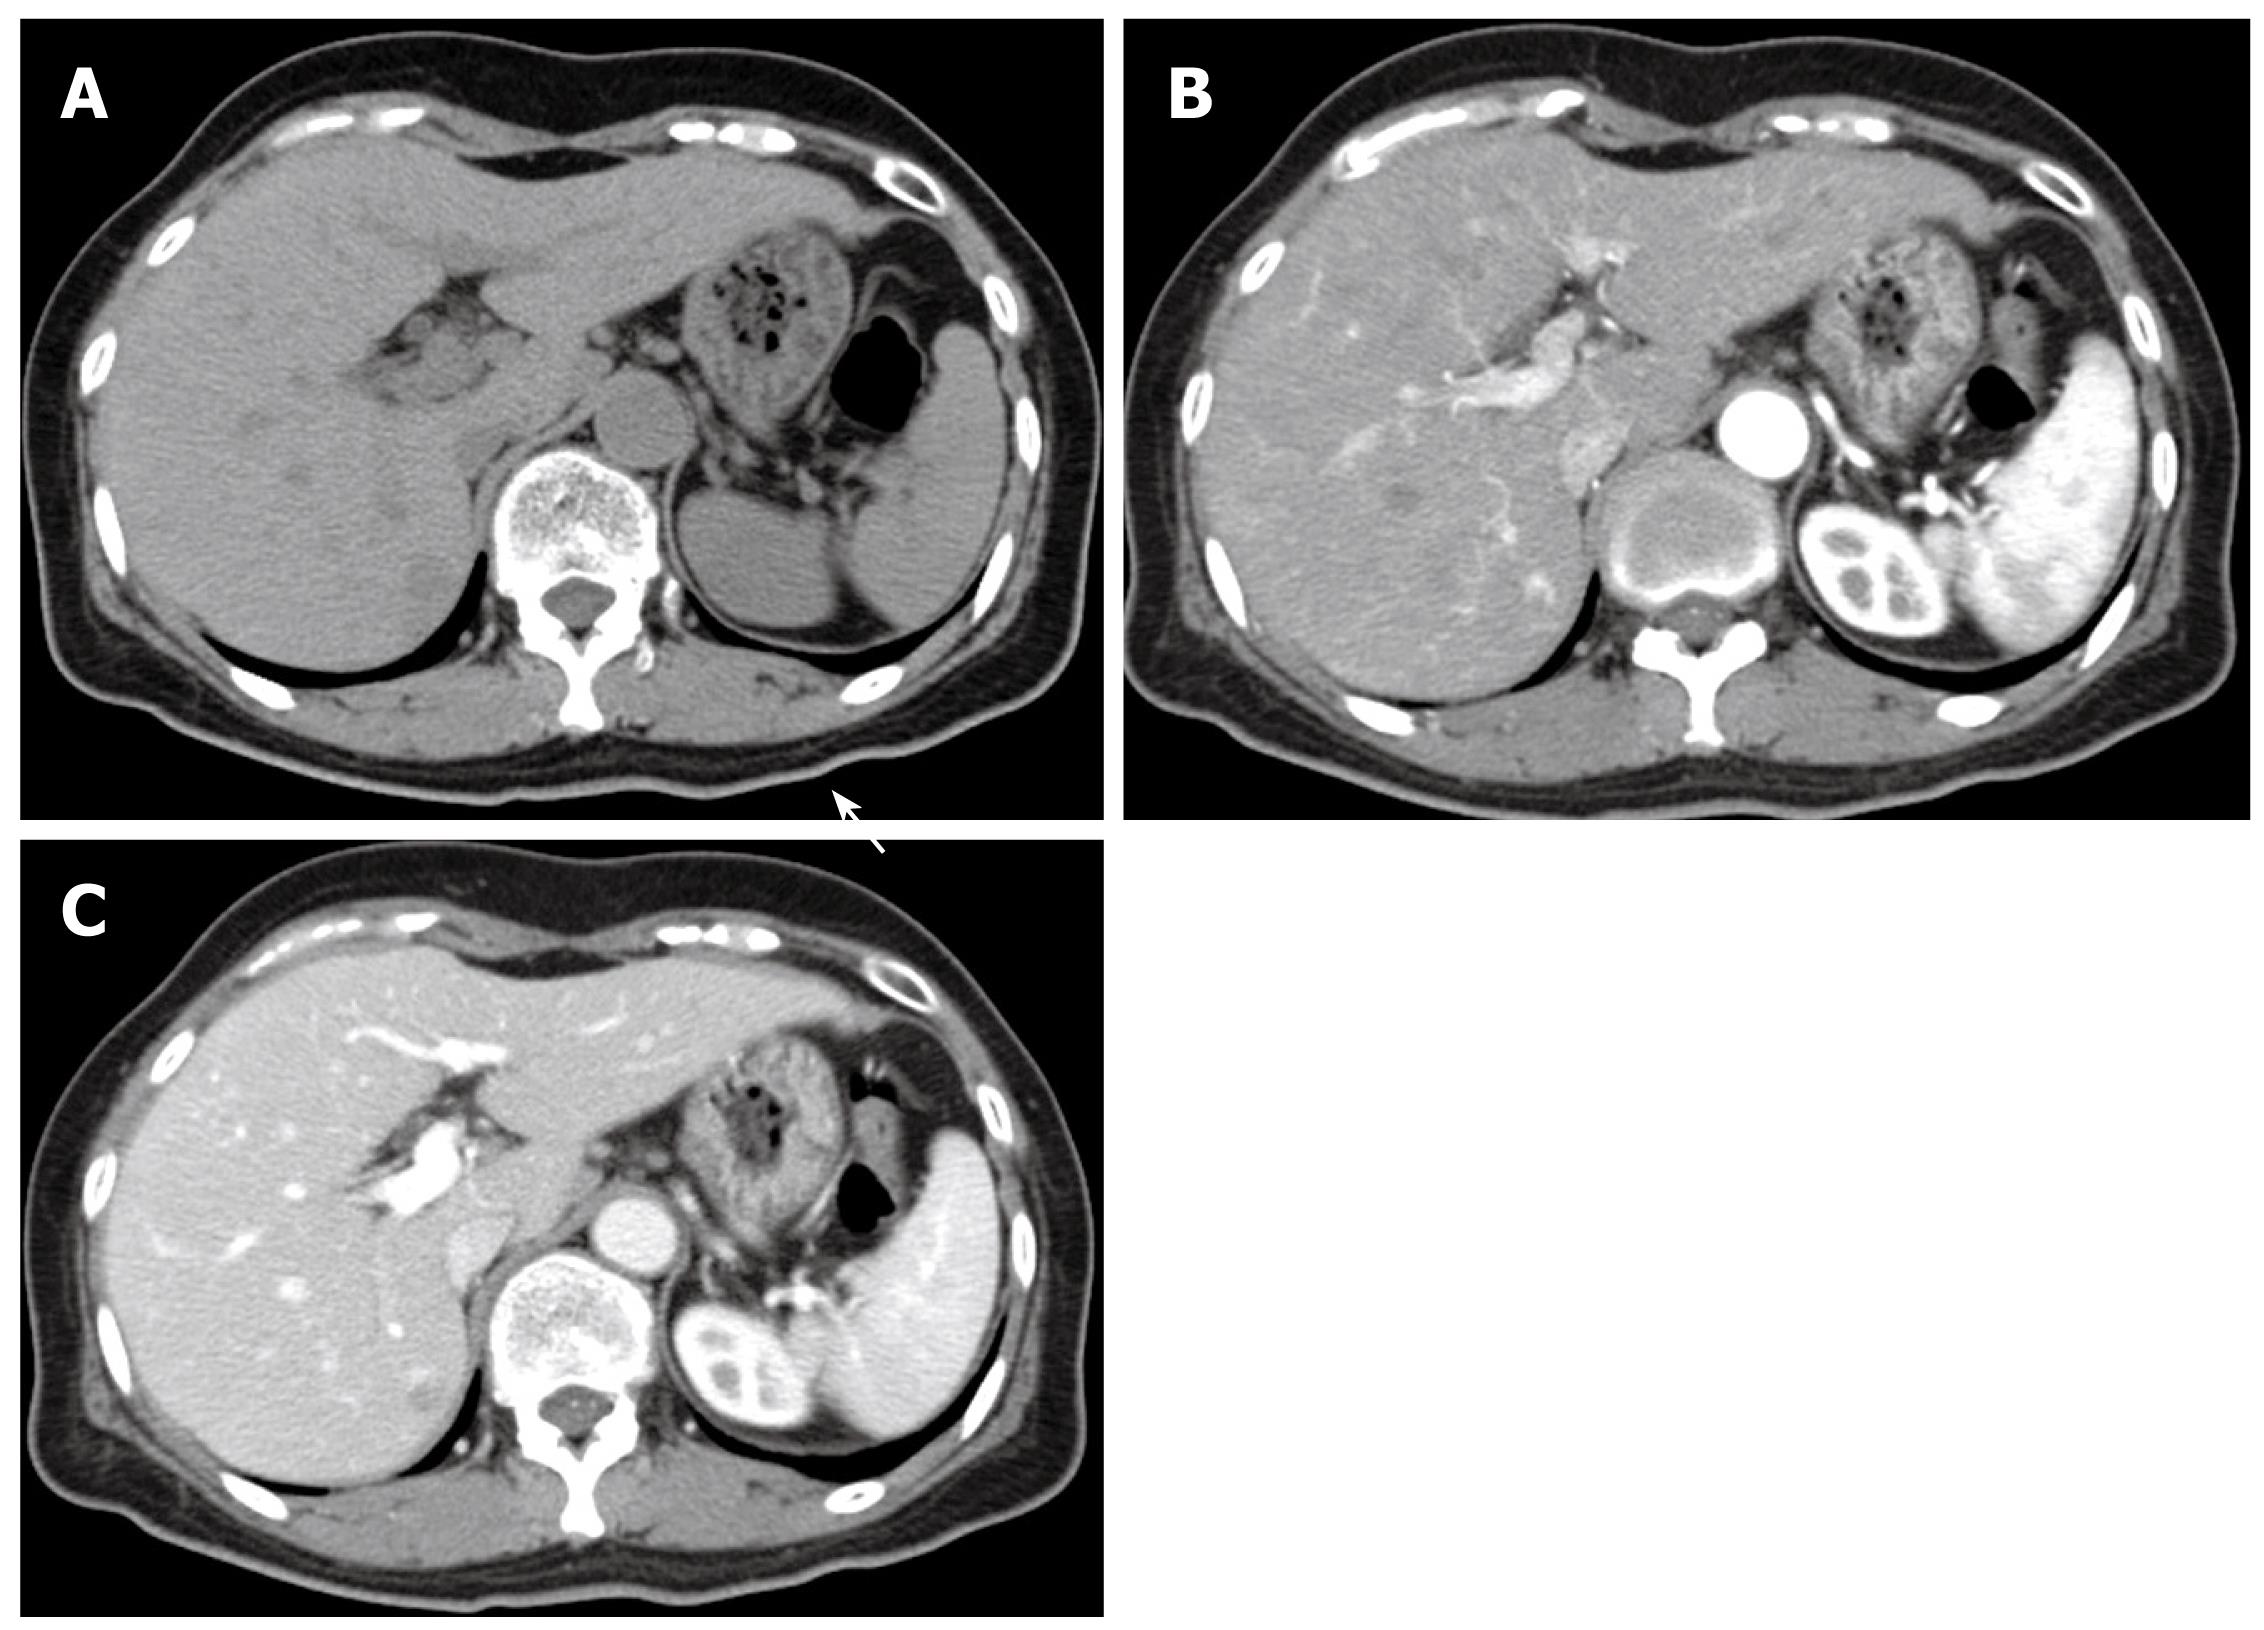
Figure 1 Computed tomography (CT) showing a 10 mm nodule in segment 7.
A: A hypodense nodule in plane phase; B: A hyperdense nodule in the early phase after injection of contrast medium; C: A hypodense nodule in the late phase after injection of contrast medium.
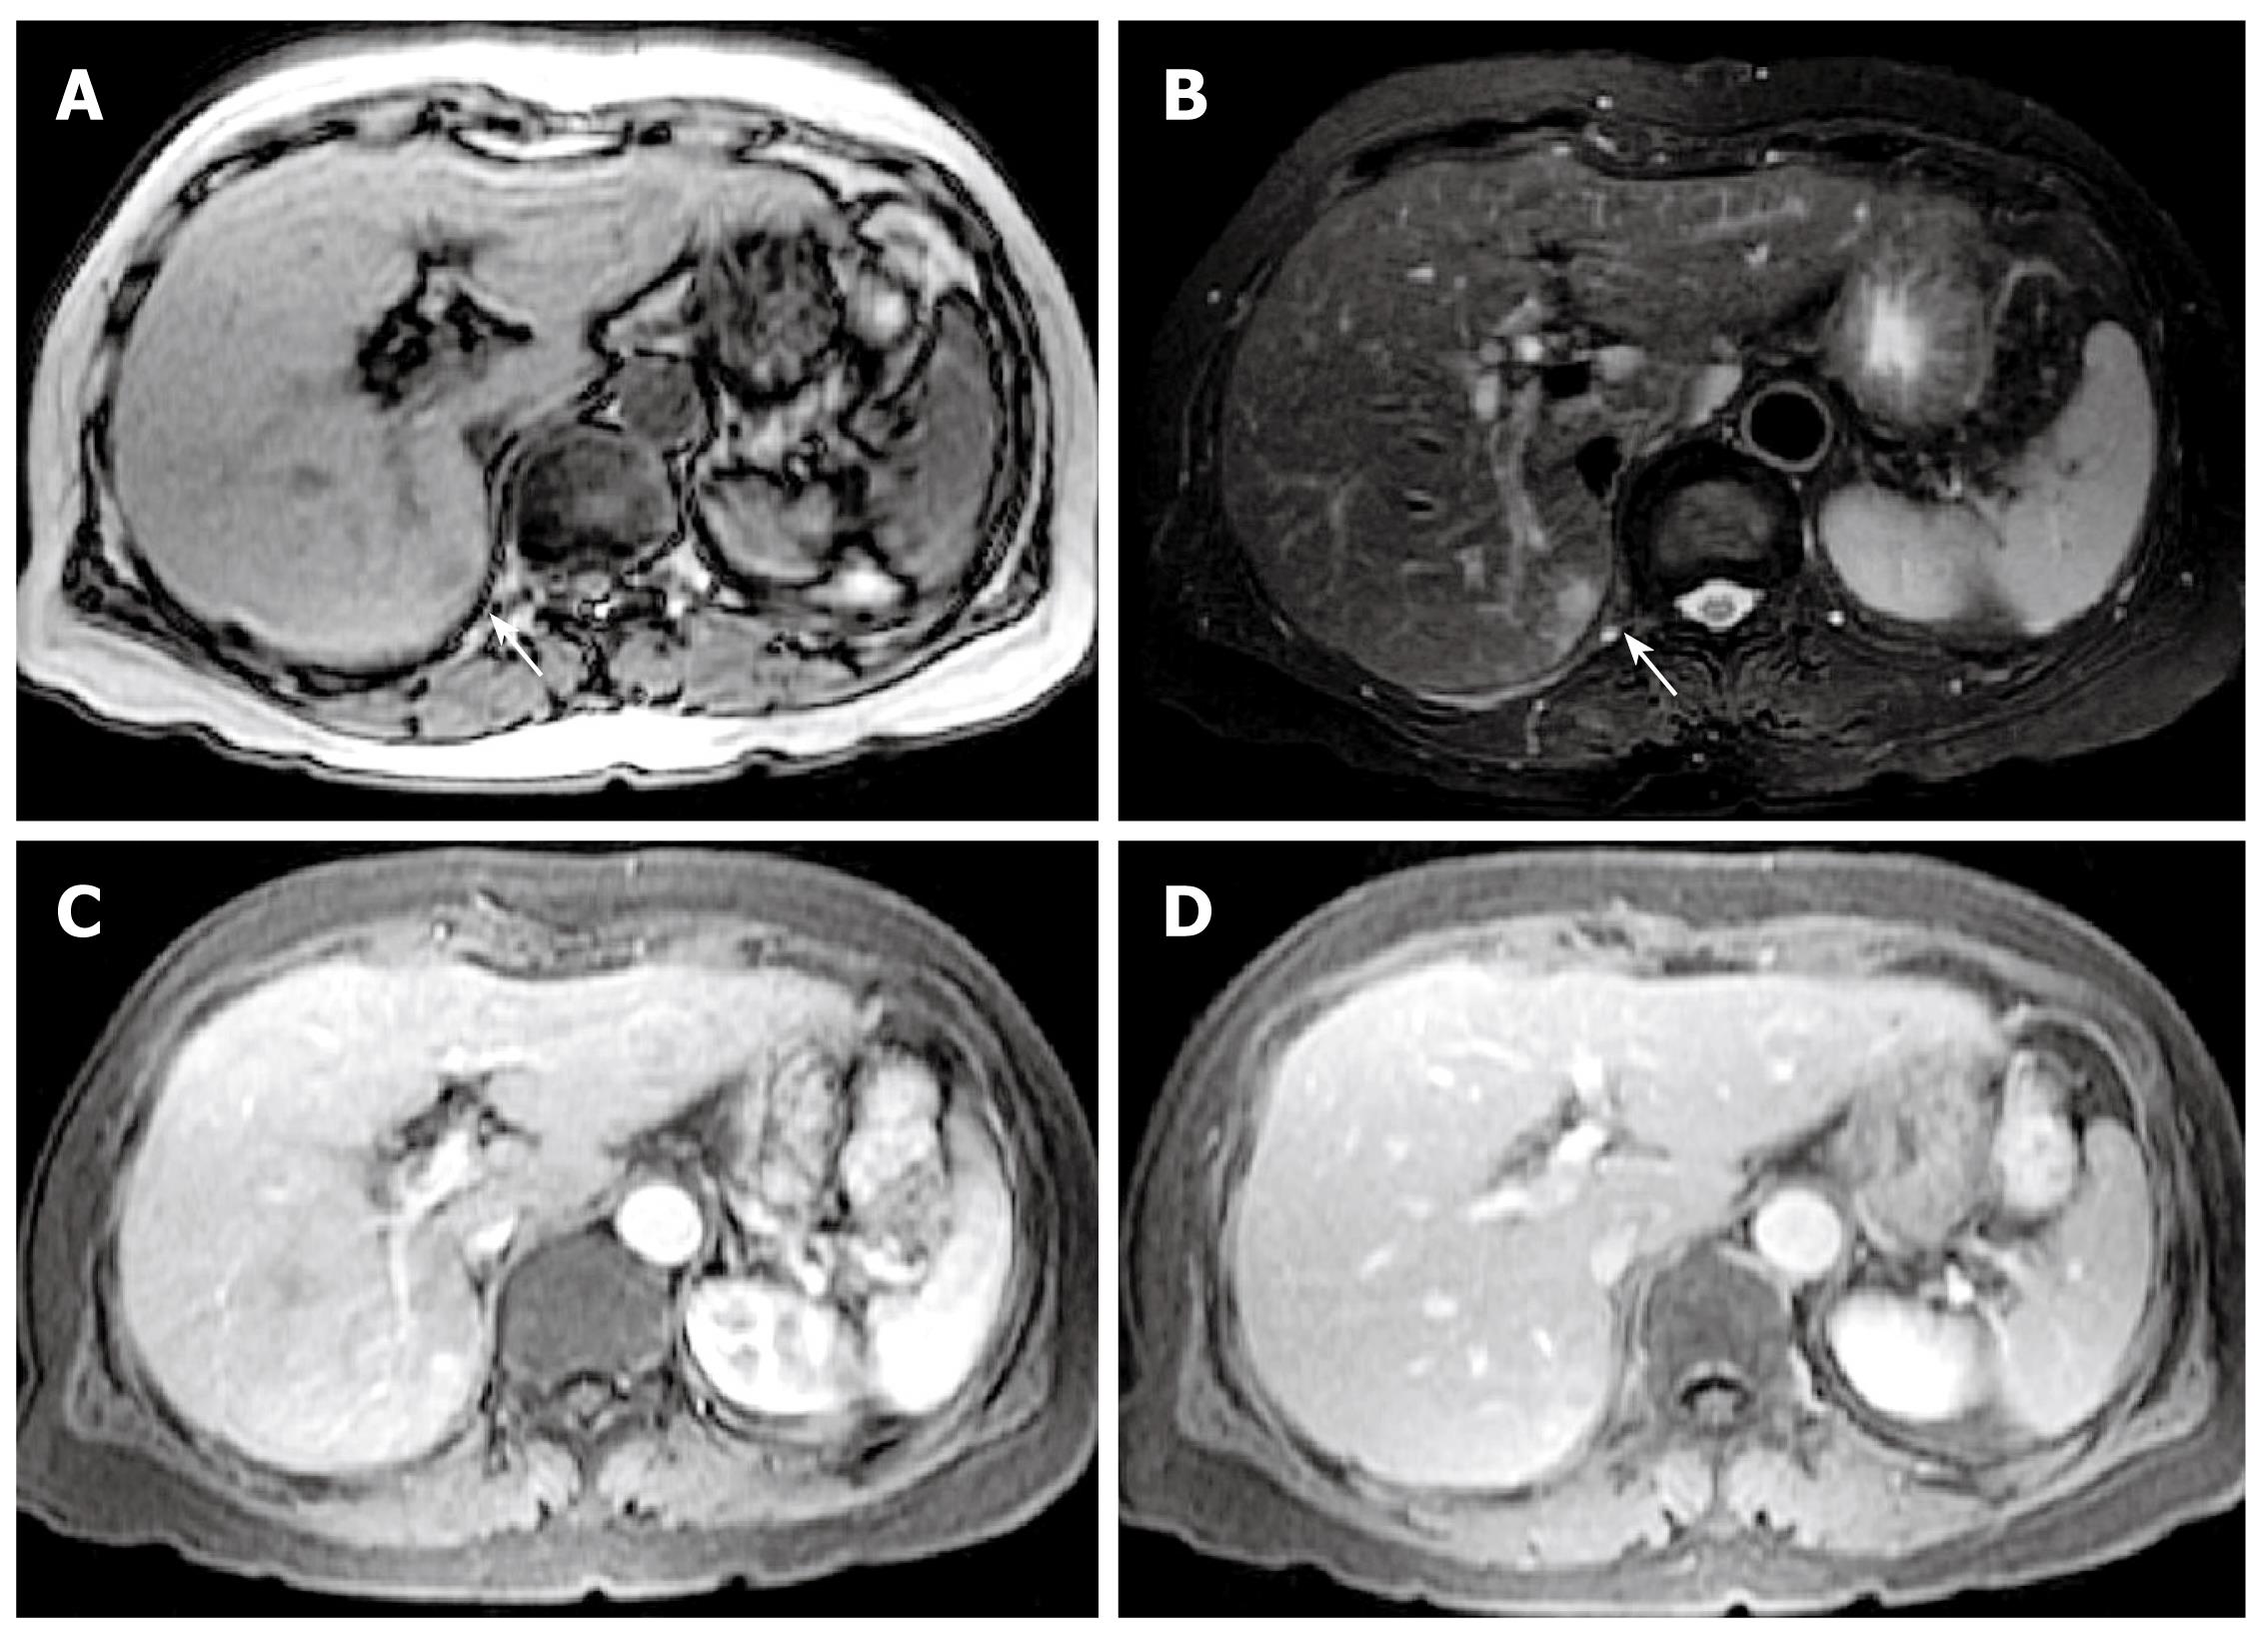
Figure 2 Magnetic resonance imaging (MRI) showing a 10 mm nodule in segment 7.
A: A hypointense nodule on T1-weighted images; B: A hyperintense nodule on T2-weighted images; C: A hyperintense nodule in the early phase after injection of contrast medium; D: A hypointense nodule in the late phase after injection of contrast medium.
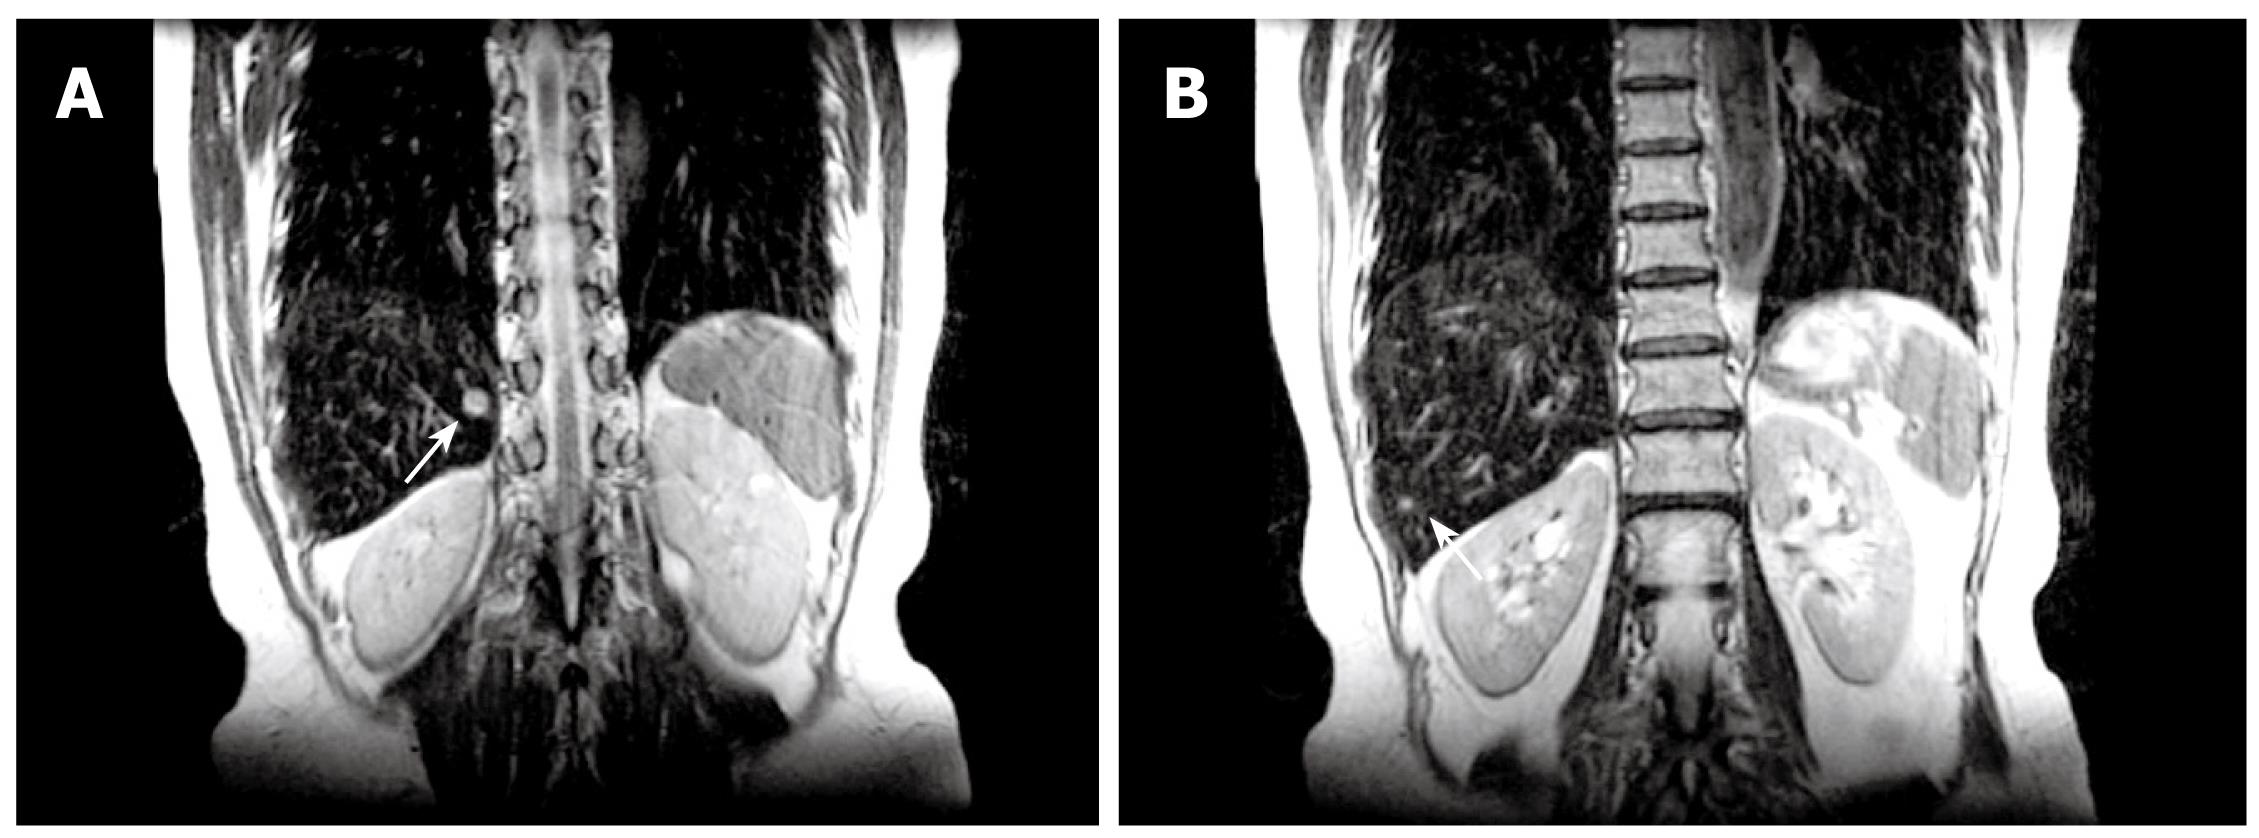
Figure 3 Superparamagnetic iron oxide-enhanced MRI showing hyperintense nodules.
A: 10 mm nodule in segment 7; B: 4 mm nodule in segment 6.
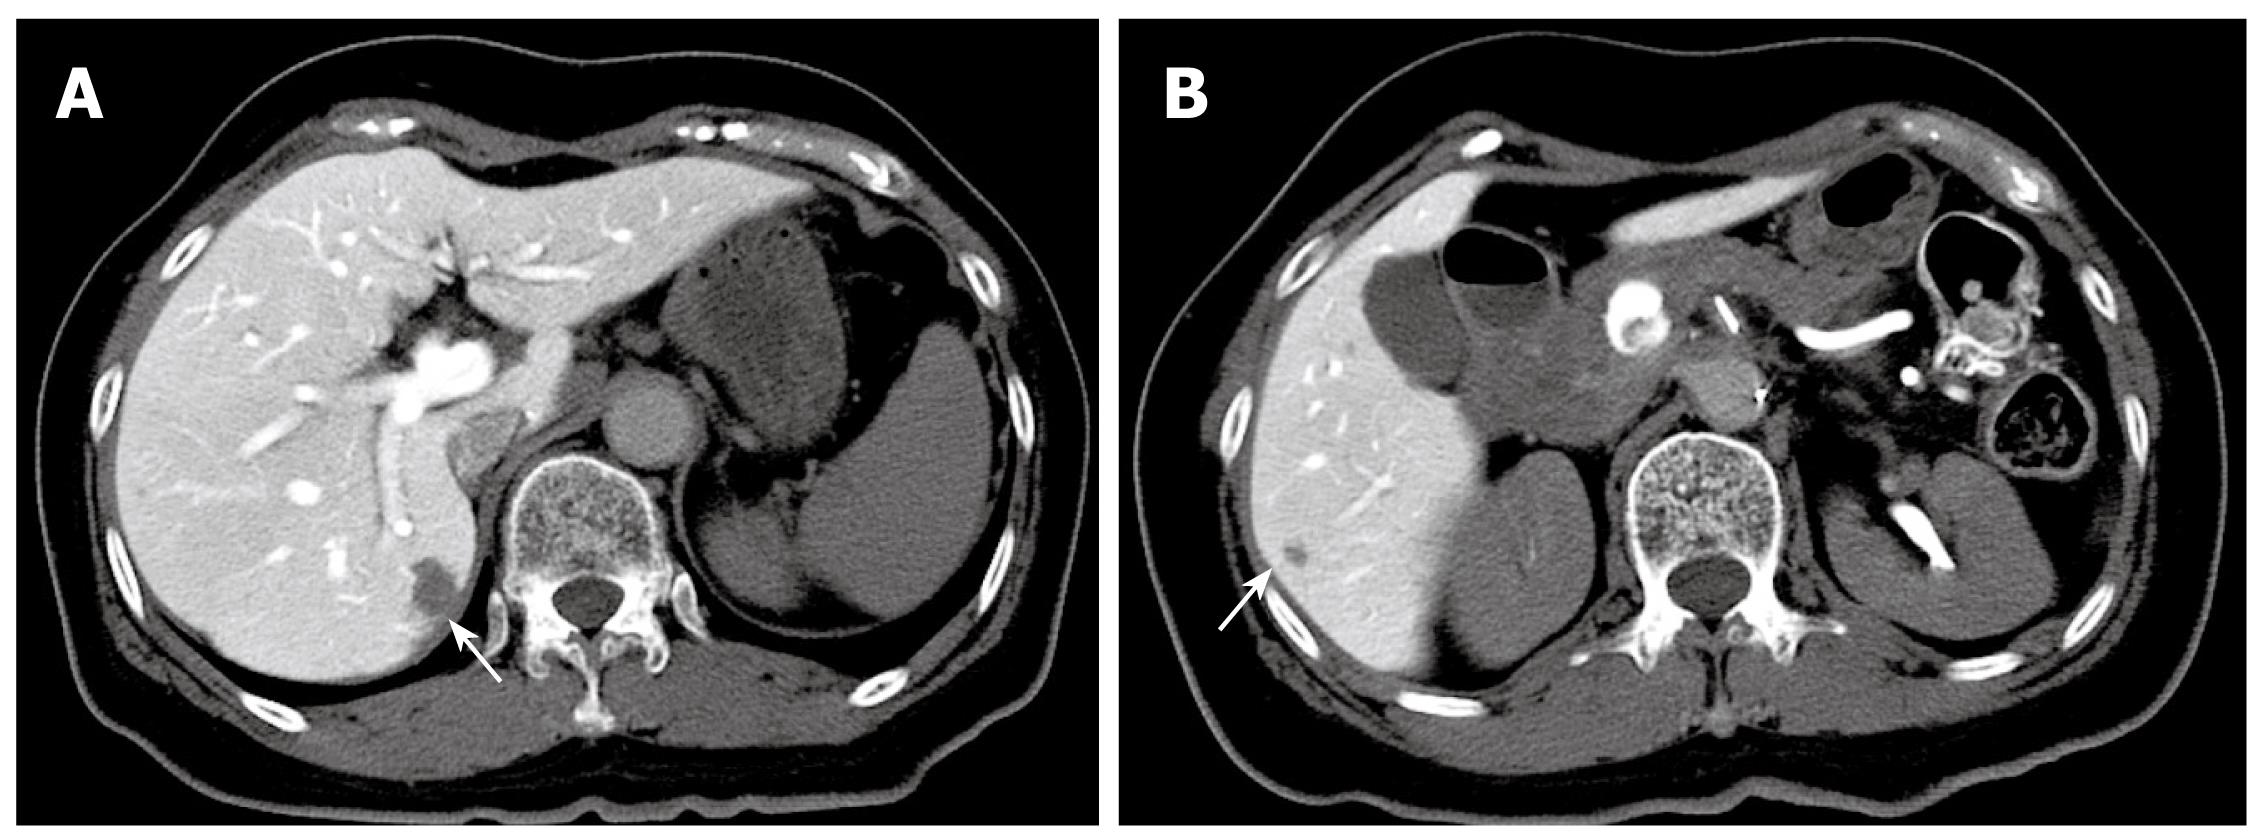
Figure 4 CT during arterial portography showing hypointense nodules.
A: 10 mm nodule in segment 7; B: 4 mm nodule in segment 6.
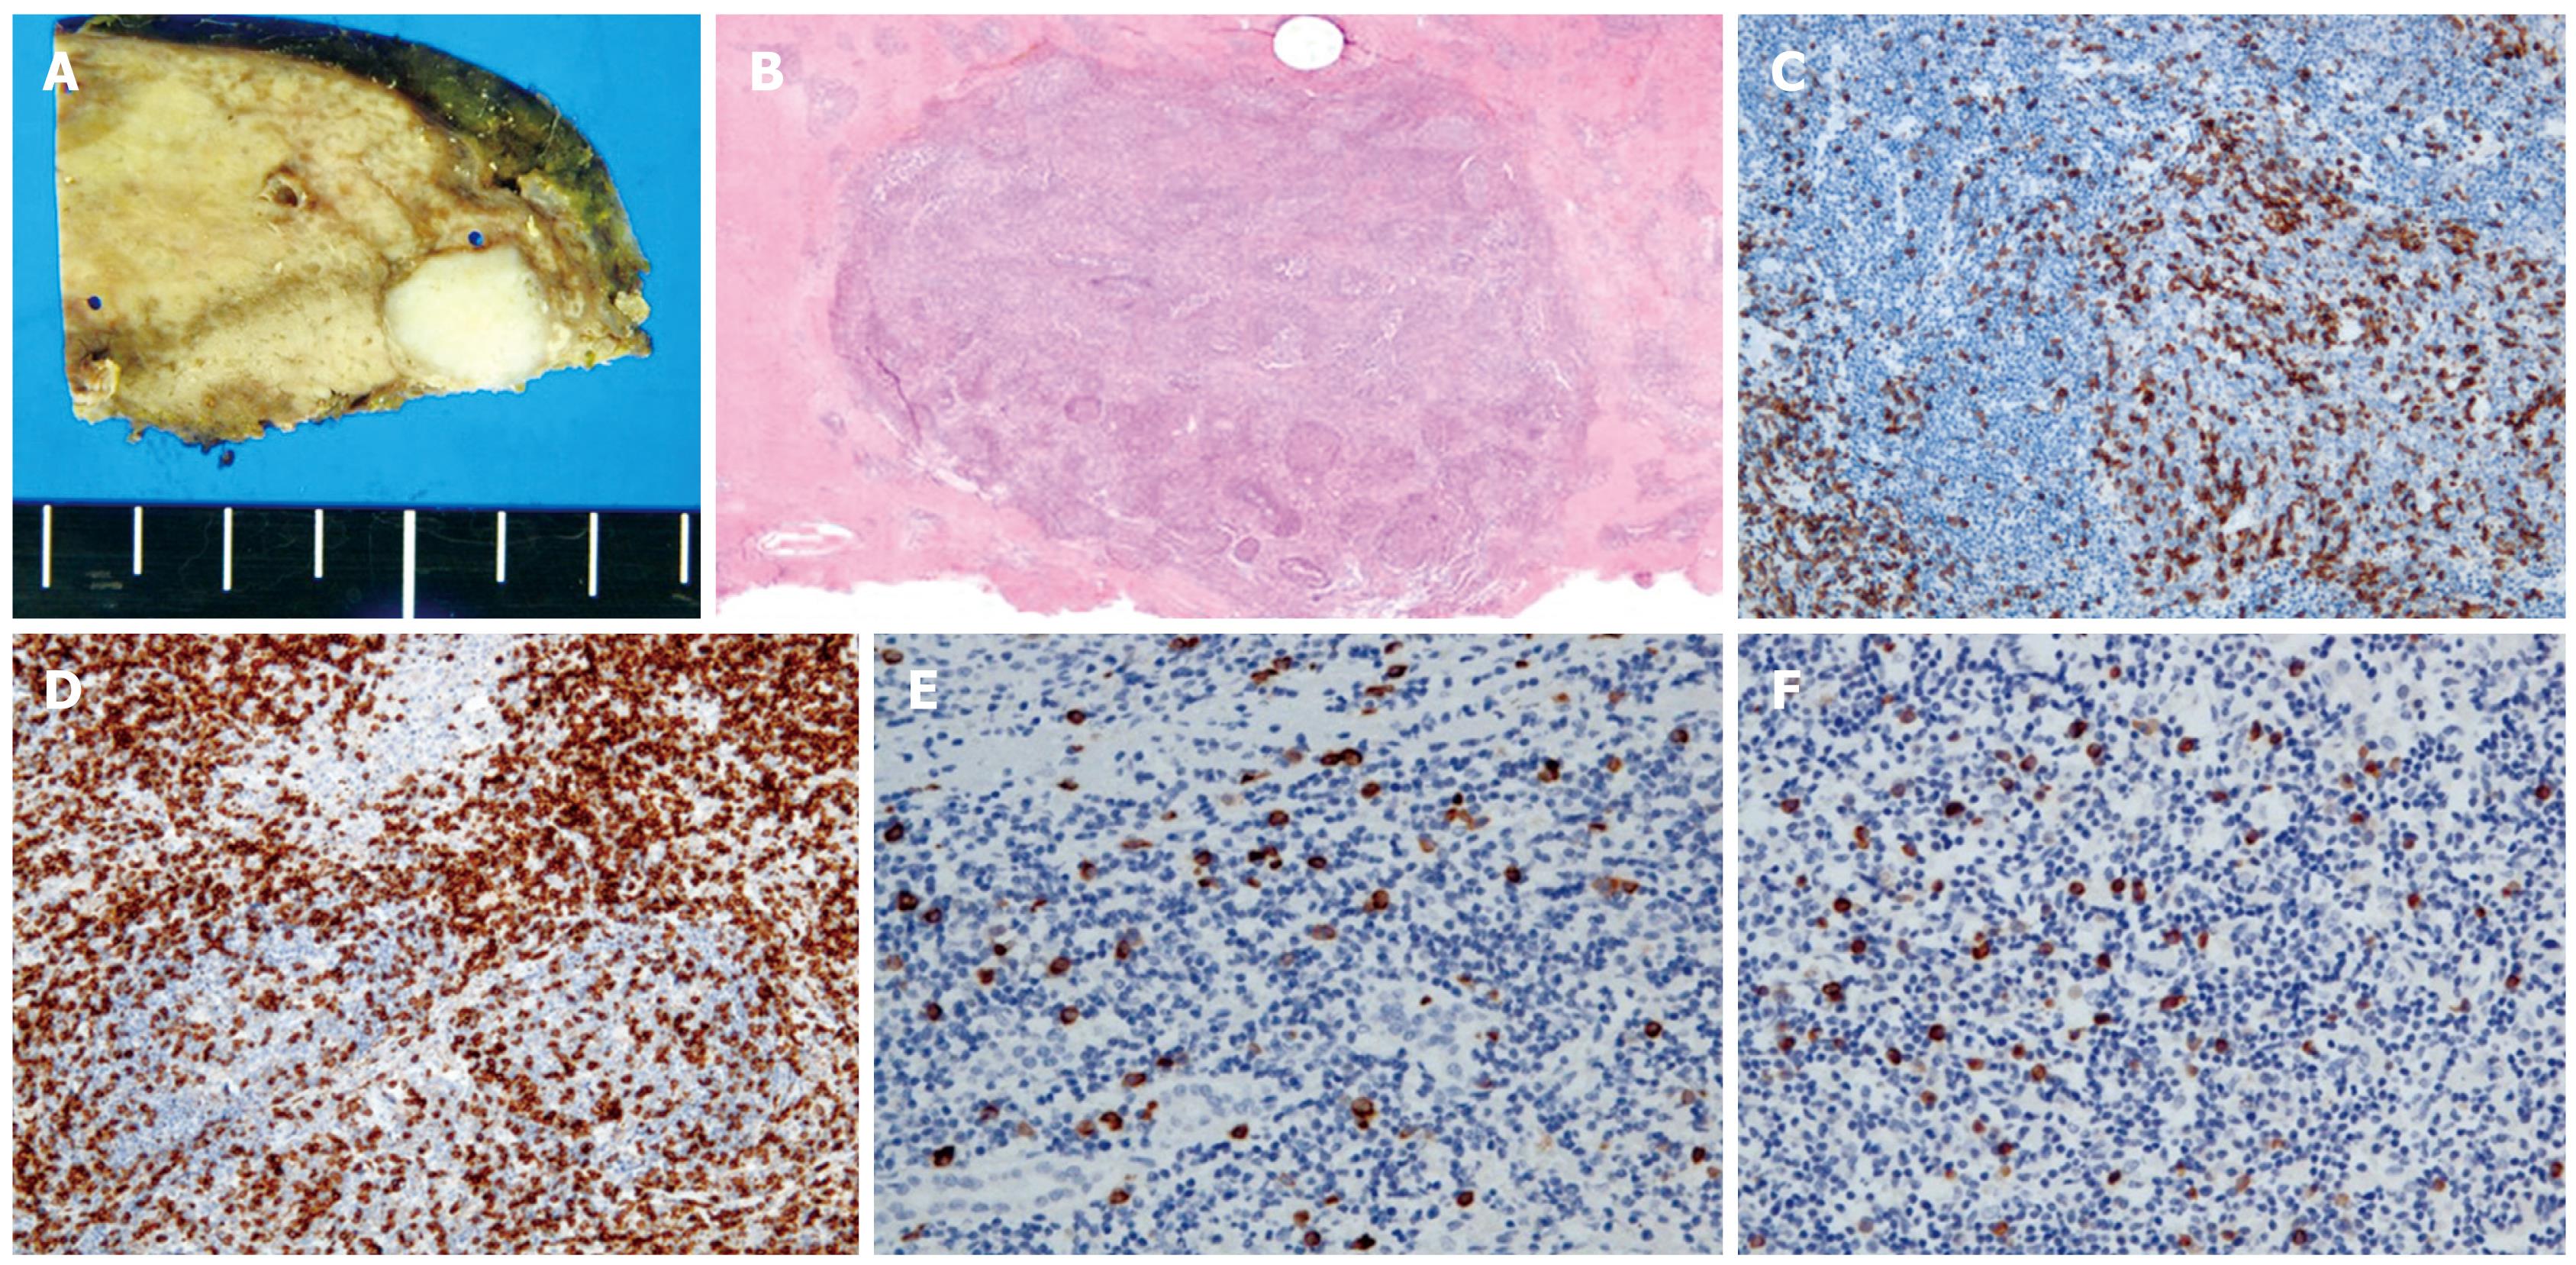
Figure 5 The pathological findings of the lesions.
A: Macroscopically, the lesion was white and hard with a clear margin (a lesion in segment 7); B: Microscopically, the lesion consisted of a nodular lymphoid infiltrate with germinal centers (a lesion in segment 7), HE stain (× 40); Lymphocytes in the lesions consisted of CD3-positive T-cells (C) and CD20-positive B-cells (D), Both × 100; E: Stained for κ light chains with in situ hybridization (× 200); F: Stained for λ light chains with in situ hybridization (× 200).
- Citation: Okada T, Mibayashi H, Hasatani K, Hayashi Y, Tsuji S, Kaneko Y, Yoshimitsu M, Tani T, Zen Y, Yamagishi M. Pseudolymphoma of the liver associated with primary biliary cirrhosis: A case report and review of literature. World J Gastroenterol 2009; 15(36): 4587-4592
- URL: https://www.wjgnet.com/1007-9327/full/v15/i36/4587.htm
- DOI: https://dx.doi.org/10.3748/wjg.15.4587


