Copyright
©2009 The WJG Press and Baishideng.
World J Gastroenterol. Sep 28, 2009; 15(36): 4571-4575
Published online Sep 28, 2009. doi: 10.3748/wjg.15.4571
Published online Sep 28, 2009. doi: 10.3748/wjg.15.4571
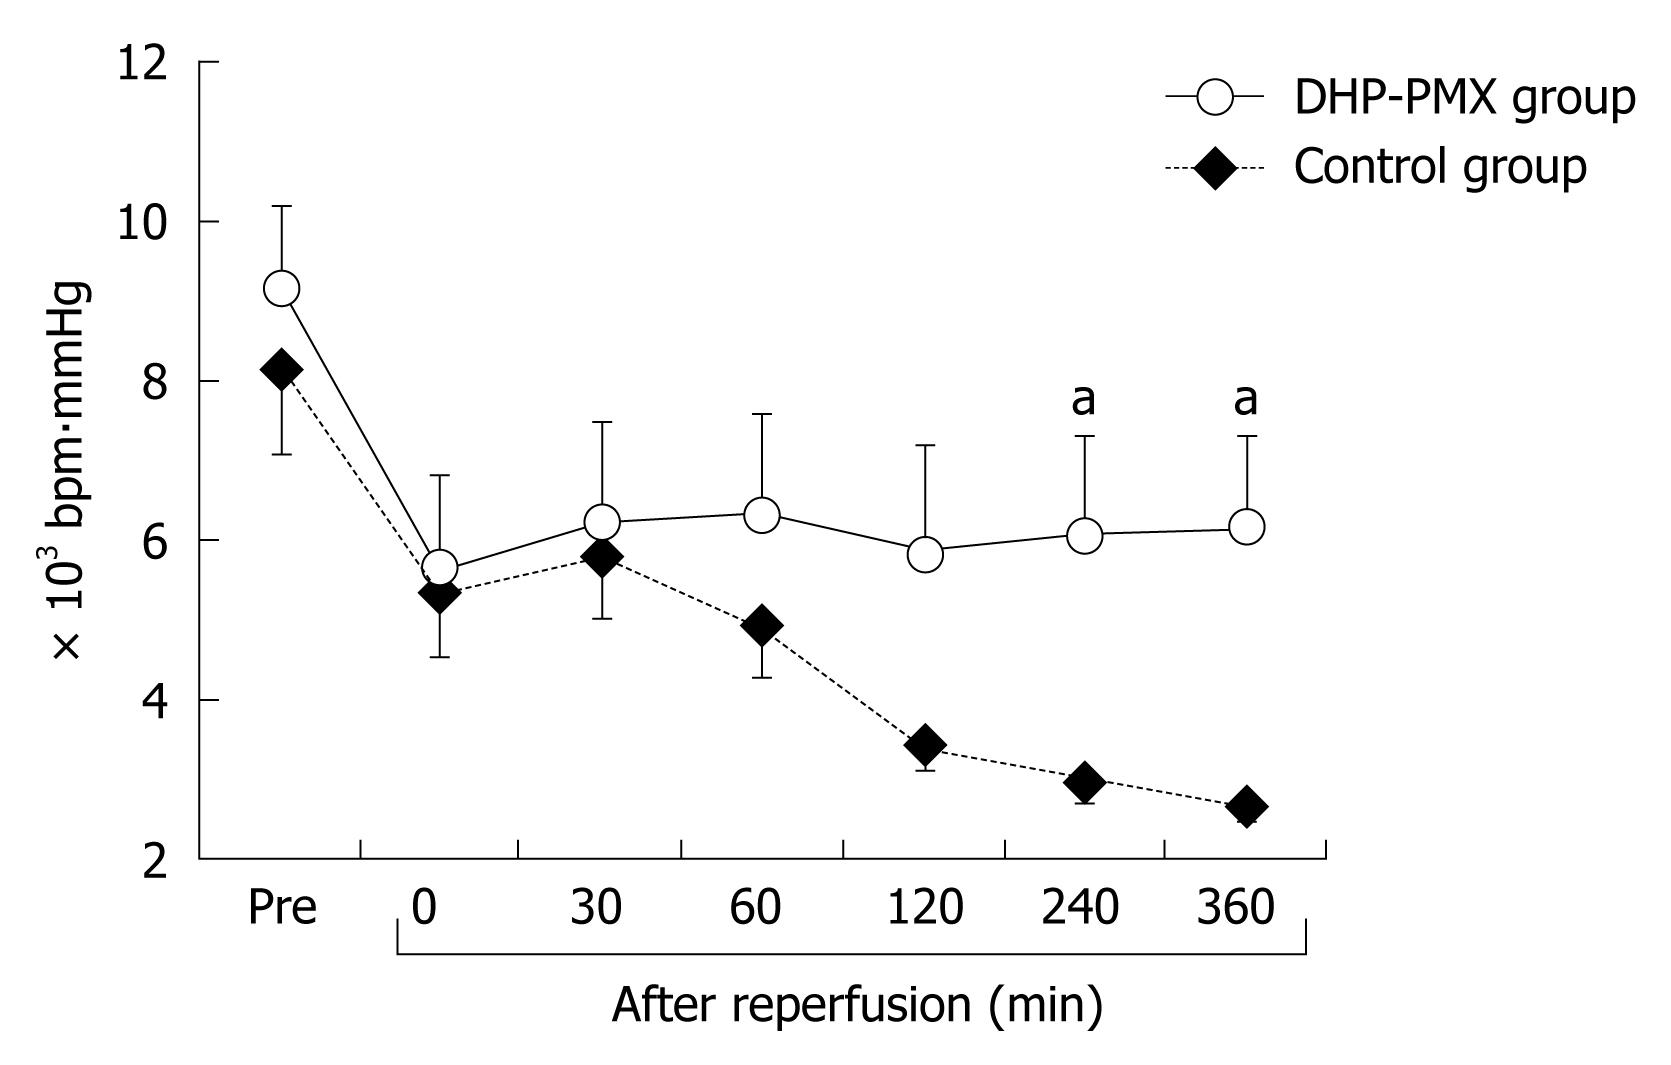
Figure 1 The rate pressure product (RPP: heart rate × systolic arterial blood pressure) before ischemia (pre) and immediately (0 min) and 30, 60, 120, 240 and 360 min after reperfusion.
Data are expressed as the mean ± SE. aP < 0.05 vs the control group.
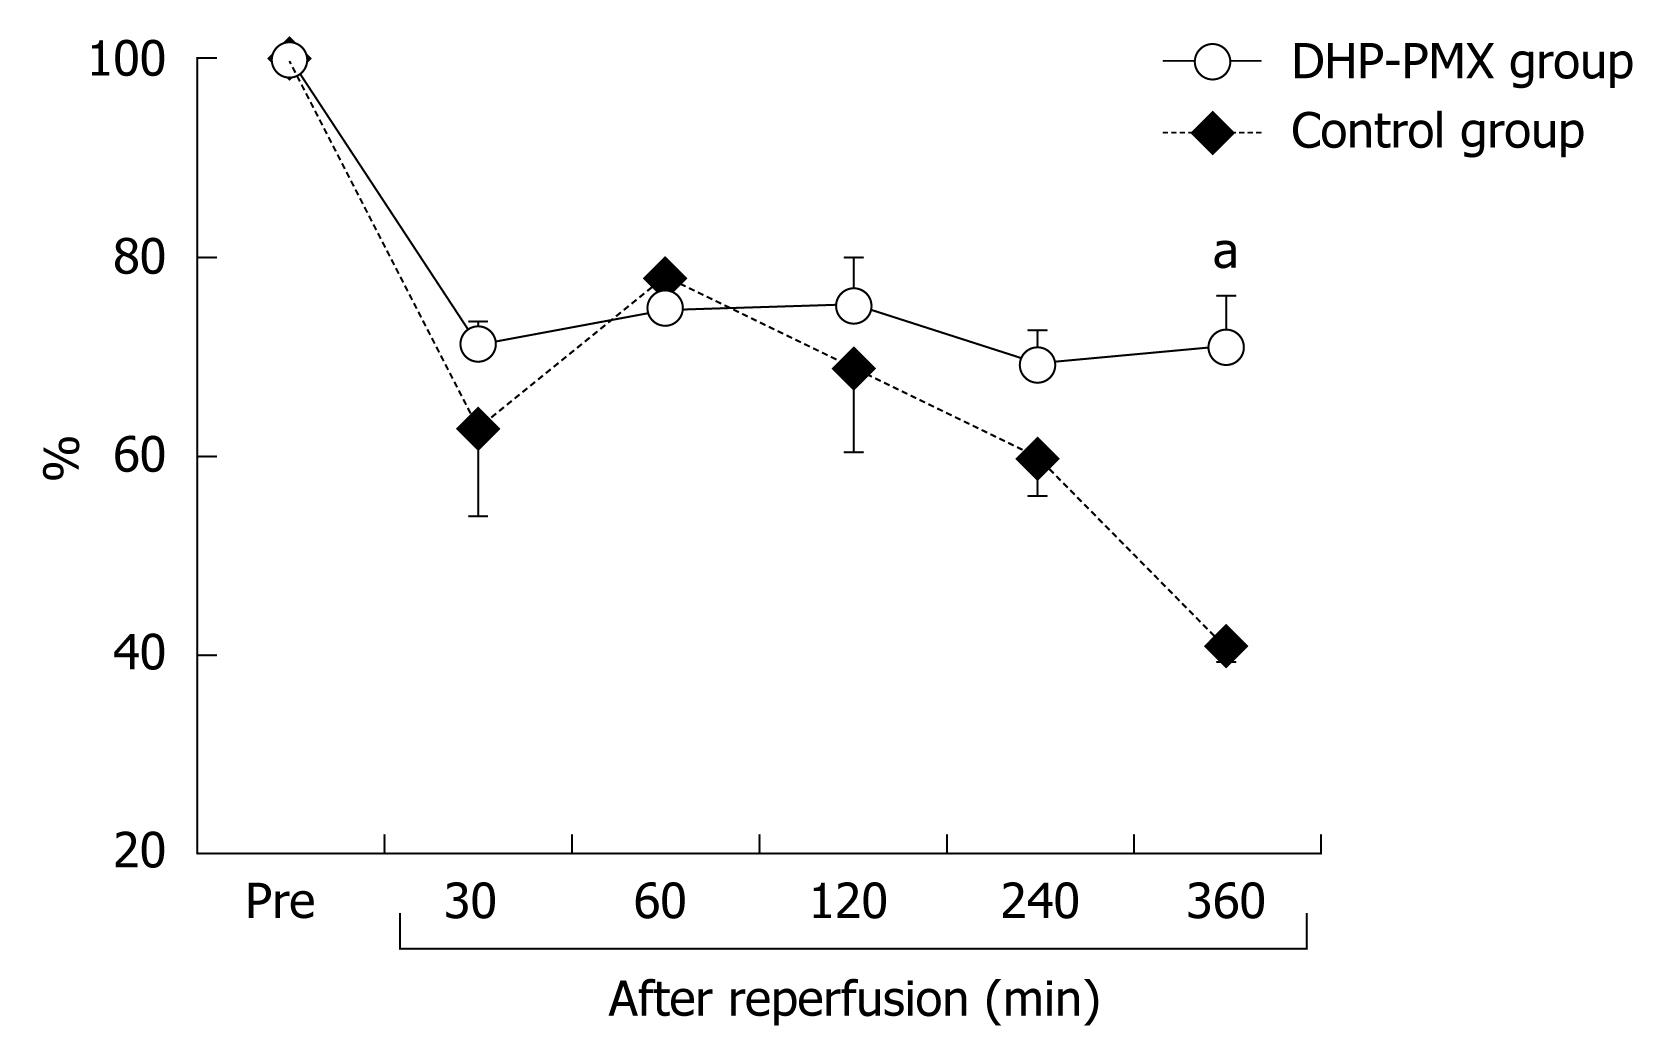
Figure 2 The hepatic tissue blood flow (HTBF) before ischemia (pre) and immediately (0 min) and 30, 60, 120, 240 and 360 min after reperfusion.
The HTBF was evaluated as a percentage of the flow before ischemia. Data are expressed as the mean ± SE. aP < 0.05 vs the control group.
Figure 3 The portal vein blood flow (PVBF) before ischemia (pre) and 30, 60, 120, 240 and 360 min after reperfusion.
The PVBF was evaluated as a percentage of the flow before ischemia. Data are expressed as the mean ± SE. aP < 0.05 vs the control group.
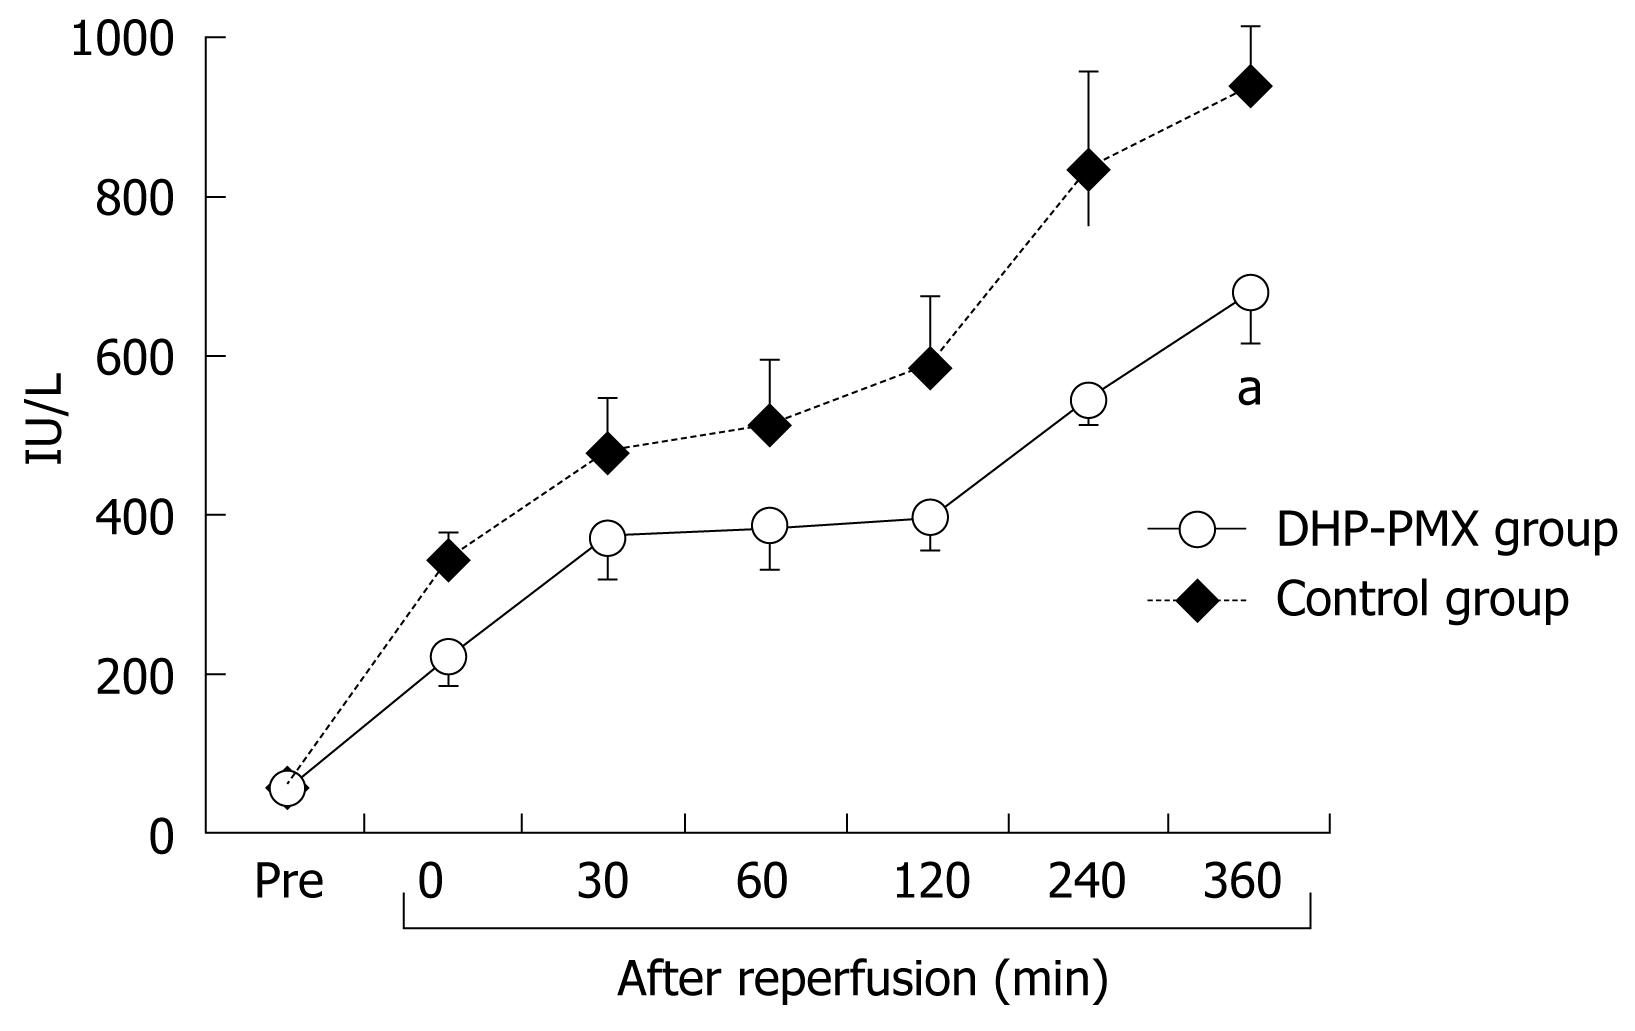
Figure 4 The serum AST before ischemia (pre) and immediately (0 min) and 30, 60, 120, 240 and 360 min after reperfusion.
Data are expressed as the mean ± SE. aP < 0.05 vs the control group.
- Citation: Sato H, Oshima K, Kobayashi K, Yamazaki H, Suto Y, Takeyoshi I. Hemoperfusion with polymyxin B-immobilized fiber column improves liver function after ischemia-reperfusion injury. World J Gastroenterol 2009; 15(36): 4571-4575
- URL: https://www.wjgnet.com/1007-9327/full/v15/i36/4571.htm
- DOI: https://dx.doi.org/10.3748/wjg.15.4571


