Copyright
©2009 The WJG Press and Baishideng.
World J Gastroenterol. Sep 28, 2009; 15(36): 4547-4555
Published online Sep 28, 2009. doi: 10.3748/wjg.15.4547
Published online Sep 28, 2009. doi: 10.3748/wjg.15.4547
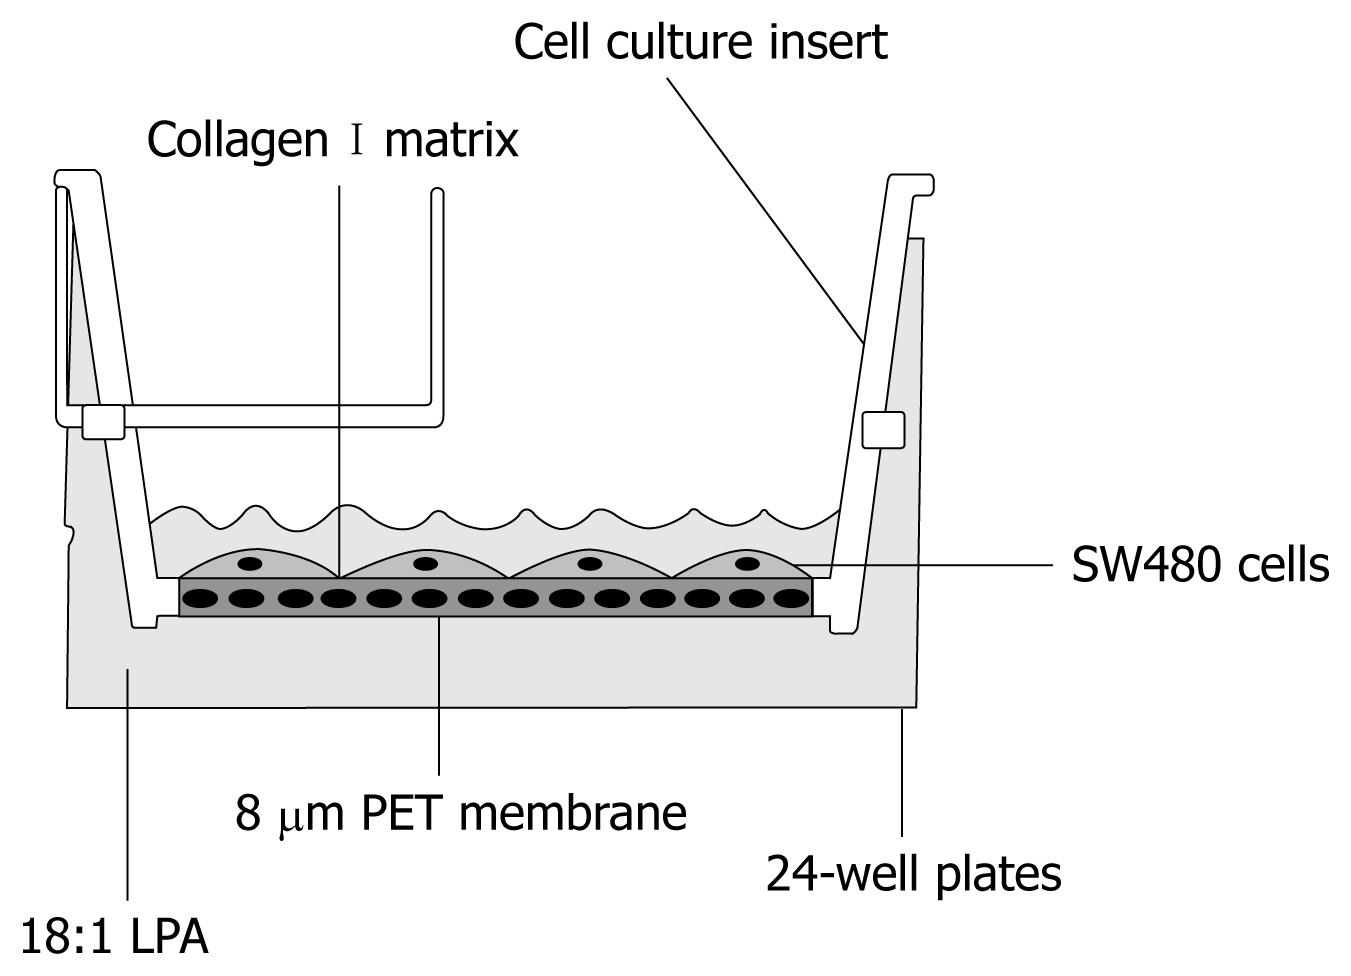
Figure 1 Costar transwell cell culture chamber inserts.
Figure 2 LPA effect on SW480 cell proliferation.
Results presented as mean ± SE, n = 5. A: Dose and time effect of LPA on the proliferation of SW480 cells. SW480 cells were starved in serum-free DMEM for 12 h and treated with LPA at different doses. At different time points, MTT assay was performed to evaluate cell numbers. bP < 0.001 vs 0 μmol/L LPA; B: Inhibitors blocked LPA-induced cell proliferation. SW480 cells were starved in serum-free DMEM for 12 h and treated with LPA (10 μmol/L). Inhibitors including LY294002 (50 μmol/L), PD98059 (10 μmol/L), and Y-27632 (10 μmol/L) were applied to cells 30 min before the action of LPA. ninety-six hours later, MTT assay was performed to evaluate cell growth. bP < 0.001 vs 10 μmol/L LPA.
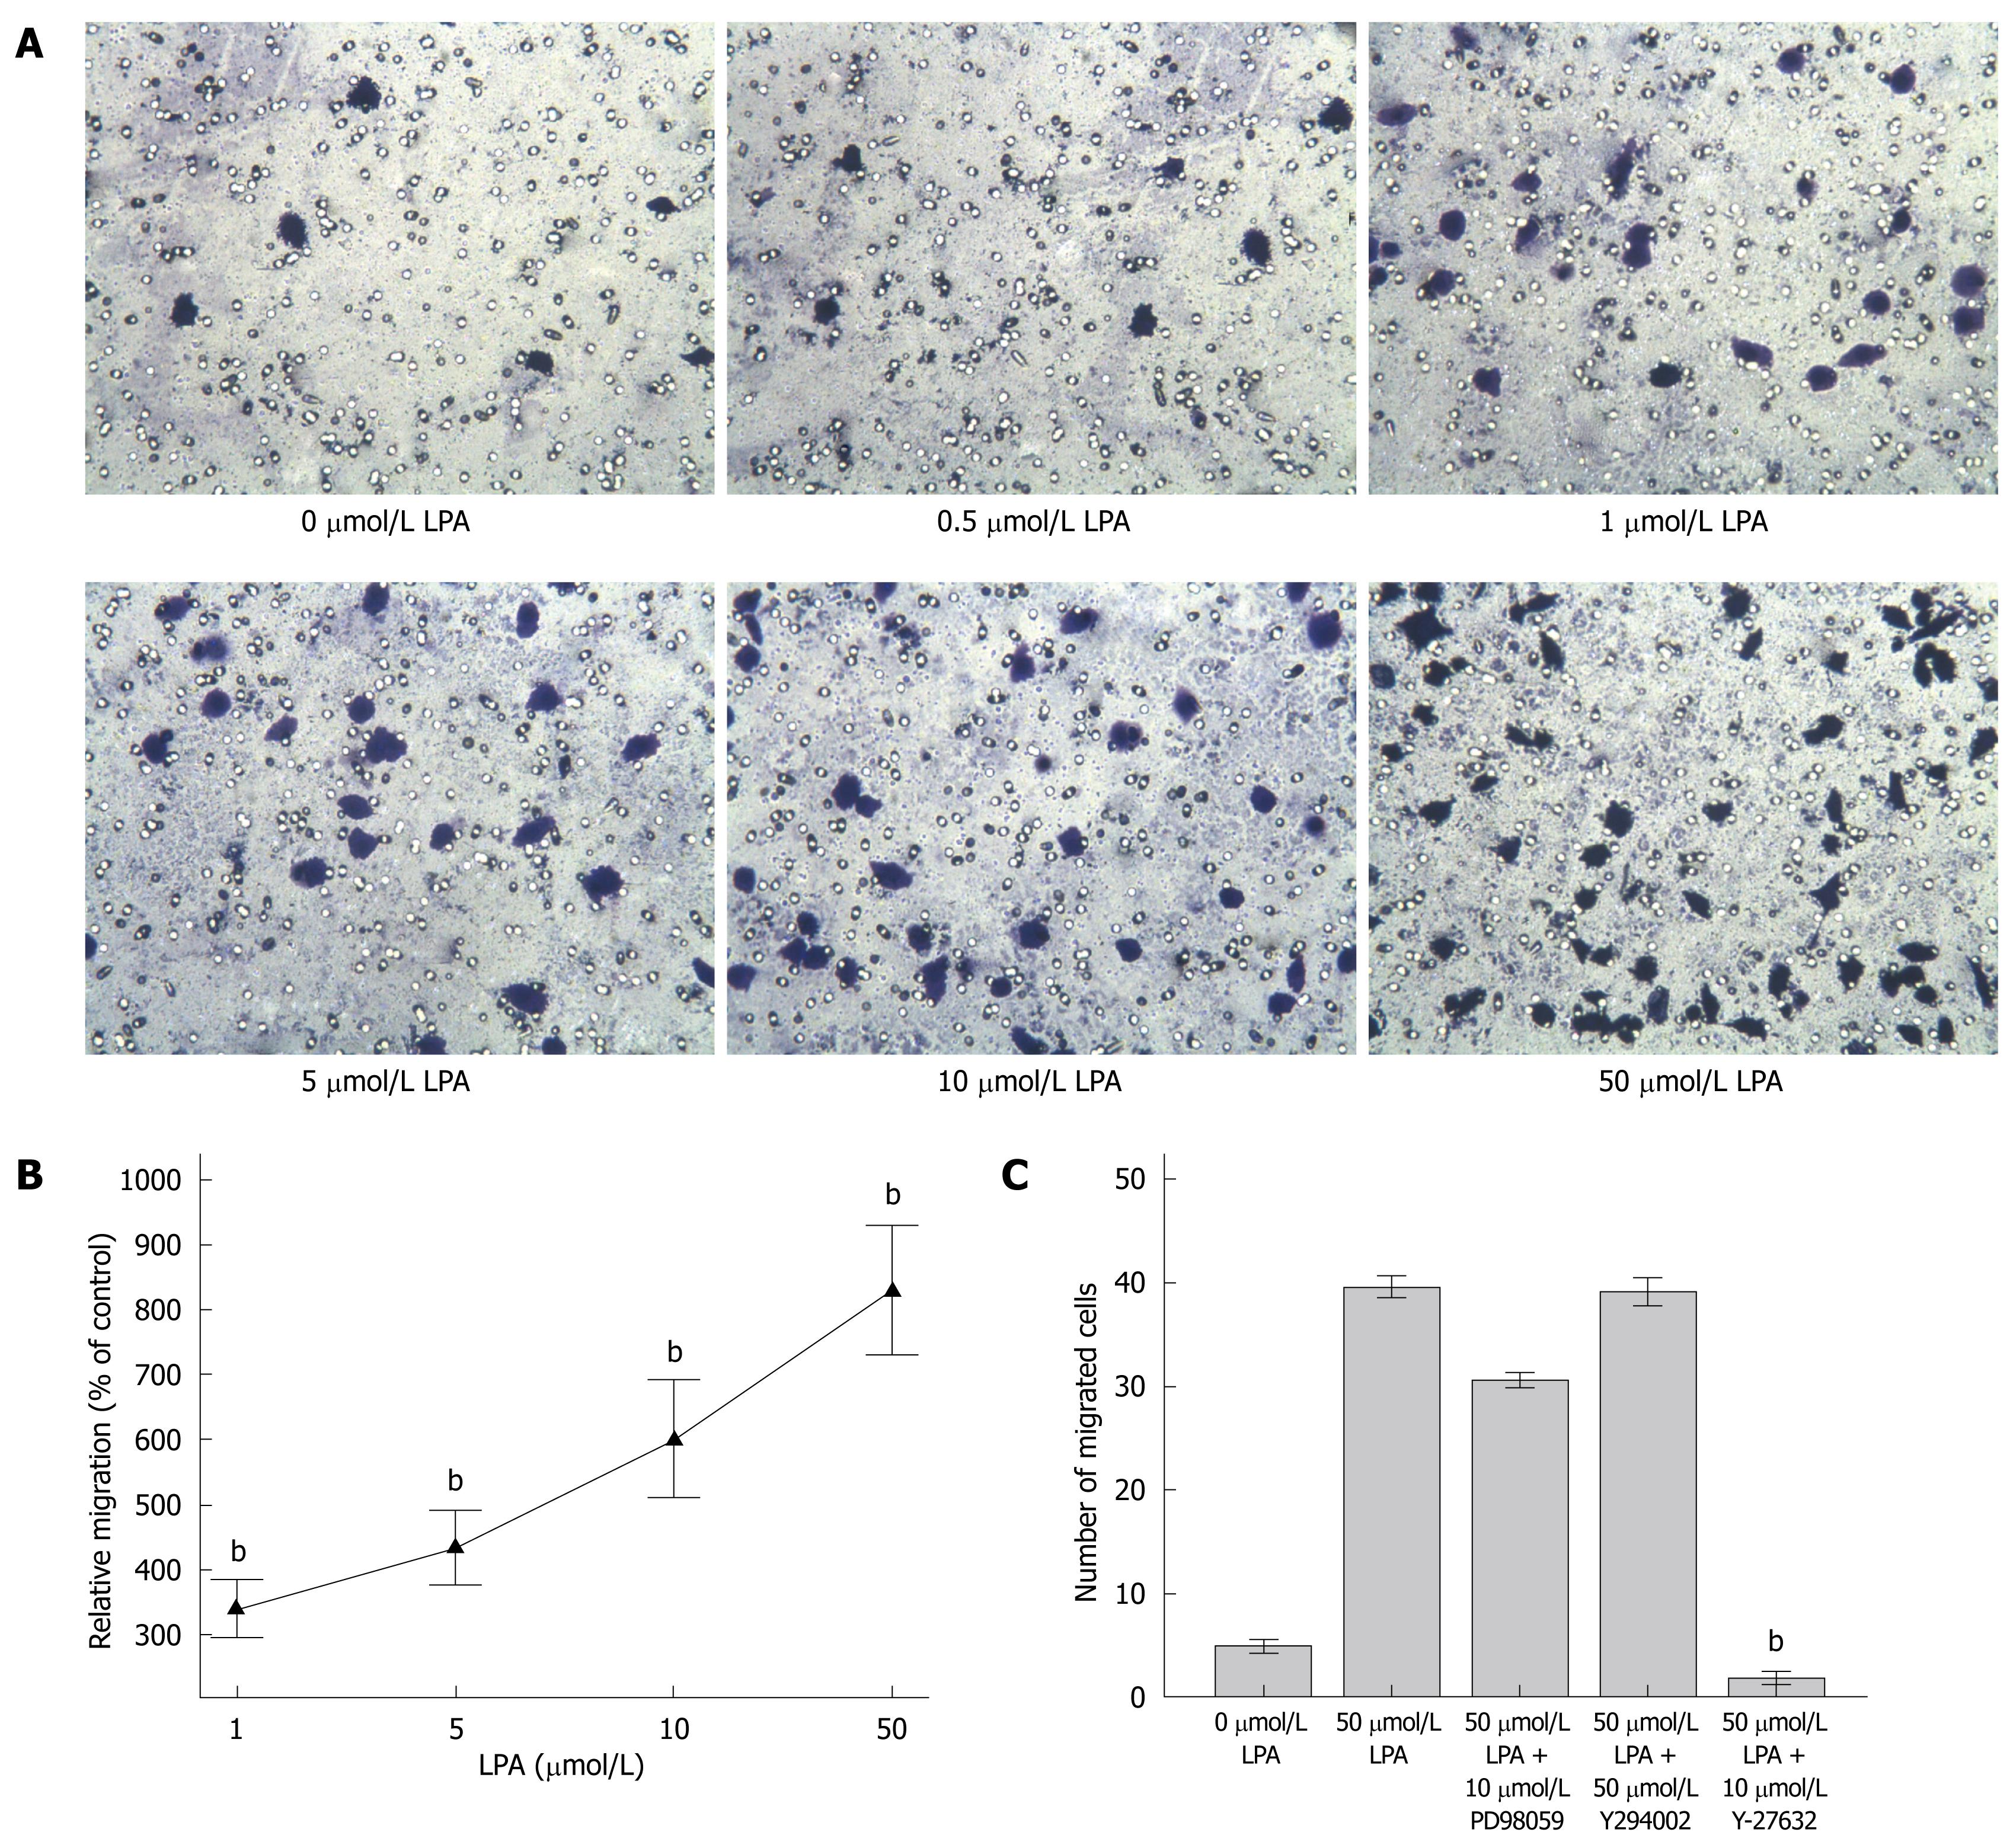
Figure 3 LPA stimulated migration of SW480 cells.
A: LPA stimulated migration of SW480 cells (× 200). SW480 cells (1 × 10⁵/100 μL) were seeded into the inserts of transwell chambers after starvation for 8 h. Cells were incubated at 37°C for 4 h. Cells on the outside surface of inserts were fixed and stained. Typical images are presented; B: Migrated cells were quantified and relative migration rates (mean ± SE) are presented. bP < 0.001 vs 0 μmol/L LPA; C: Effect of inhibitors on LPA-induced cell migration. 50 μmol/L LPA in 600 μL medium was added to the lower chamber of transwell. Inhibitors including 10 μmol/L PD98059, 50 μmol/L LY294002 and 10 μmol/L Y-27632 were added to cells in the upper chamber. Cells on the outside surface of inserts were fixed, stained, and quantified. Data were analyzed using one-way ANOVA with post-hoc t-tests. bP < 0.001 vs 50 μmol/L LPA.
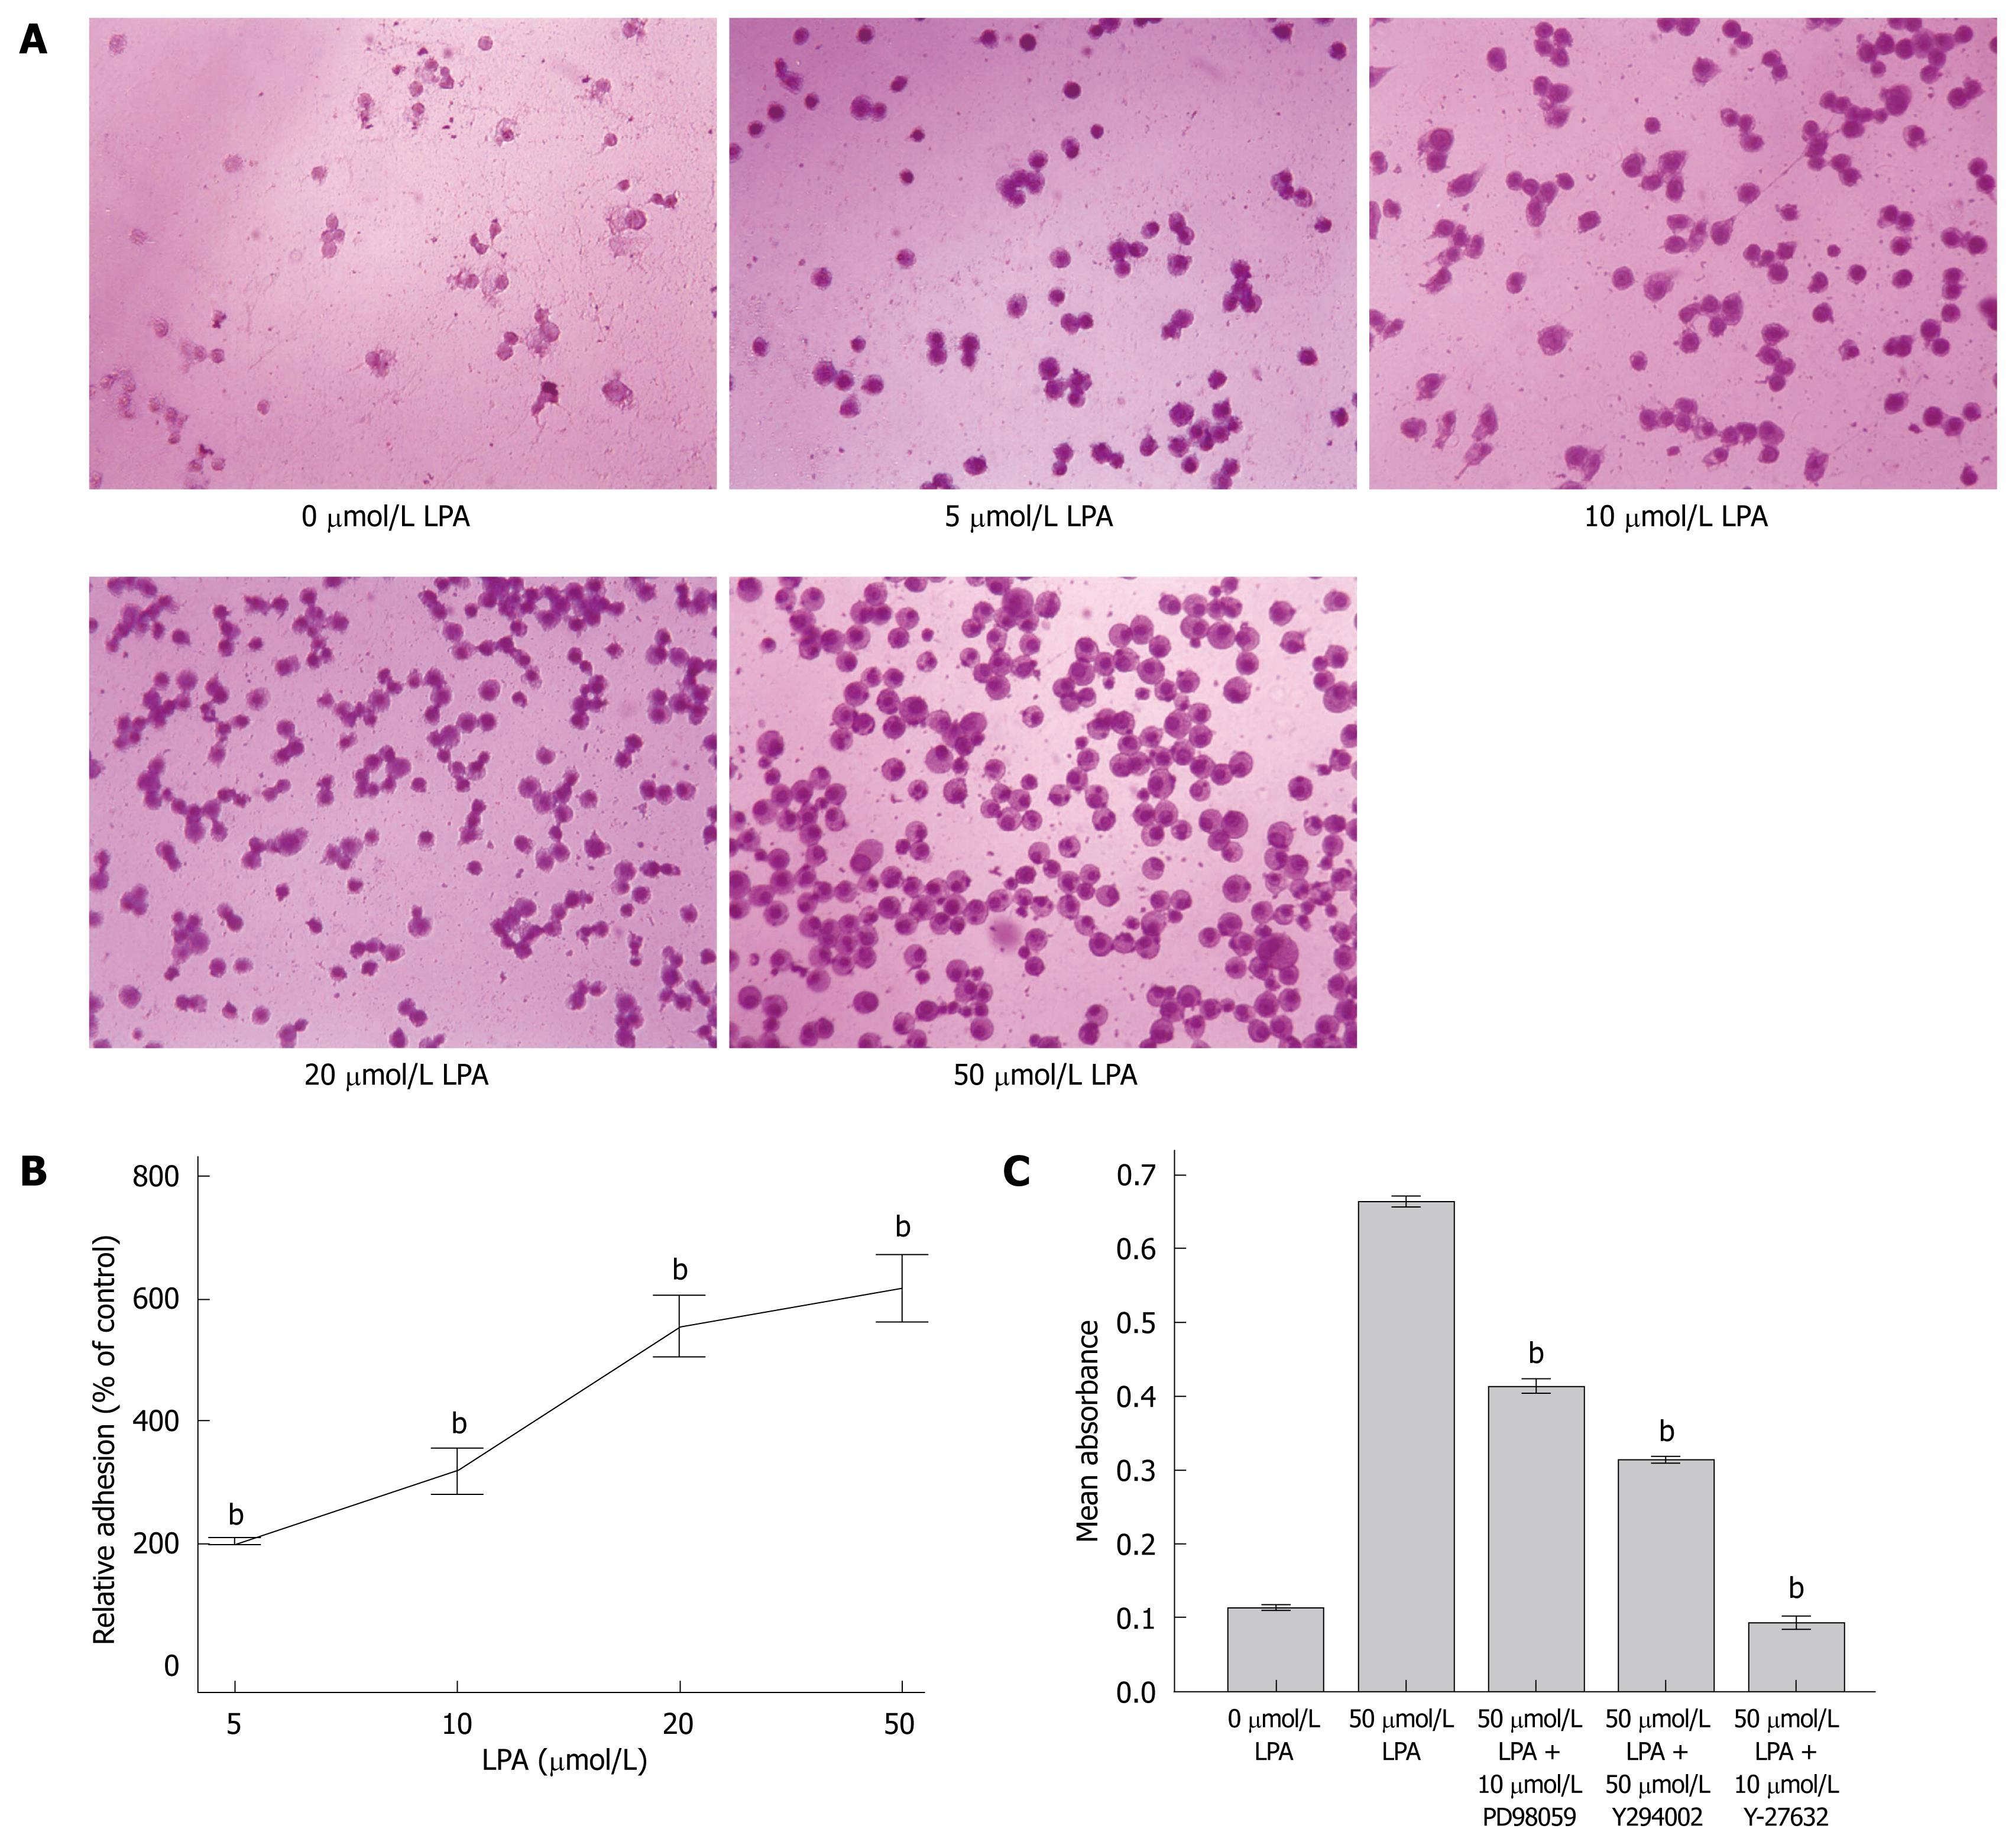
Figure 4 LPA stimulated adhesion of SW480 cells.
A: Typical image of stained adhered cells (× 200); B: Adhered cells were quantified and relative adhesion rates (mean ± SE) are presented. bP < 0.001 vs 0 μmol/L LPA; C: Effect of inhibitors on LPA induced adhesion. 50 μmol/L LPA or LPA plus inhibitors (including 10 μmol/L PD98059, 50 μmol/L LY294002 and 10 μmol/L Y-27632) were added to cells in 96 well plate. Adhered cells were quantified and presented. Results presented as mean ± SE, n = 5. bP < 0.001 vs 50 μmol/L LPA.
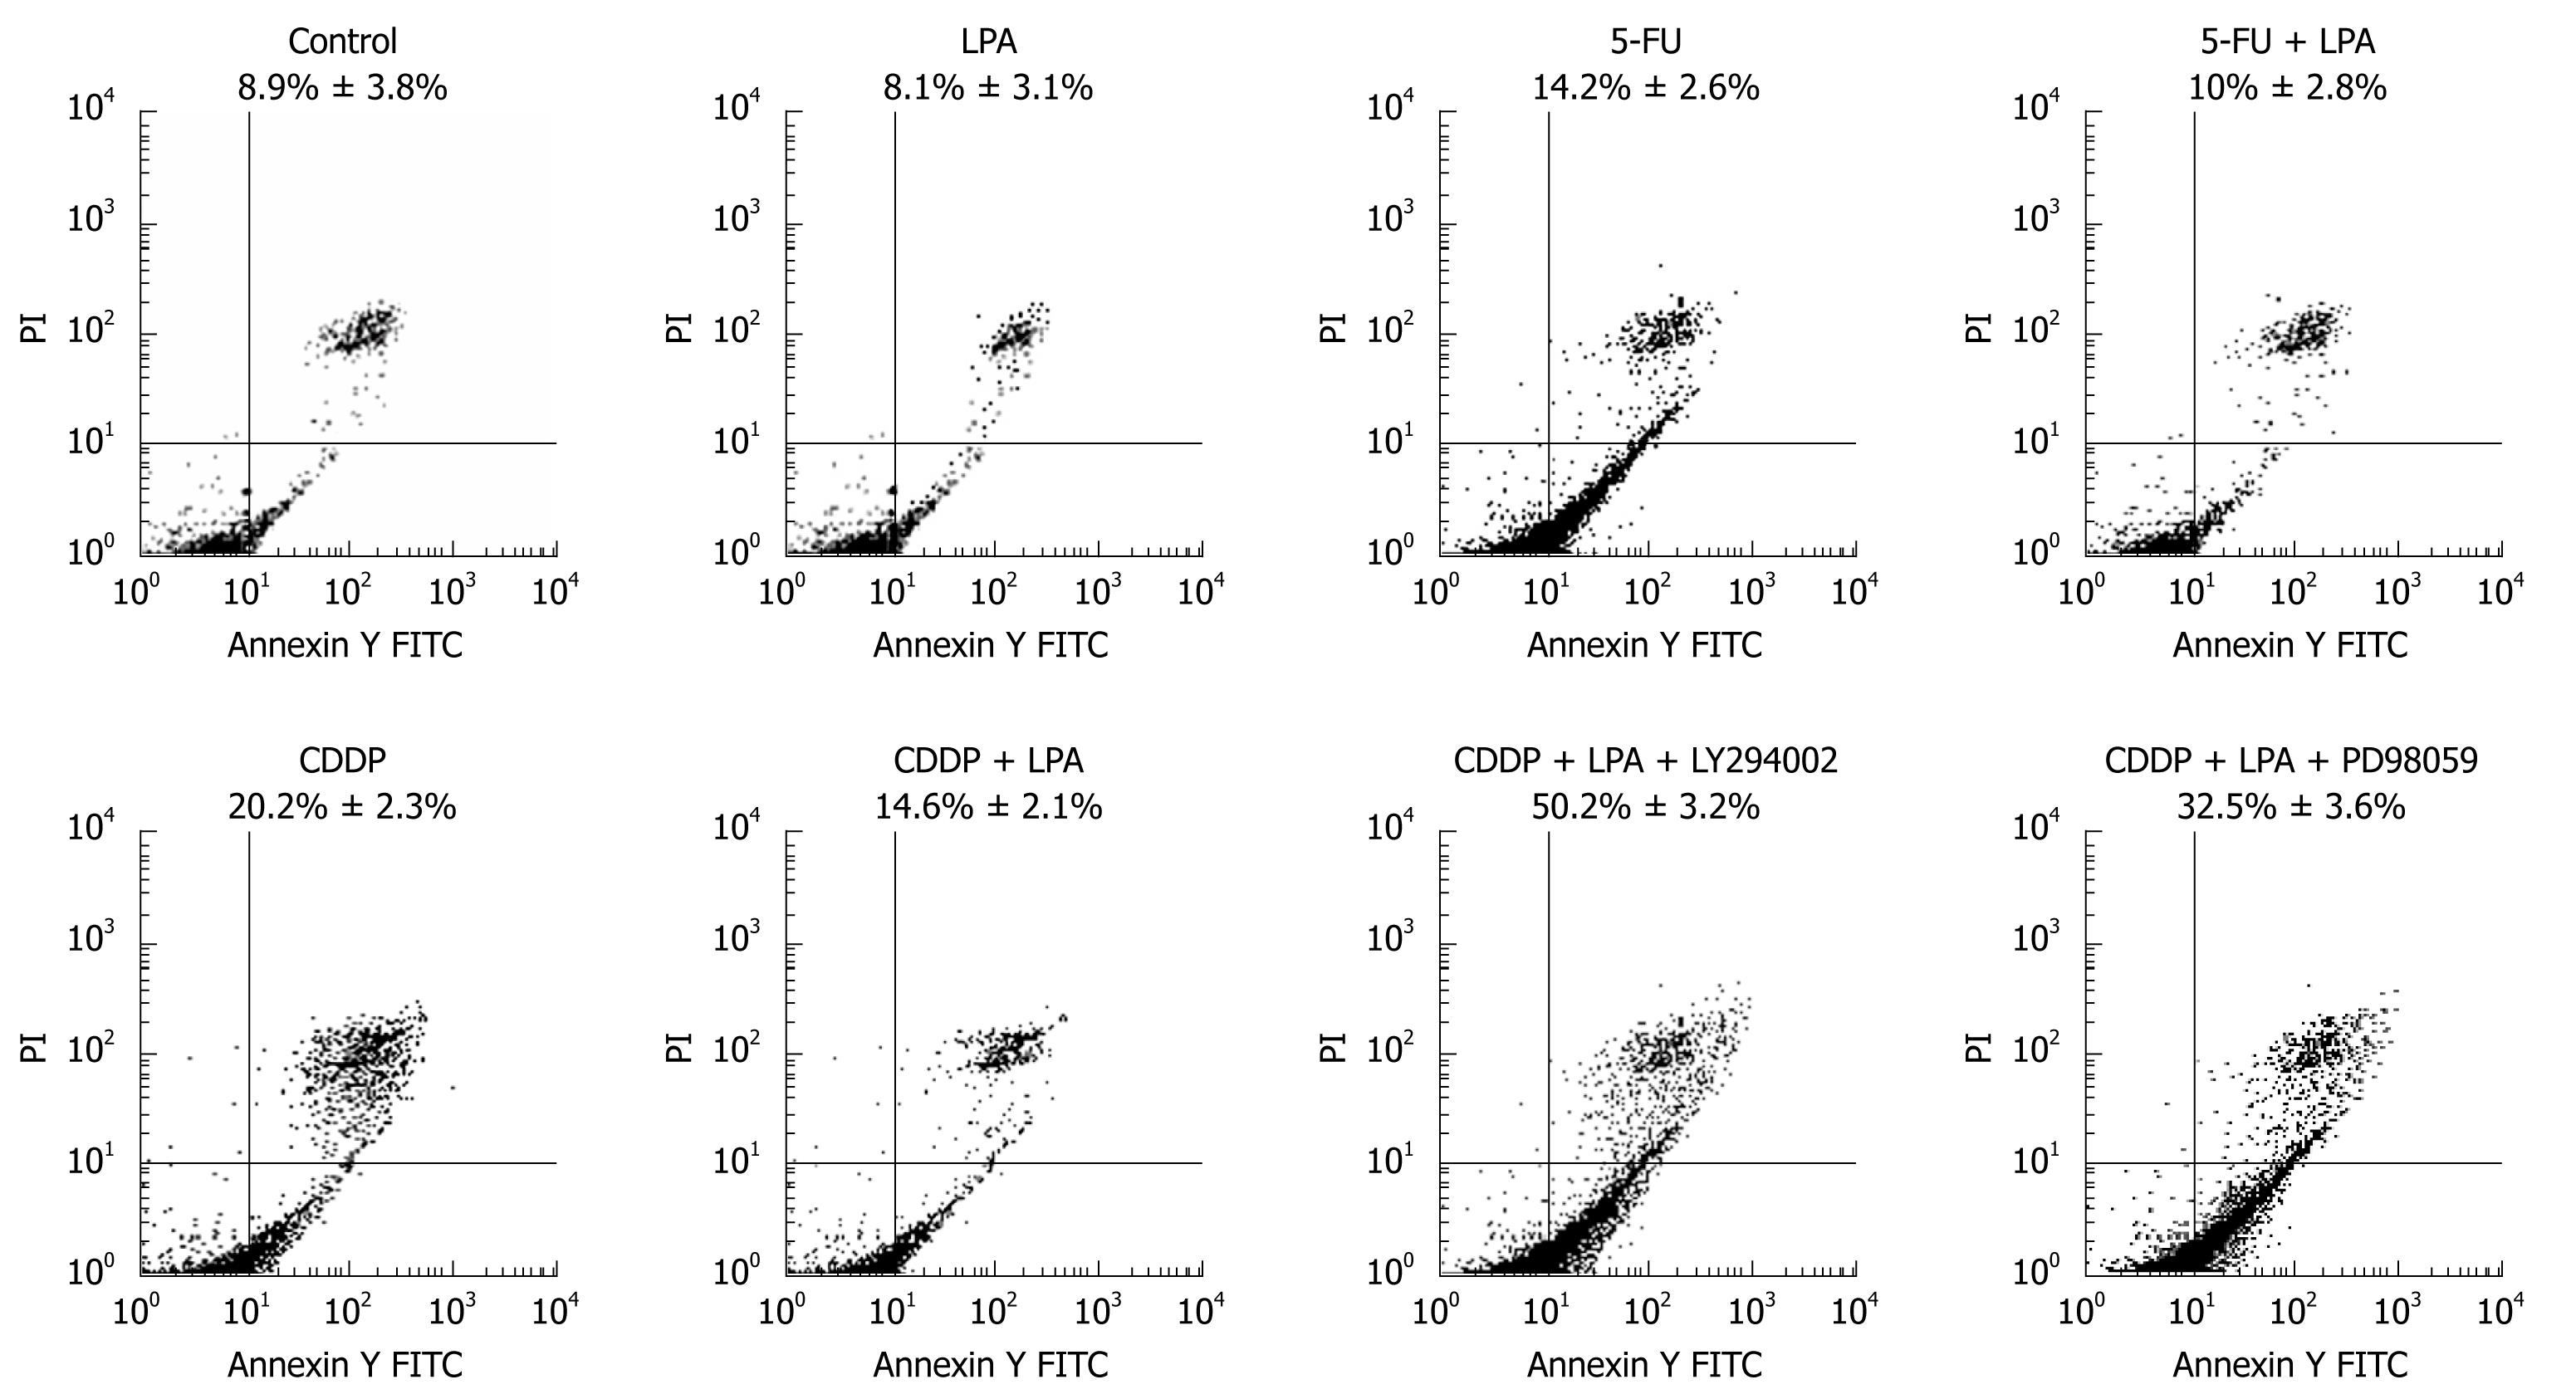
Figure 5 LPA protected cells from cisplatin- & 5-FU-induced apoptosis.
SW480 cells were serum-starved for 24 h and treated for 24 h with 10 μg/mL cisplatin (CDDP); 10 μg/L cisplatin + 20 μmol/L LPA; 8 μg/mL 5-FU; 8 μg/mL 5-FU + 20 μmol/L LPA; 10 μg/mL cisplatin + 20 μmol/L LPA + 50 μmol/L LY294002; 10 μg/mL cisplatin + 20 μmol/L LPA + 10 μmol/L PD98059, respectively. Cells were harvested, stained with Annexin V/PI, and analyzed by FACS analysis. The Annexin V-positive and PI-negative population was defined as apoptotic cells. Representative results from three separate experiments are presented.
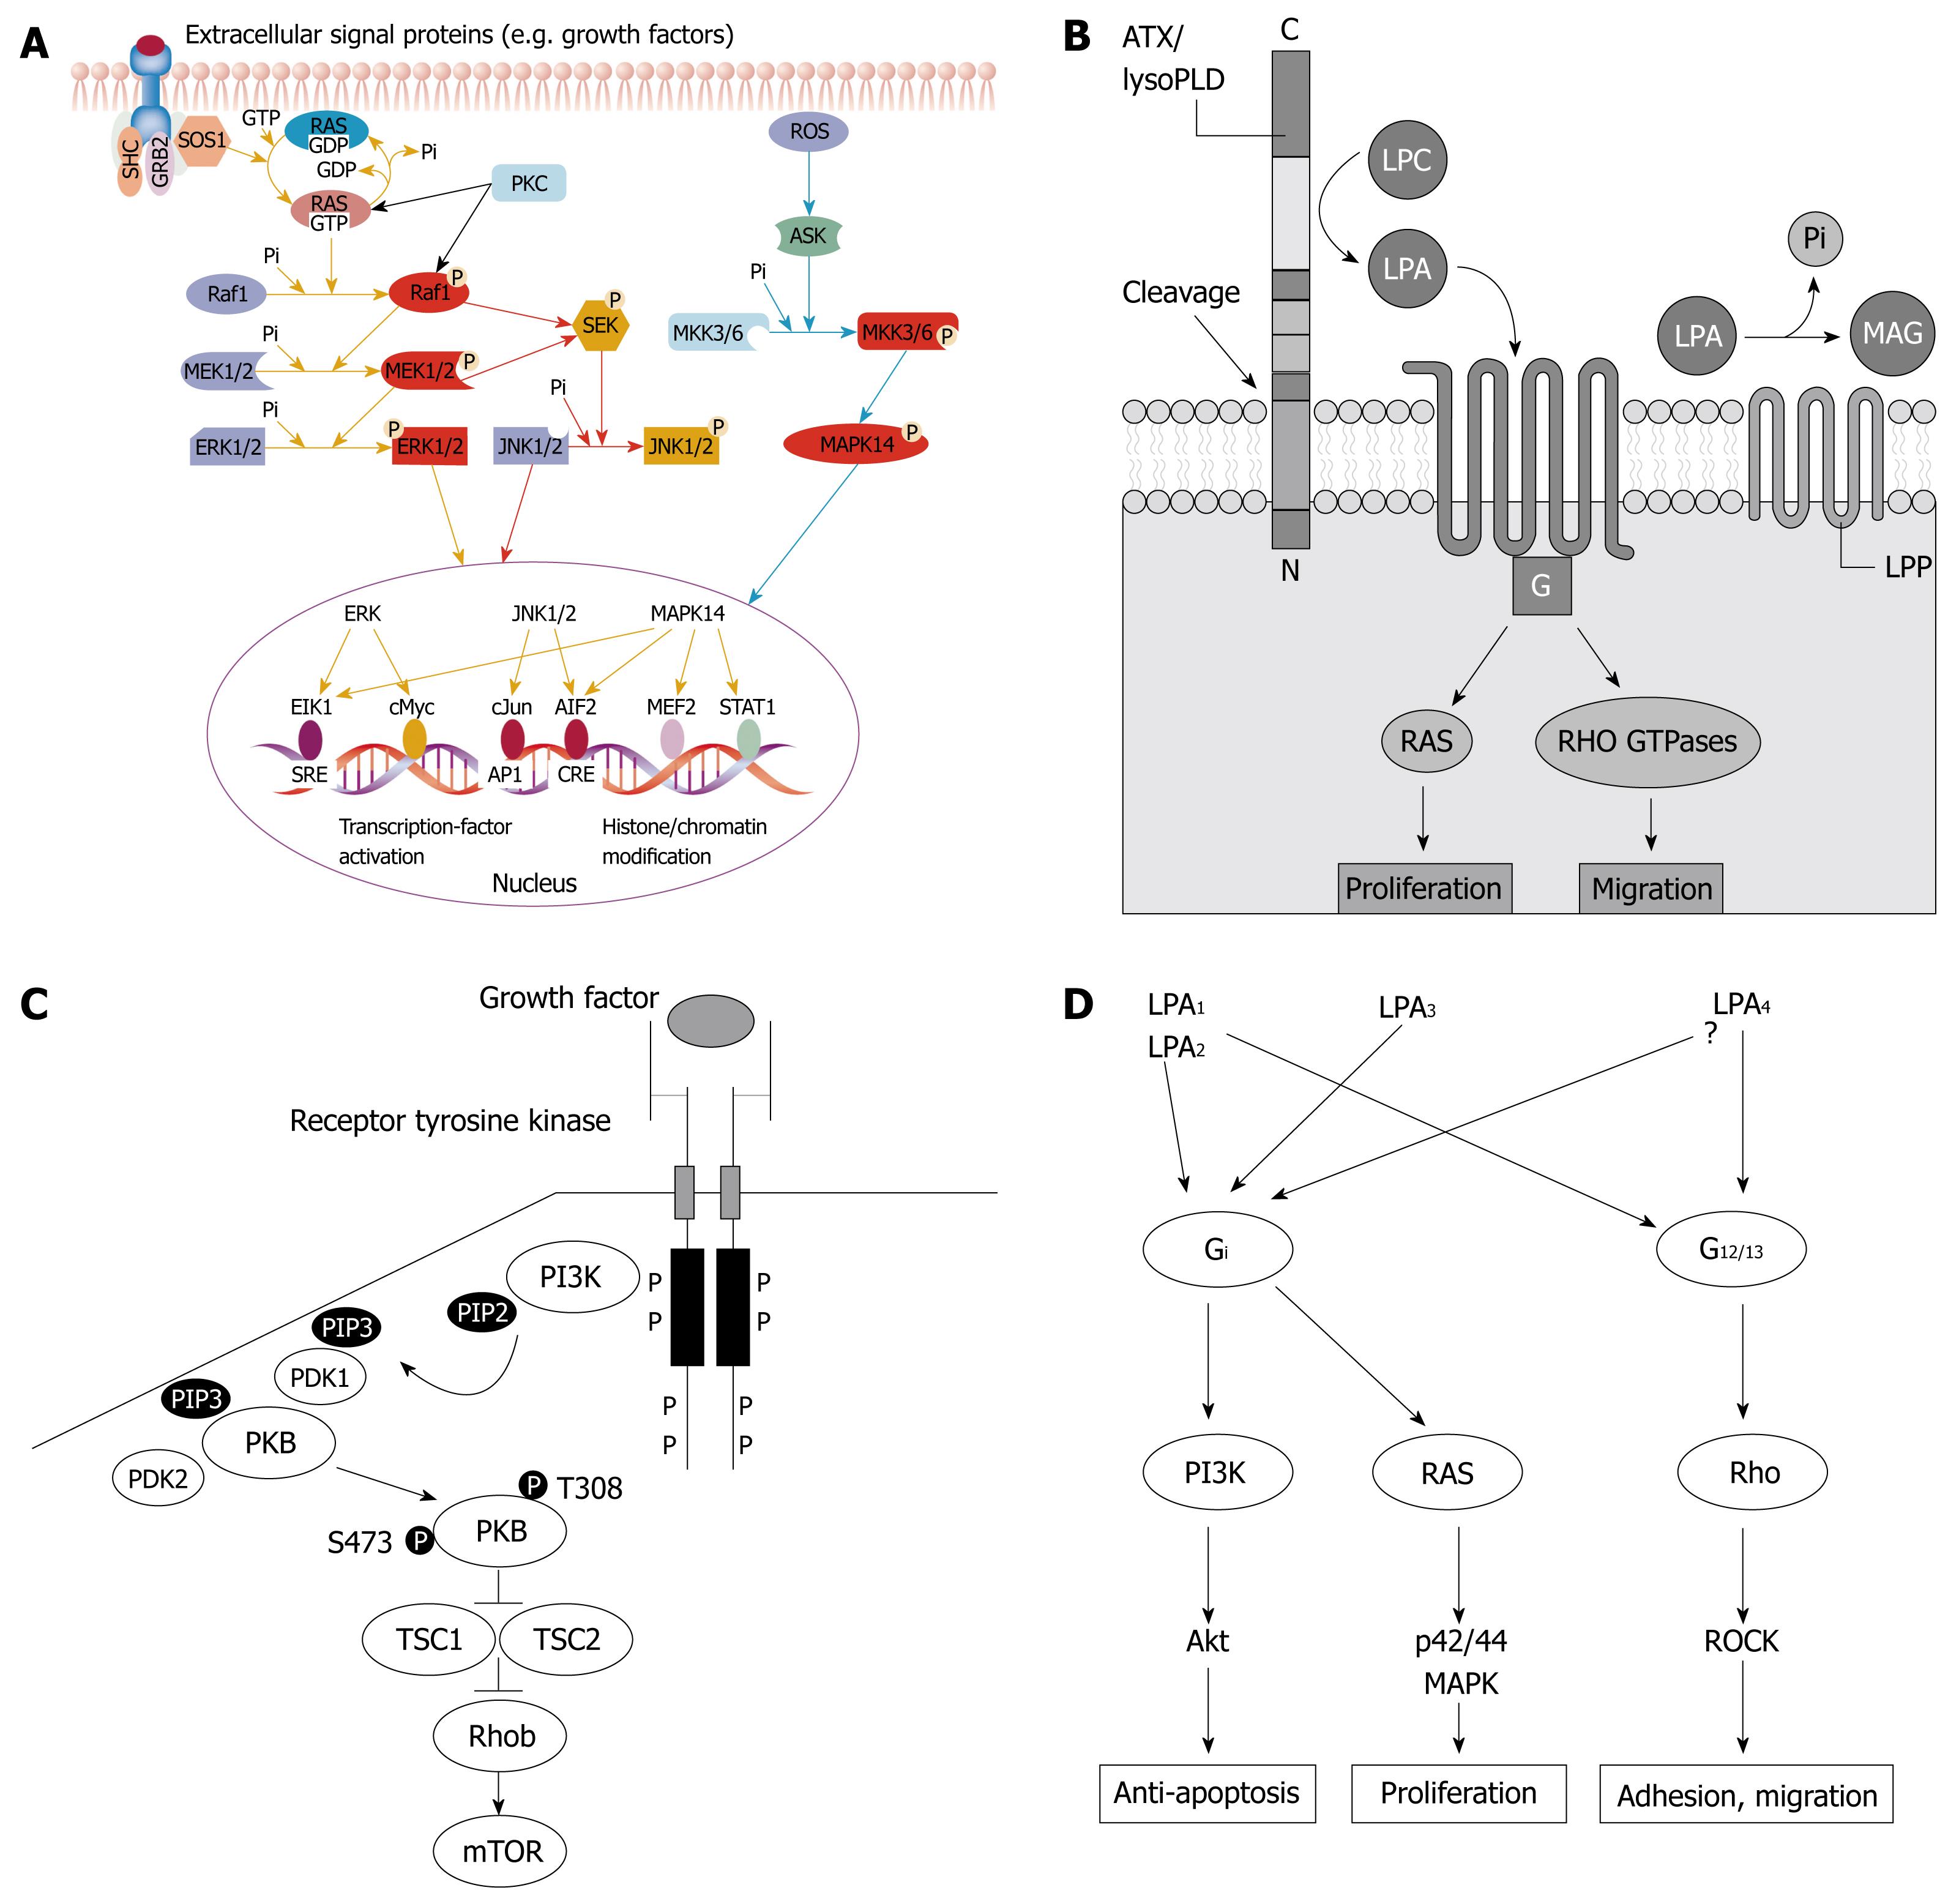
Figure 6 LPA effect and signal transduction pathway.
A: Ras/Raf1/MEK/ERK signal pathway[27]; B: G12/13-Rho-GEFs-RhoA signal pathway; C: PI3K-AKT/PKB signal pathway; D: Possible signal pathways mediated by LPA effect on SW480 cells.
- Citation: Sun H, Ren J, Zhu Q, Kong FZ, Wu L, Pan BR. Effects of lysophosphatidic acid on human colon cancer cells and its mechanisms of action. World J Gastroenterol 2009; 15(36): 4547-4555
- URL: https://www.wjgnet.com/1007-9327/full/v15/i36/4547.htm
- DOI: https://dx.doi.org/10.3748/wjg.15.4547


