Copyright
©2009 The WJG Press and Baishideng.
World J Gastroenterol. Sep 28, 2009; 15(36): 4538-4546
Published online Sep 28, 2009. doi: 10.3748/wjg.15.4538
Published online Sep 28, 2009. doi: 10.3748/wjg.15.4538
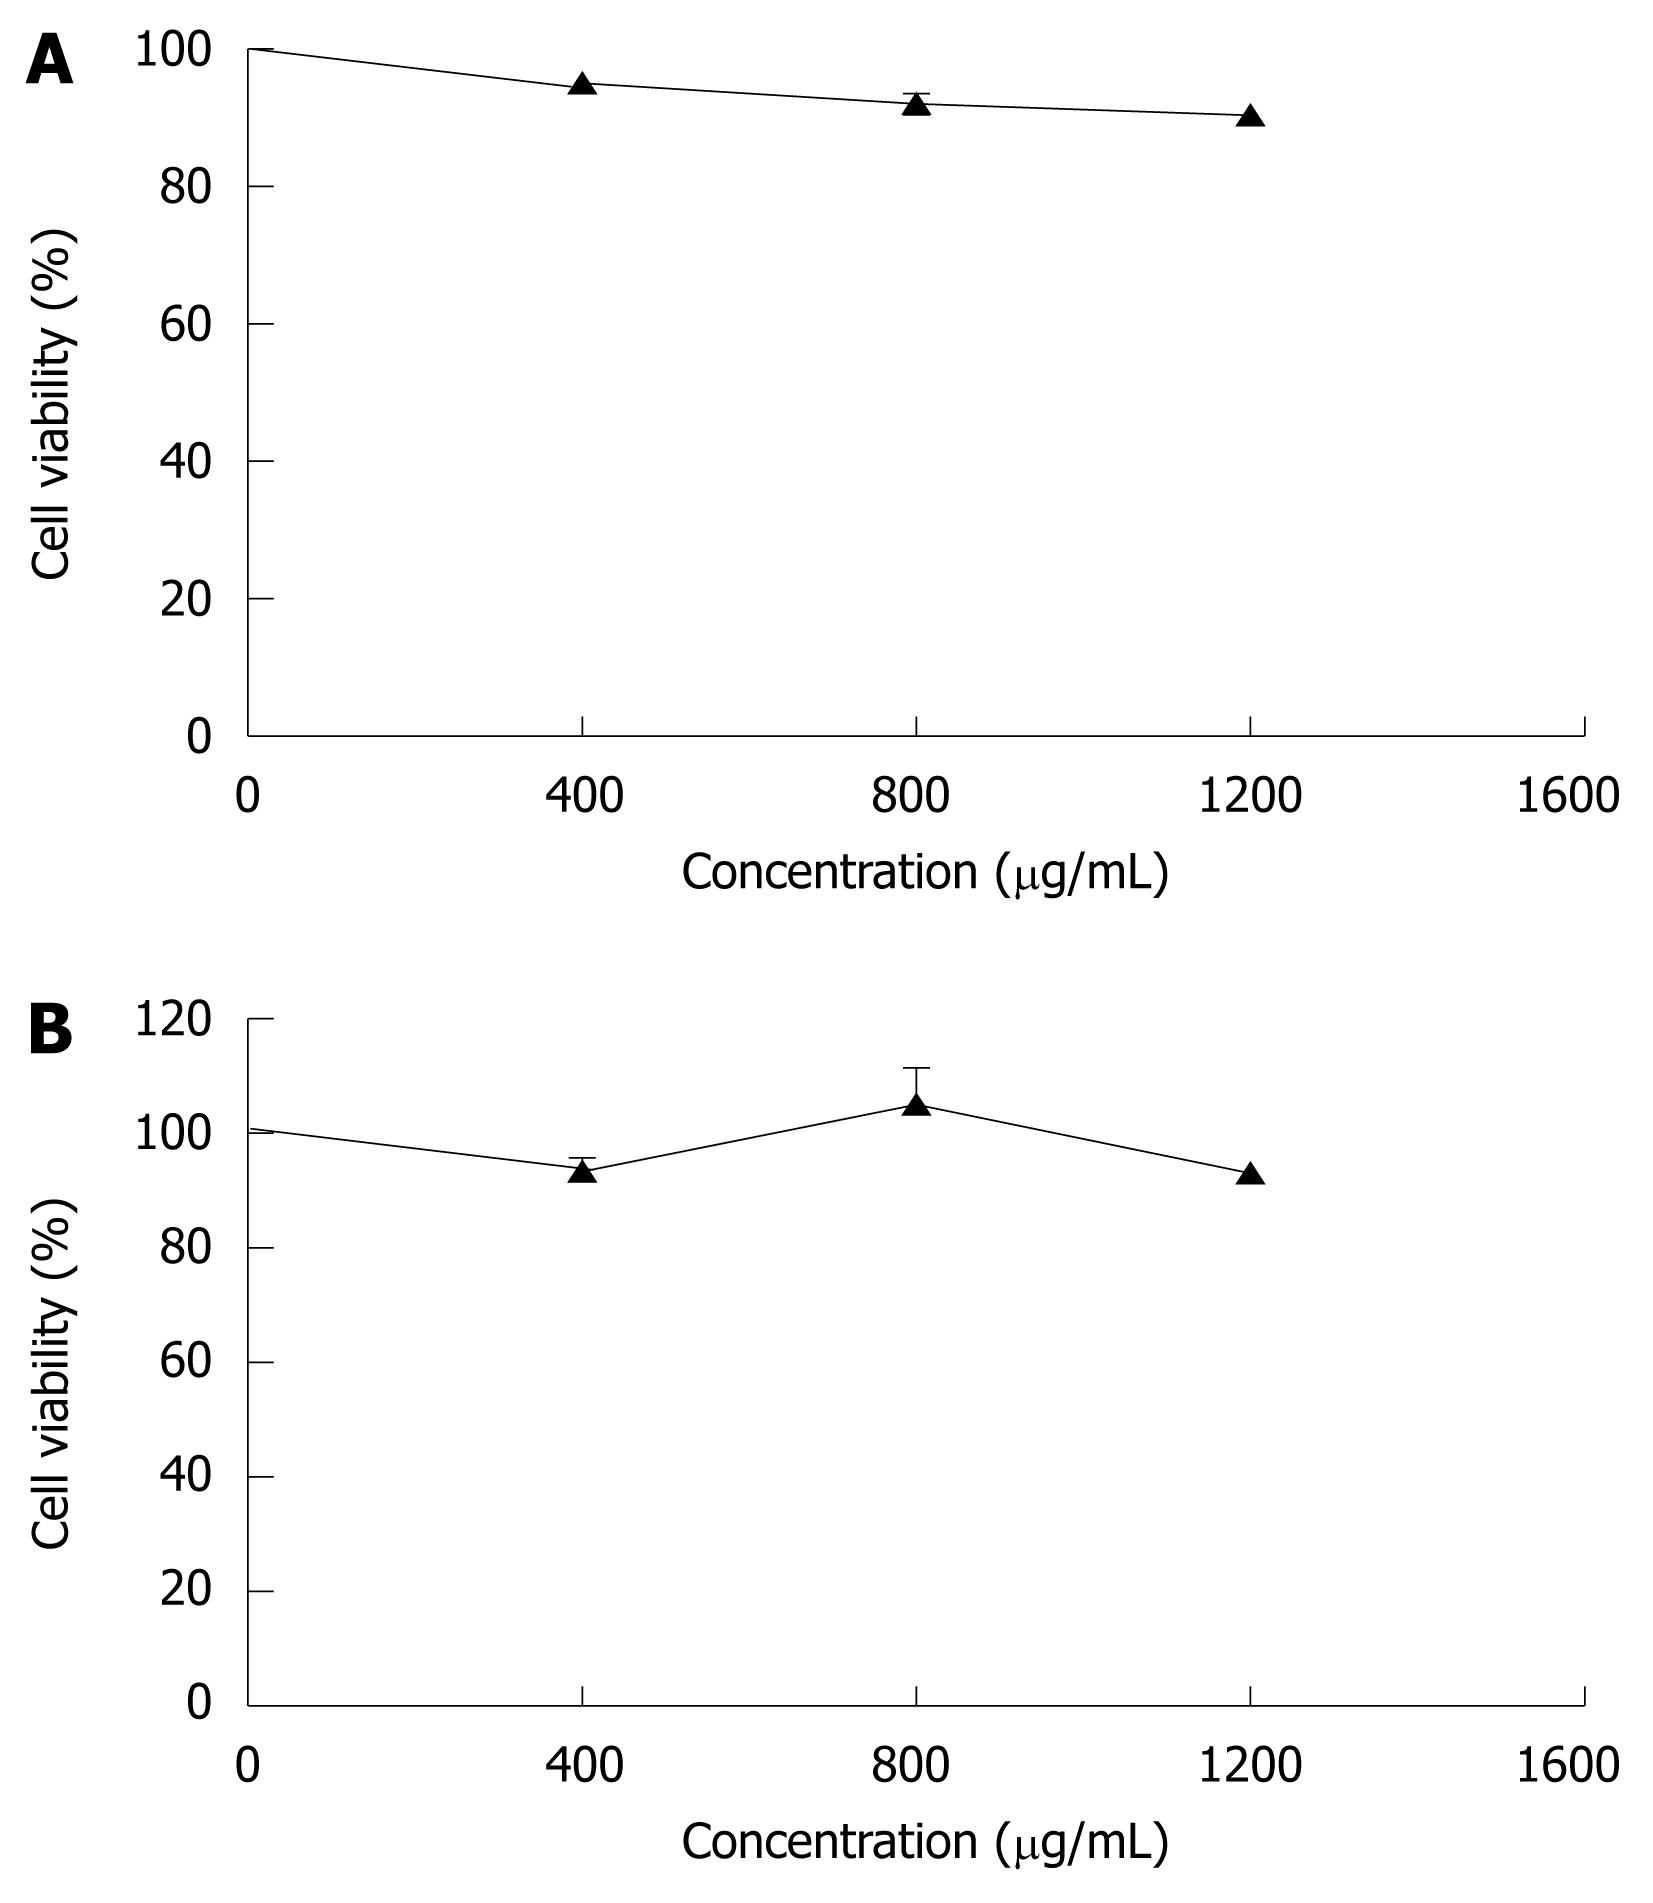
Figure 1 Effects of Chrysanthemum indicum extract (CIE) on cell viability of normal cells.
A: Rat hepatocytes; B: Human umbilical vein endothelial cell line ECV304. Various concentrations of CIE were added, and the cells were incubated for 24 h. Cell viability was measured by 0.2% trypan blue exclusion (A) and MTT assay (B) respectively. Results presented are representative of 3 independent experiments.
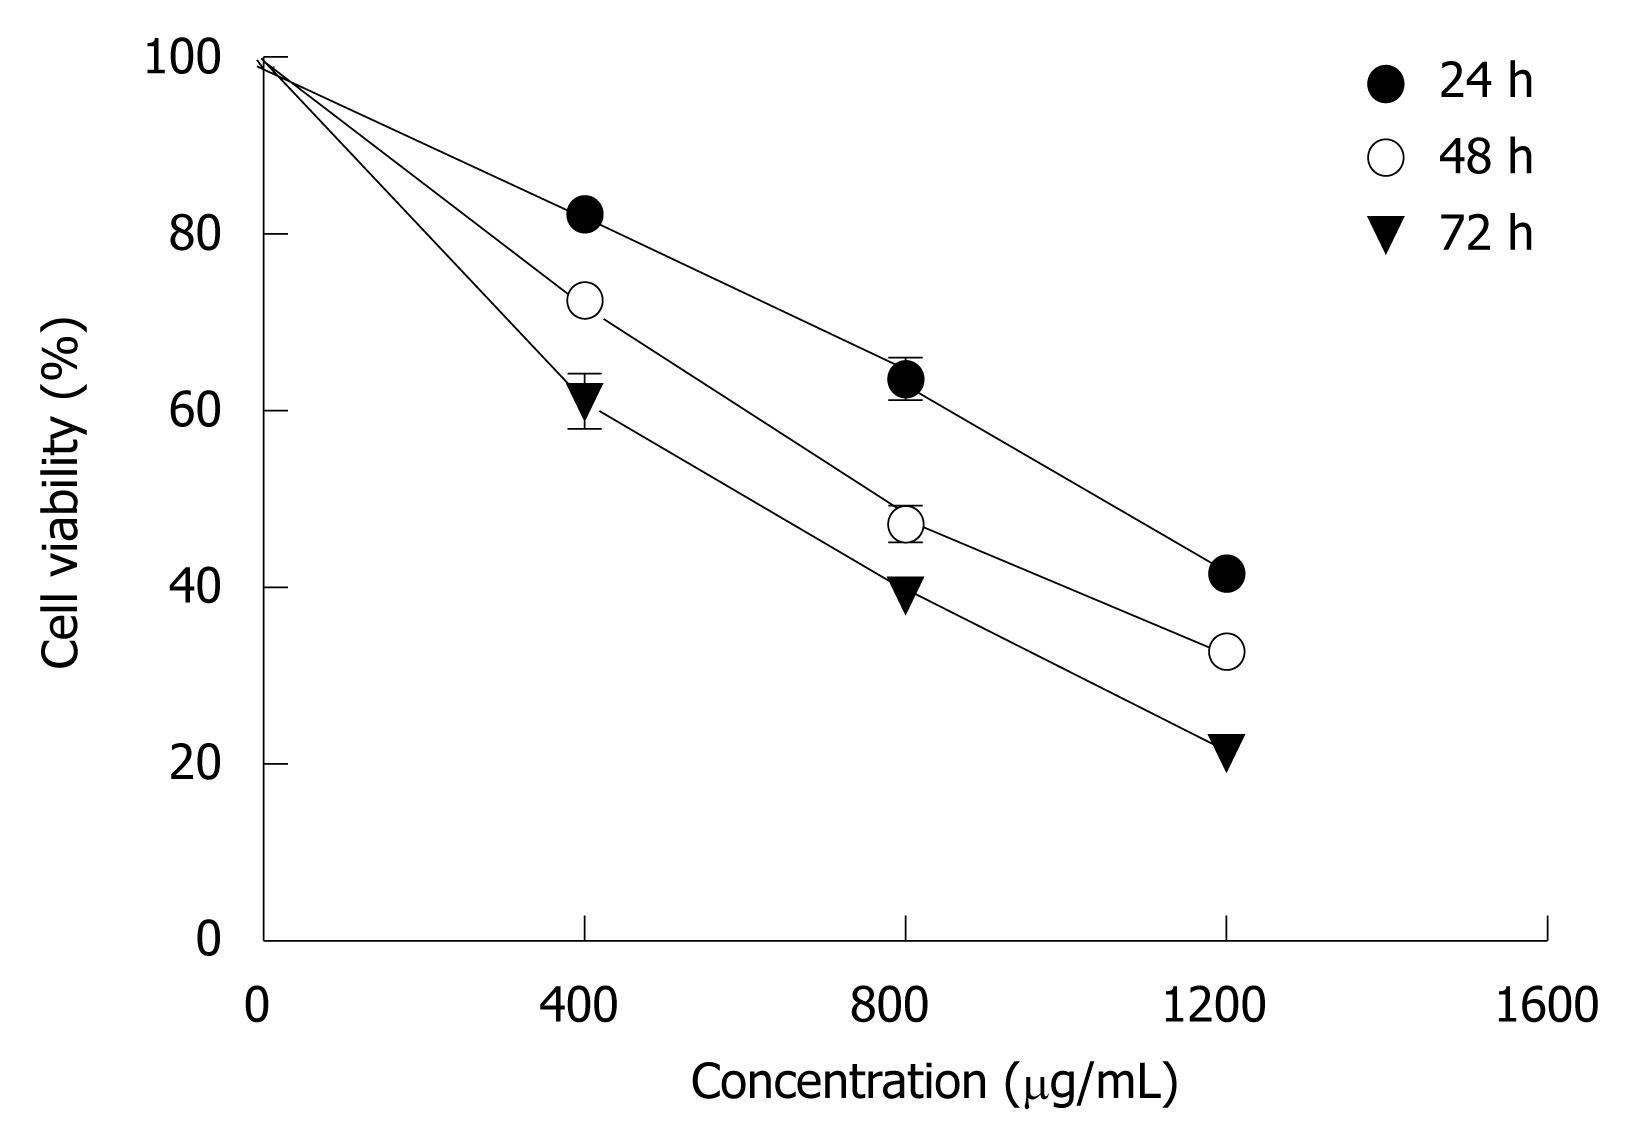
Figure 2 Dose-response curves for CIE in MHCC97H cells, following 24 h, 48 h and 72 h incubation, as assessed by MTT assay.
CIE produced a concentration- and time-dependent decrease in cellular proliferation. Results presented are representative of 3 independent experiments.
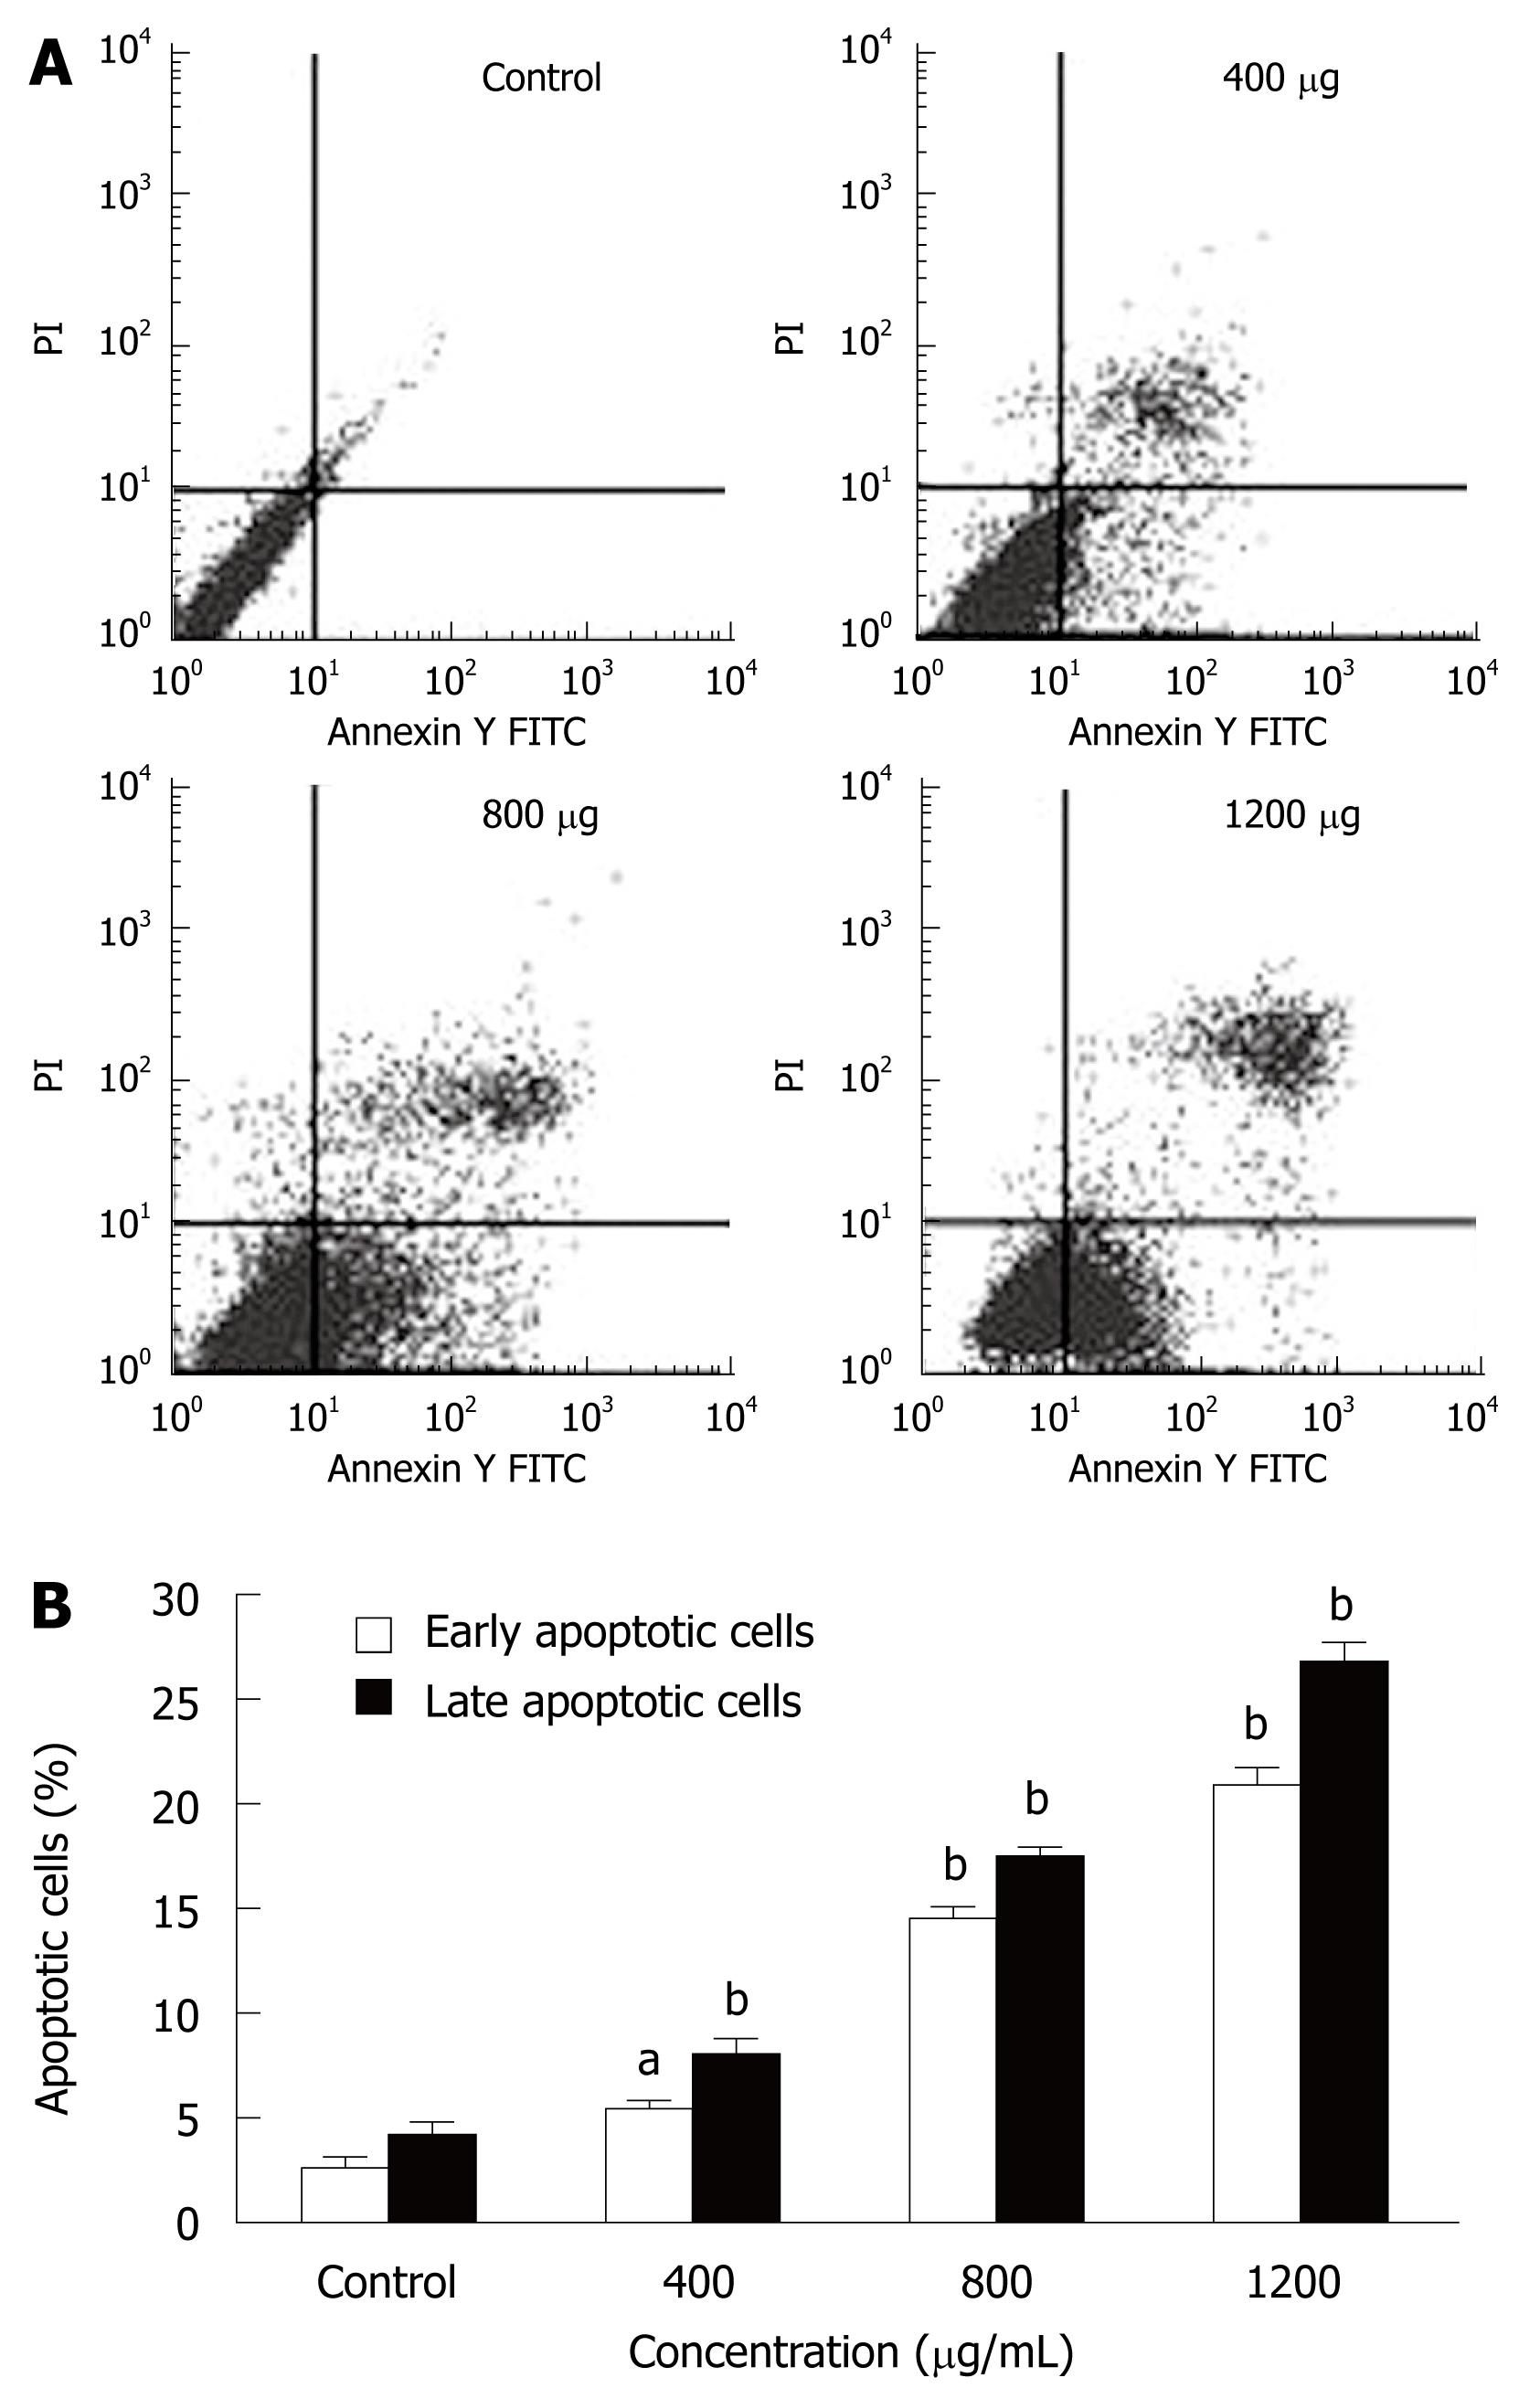
Figure 3 Effect of CIE on the induction of MHCC97H cell apoptosis.
A: The apoptosis of MHCC97H cells induced by CIE were determined by flow cytometry at 24 h; B: CIE induced a concentration-dependent increase in early and late cellular apoptosis. Results presented are representative of 3 independent experiments. aP < 0.05, bP < 0.01 vs control group.
Figure 4 Morphological changes in MHCC97H cells with CIE.
Cells were observed by phase contrast microscopy in controls and after treatment with 400, 800, 1200 μg/mL CIE (× 200).
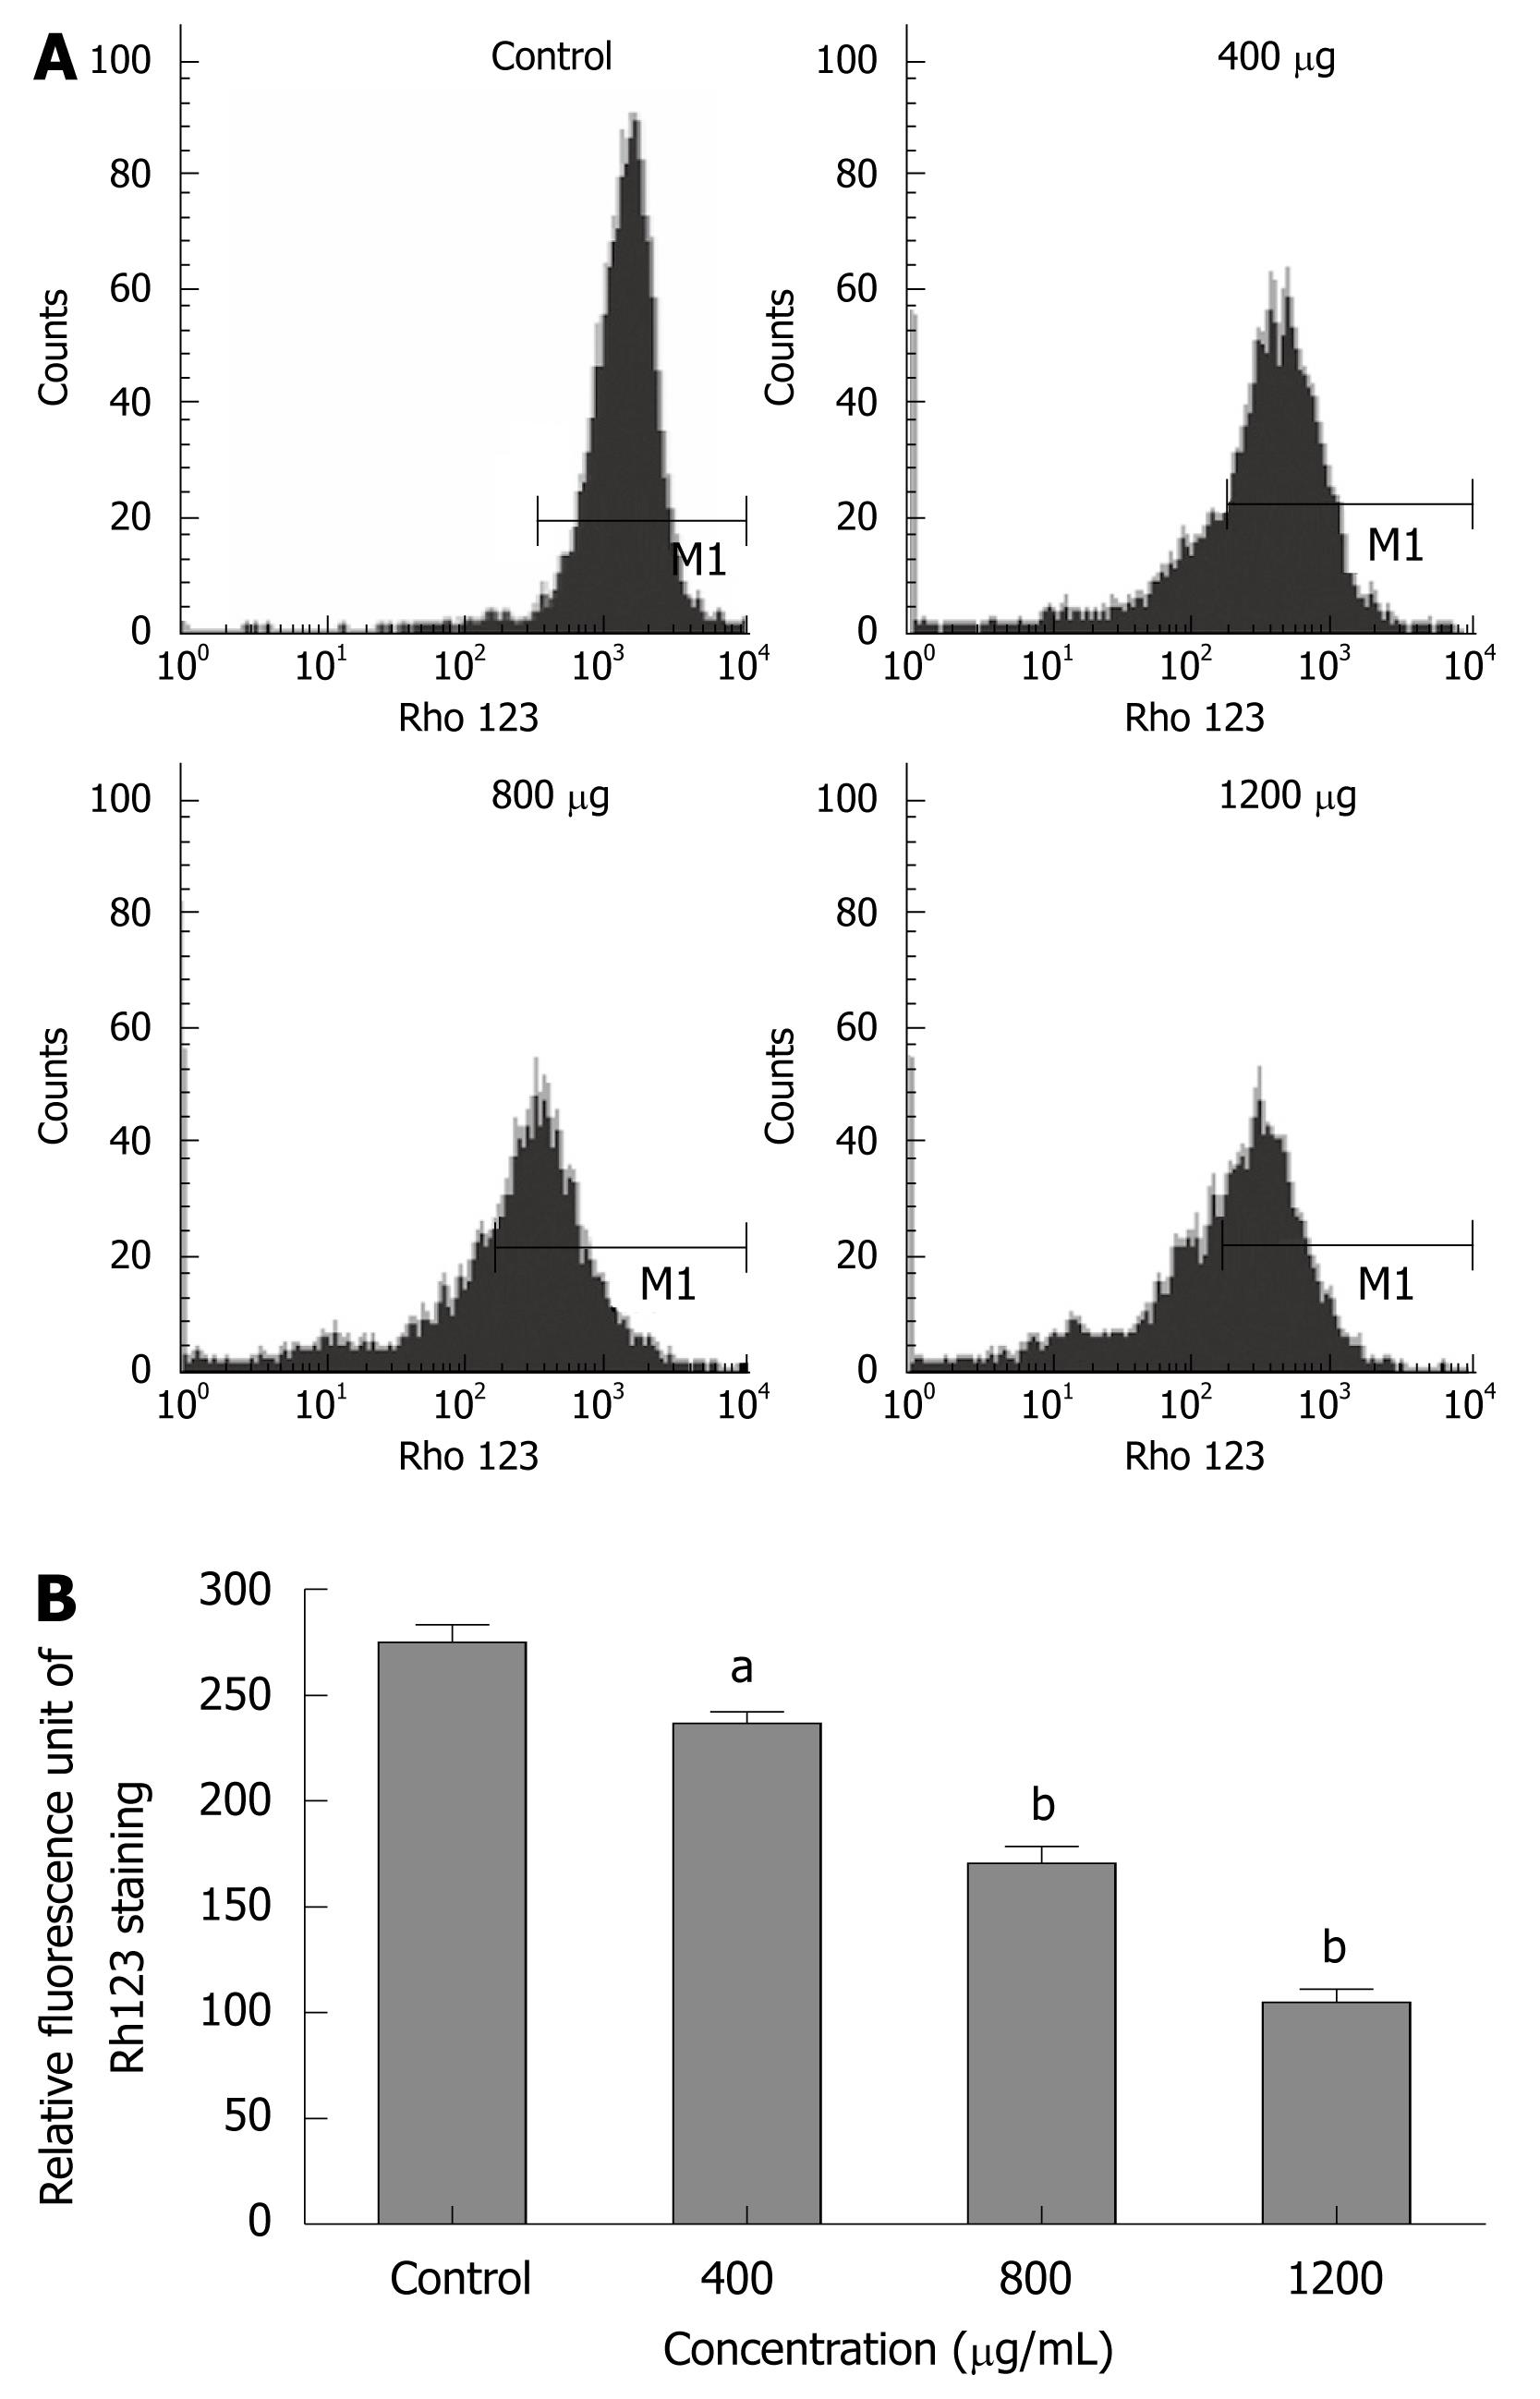
Figure 5 Effect of CIE on MHCC97H cellular mitochondrial membrane potential (MMPΔψm).
A: The MMPΔψm of MHCC97H cells were determined by flow cytometry at 24 h after CIE; B: Results presented are representative of 3 independent experiments. aP < 0.05, bP < 0.01 vs control group.
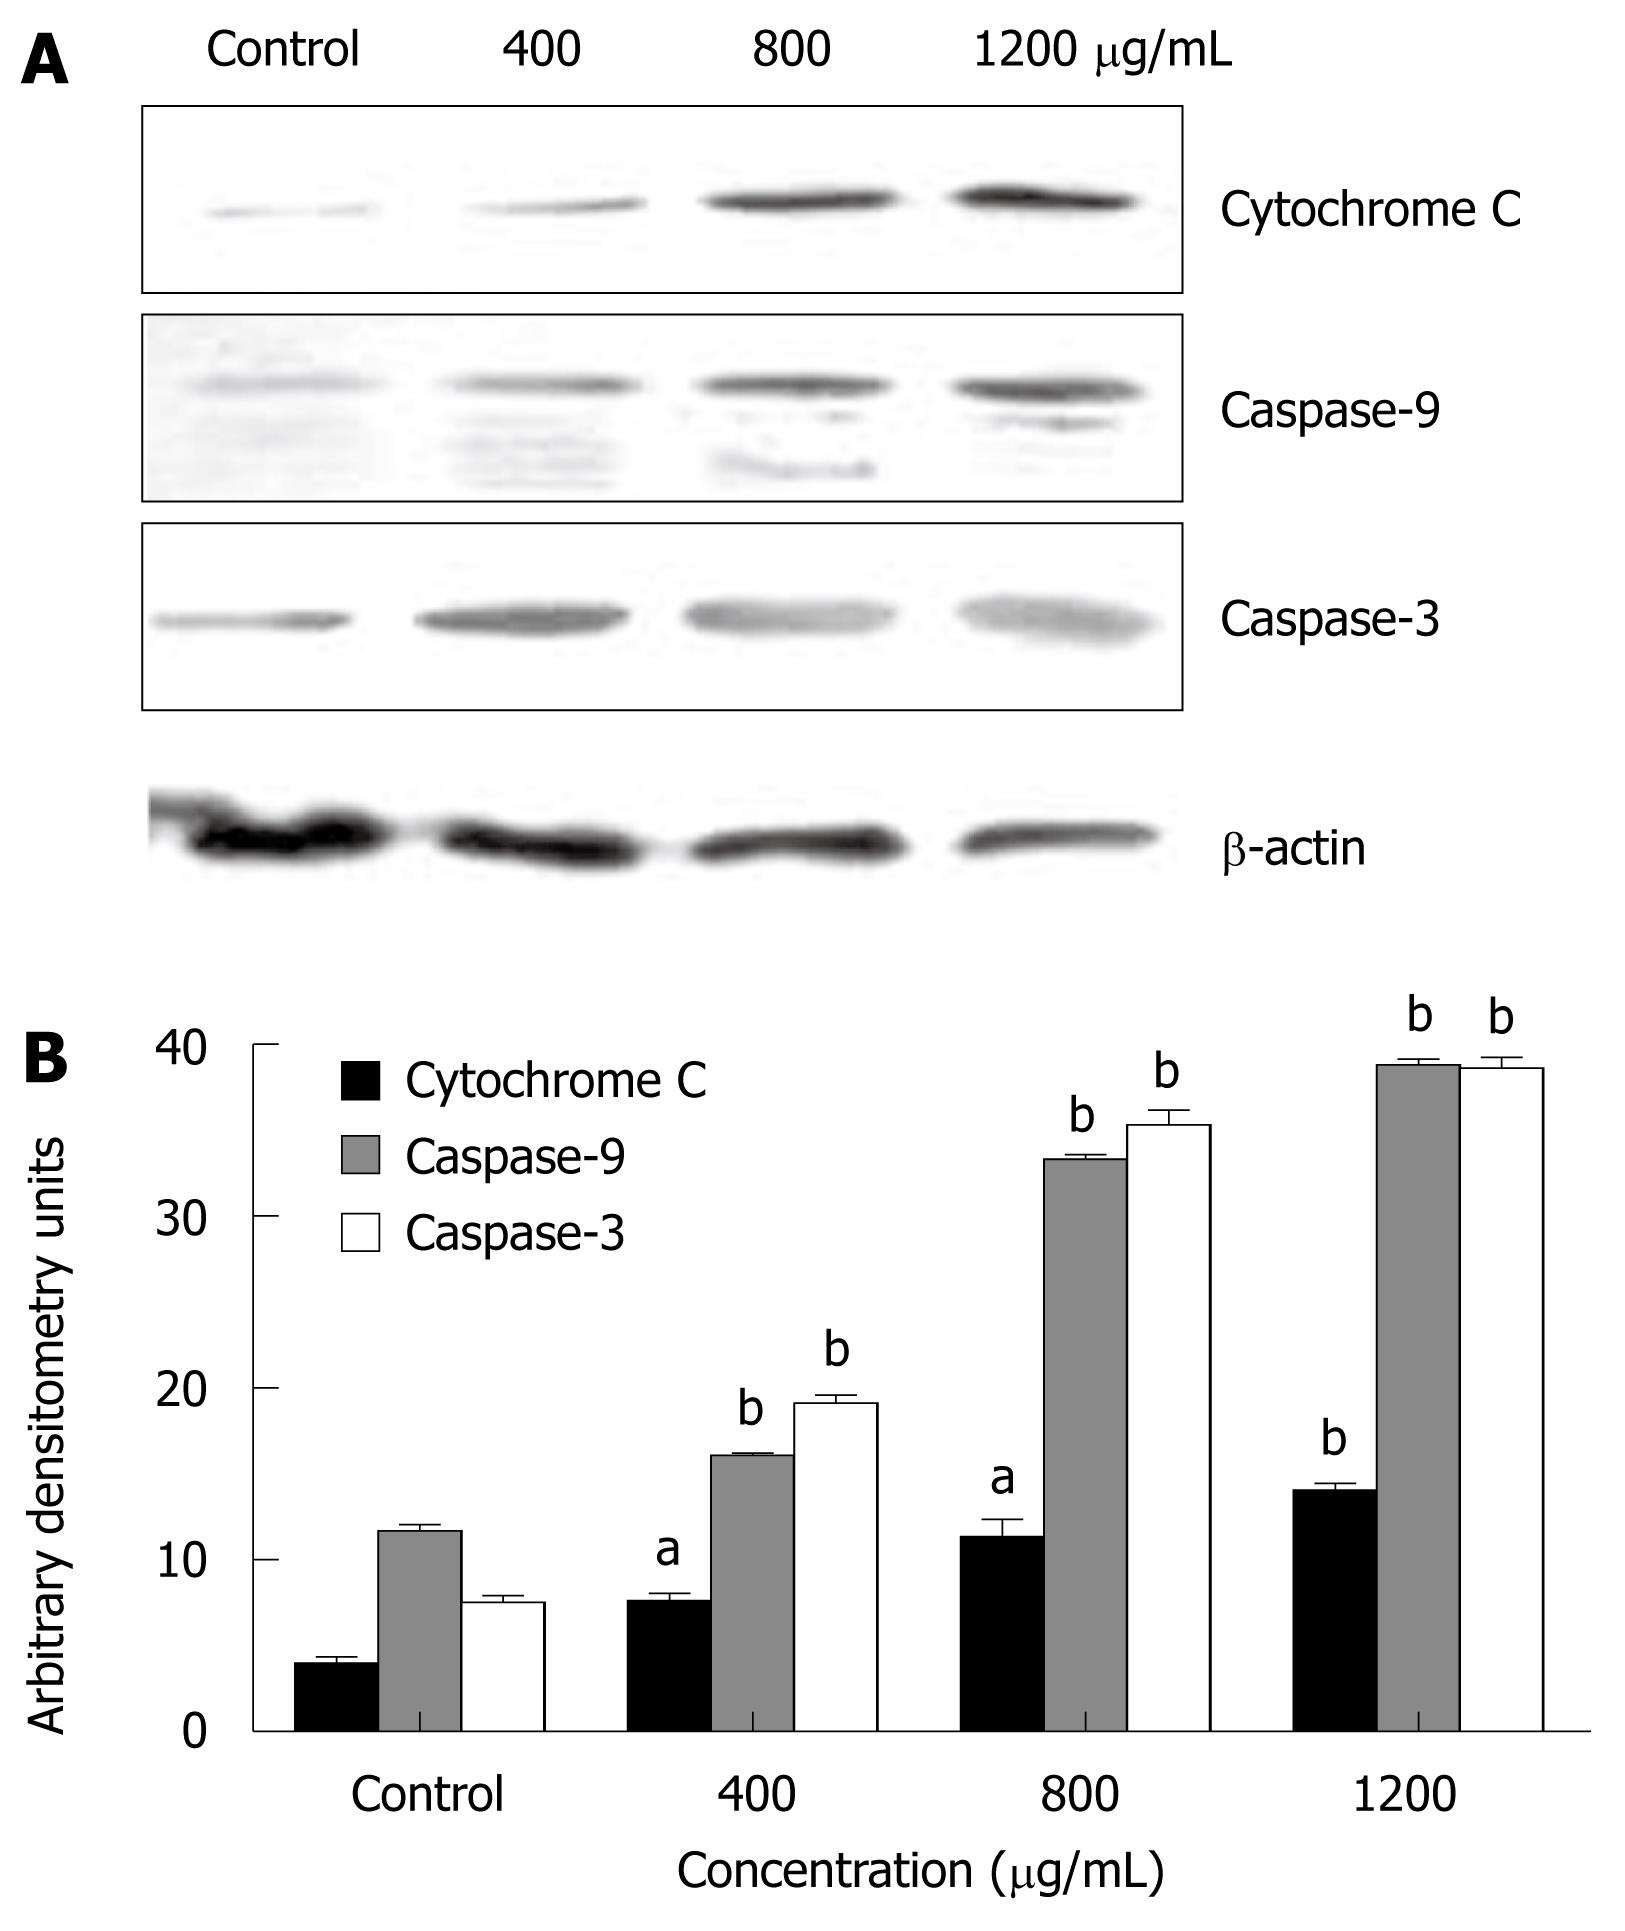
Figure 6 Effect of CIE on apoptosis-related protein expression.
A: The expressions of cytochrome C, caspase-9 and caspase-3 were assessed by Western blotting; B: Results presented are representative of 3 independent experiments. aP < 0.05, bP < 0.01 vs control group.
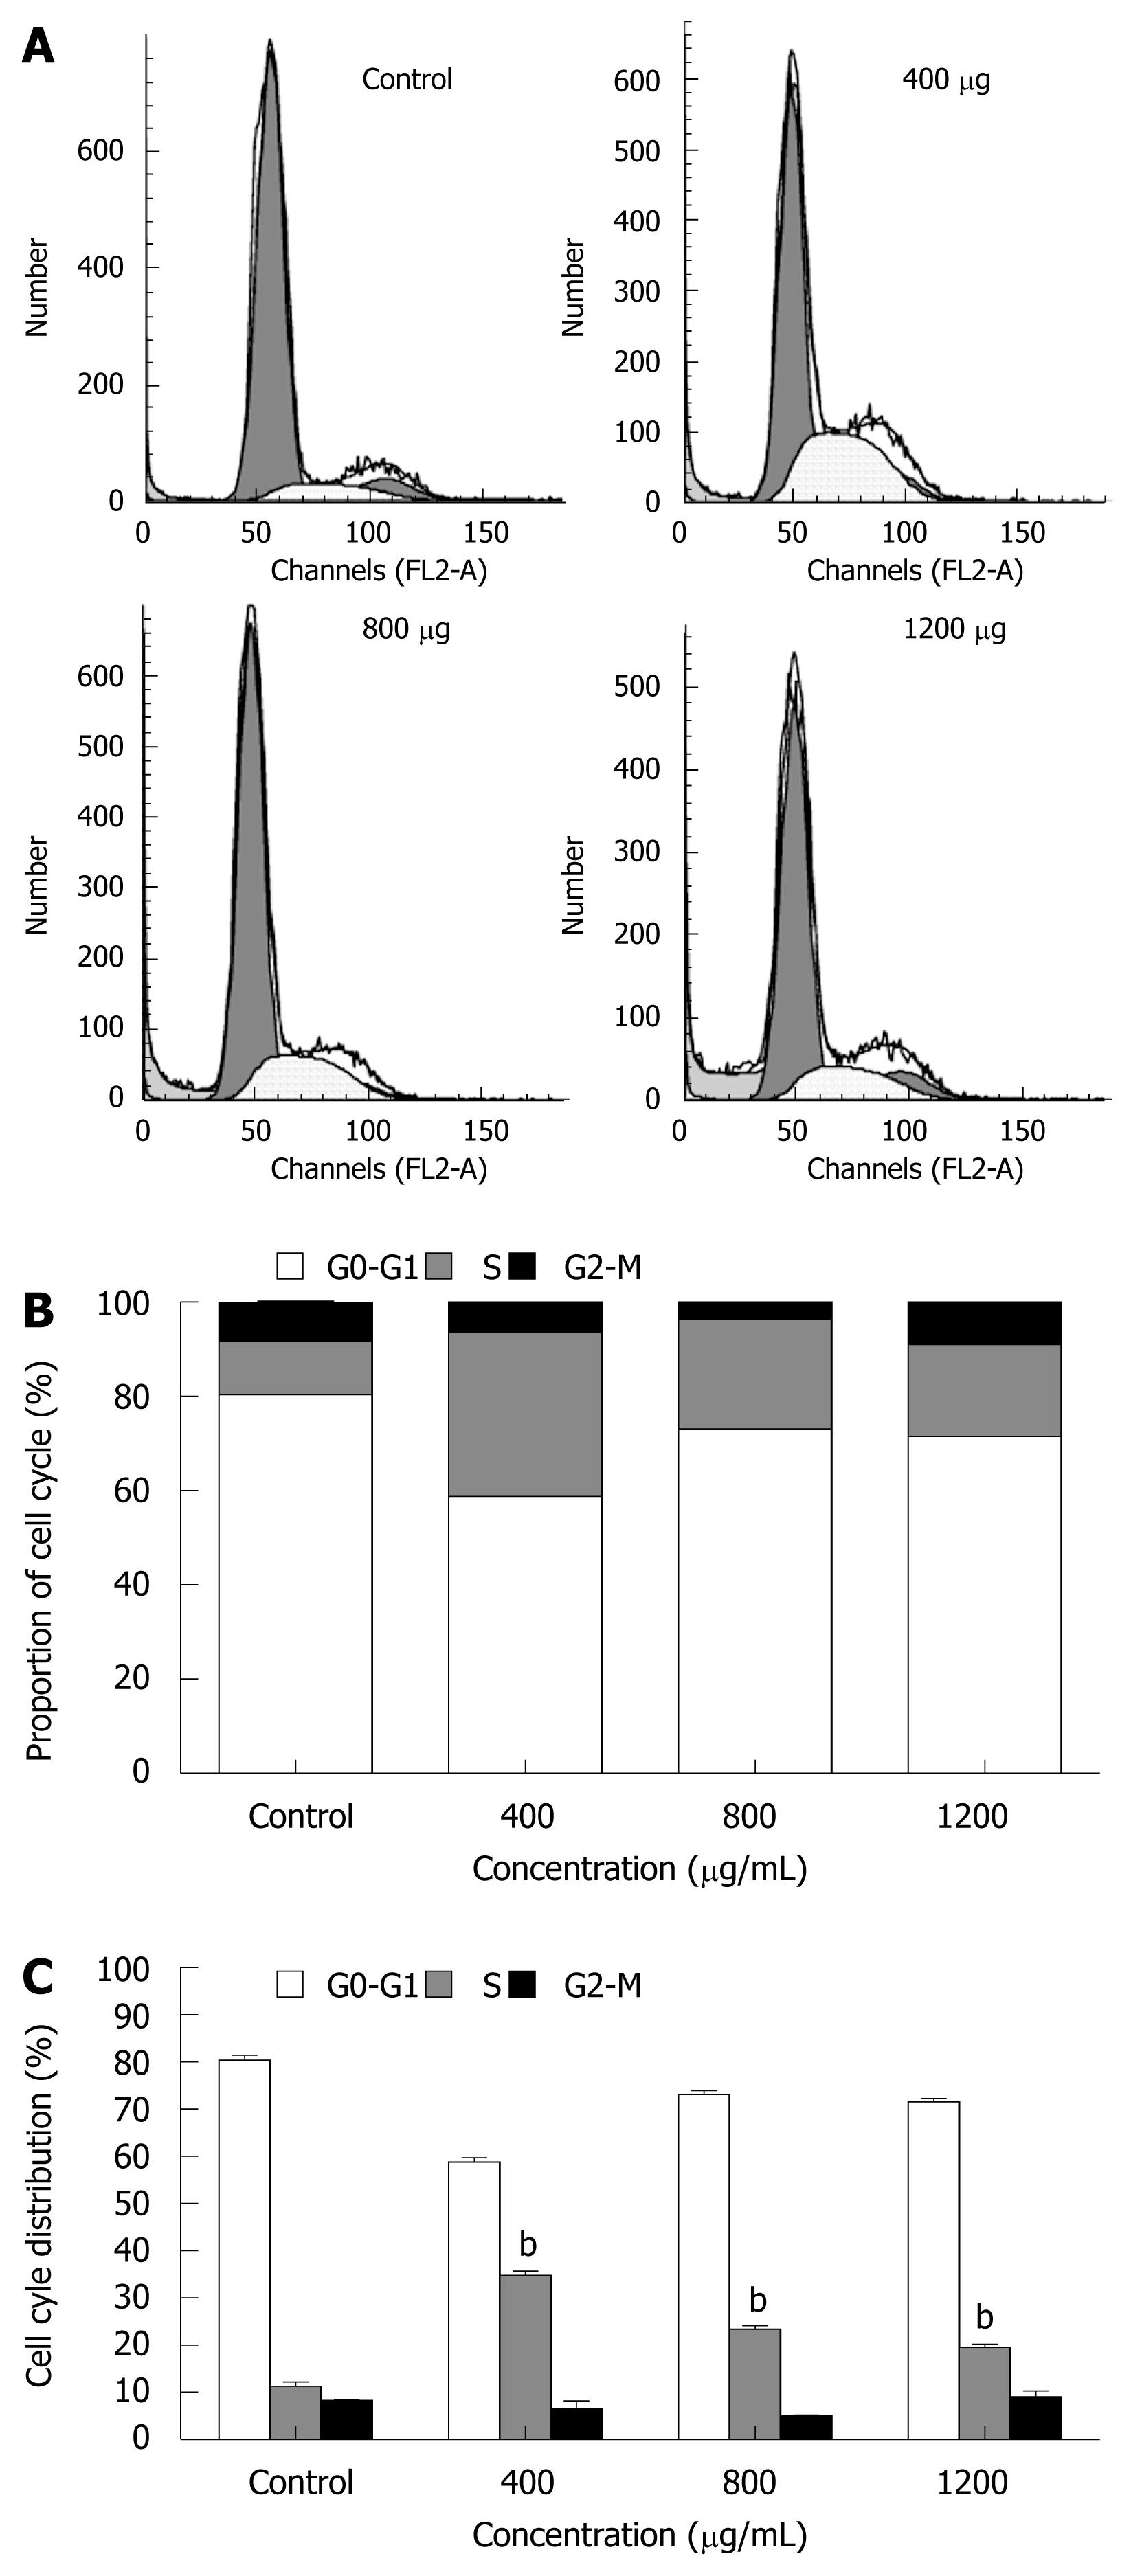
Figure 7 Effect of CIE on MHCC97H cell cycle.
A: The cell cycle of MHCC97H cells in the presence of CIE was determined by flow cytometry at 48 h; B and C: Results presented are representative of 3 independent experiments. aP < 0.05, bP < 0.01 vs control group.
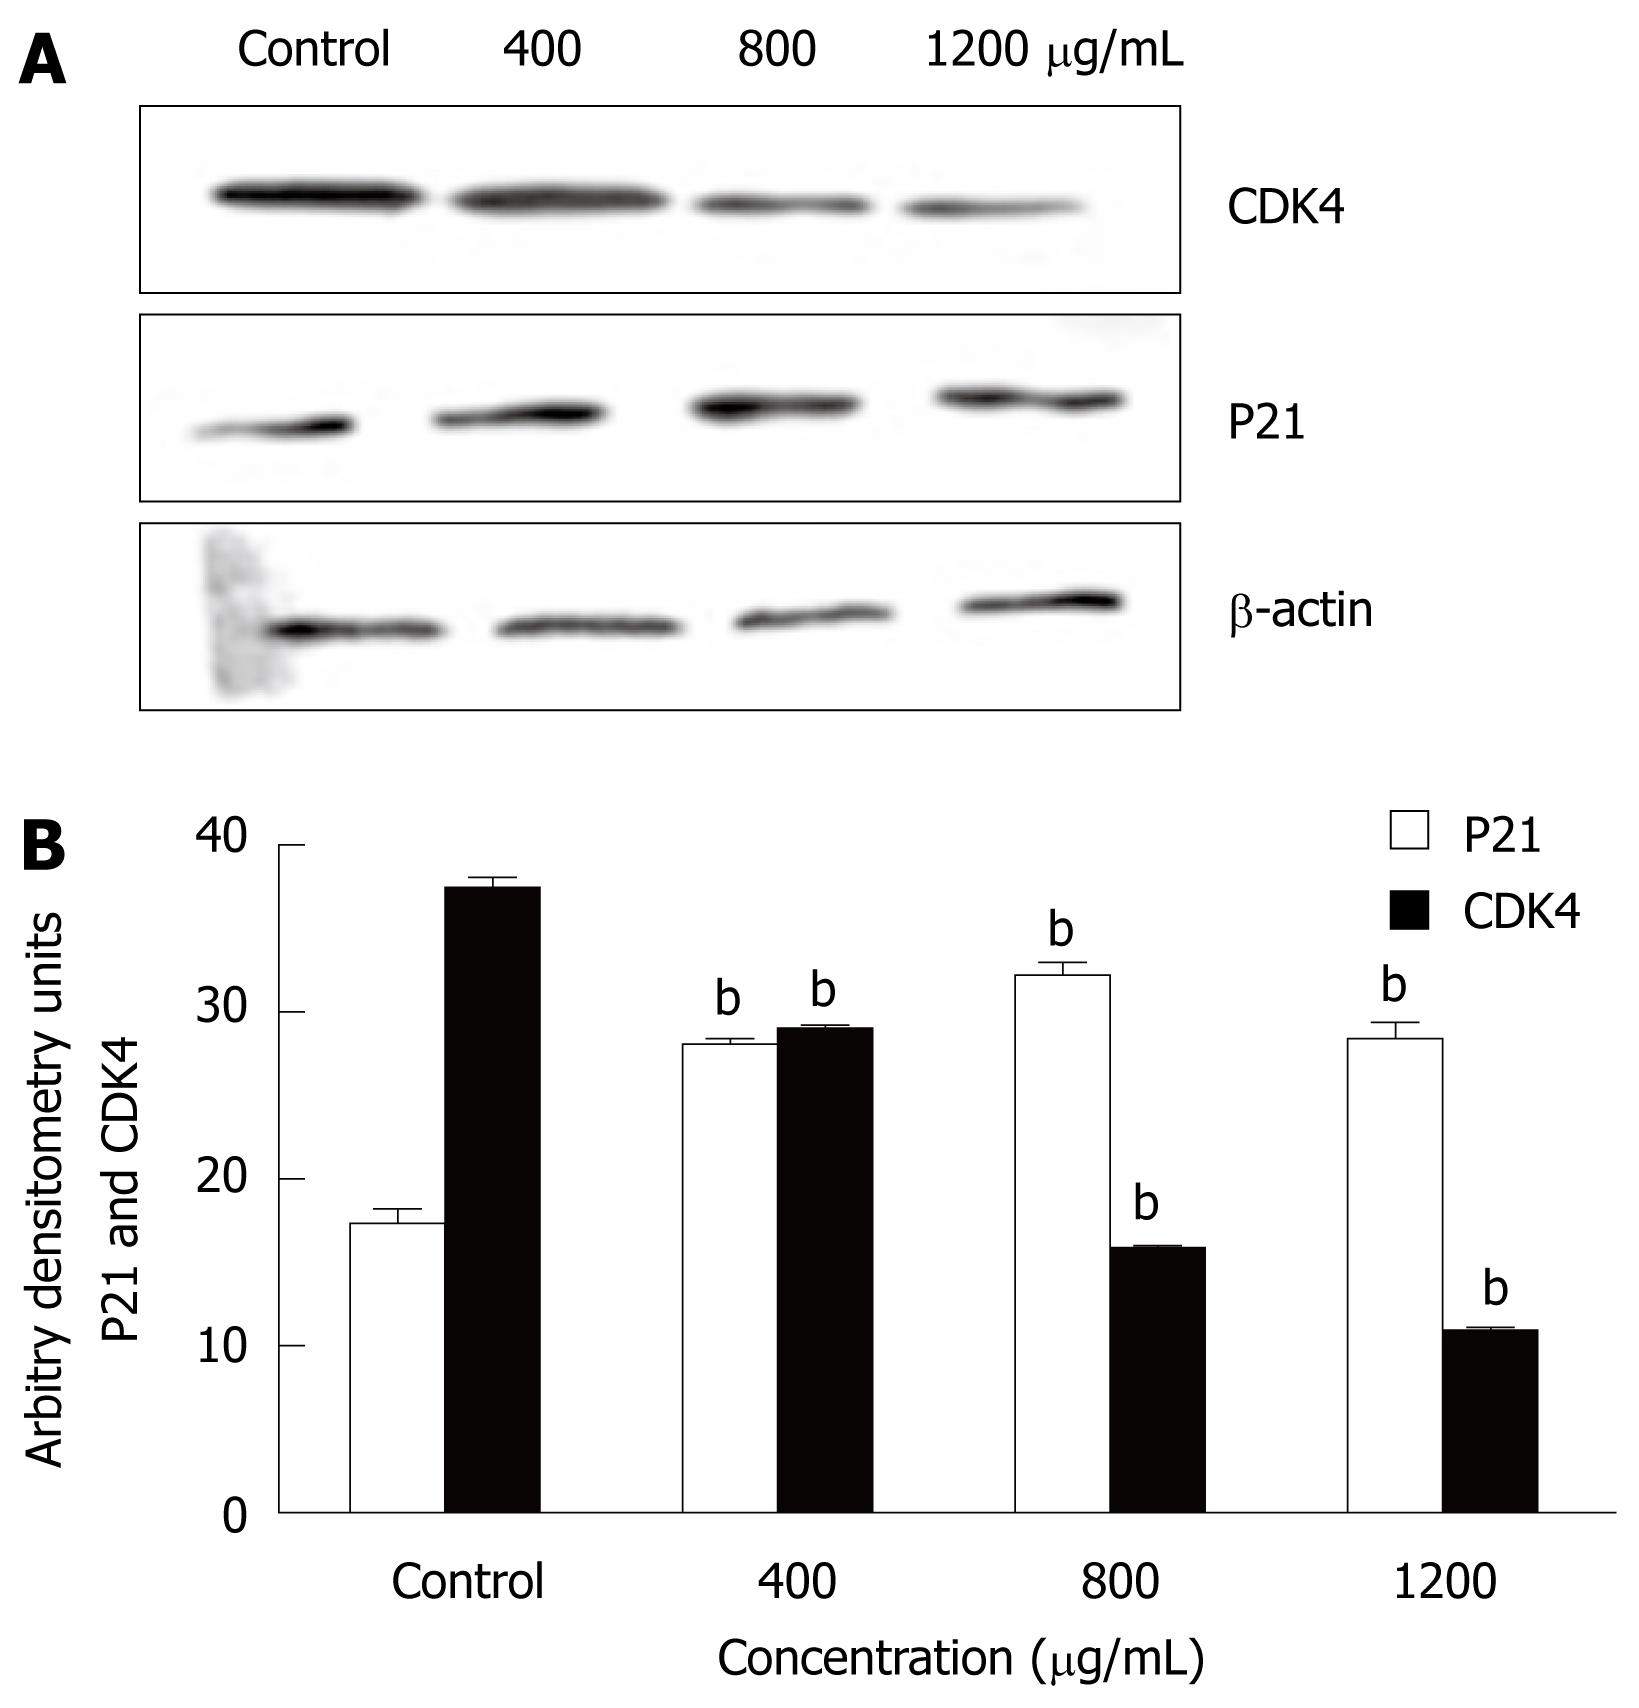
Figure 8 Effect of CIE on cell cycle-related protein expression.
A: The expression of CDK4 and P21 was assessed by Western blotting; B: Results presented are representative of 3 independent experiments. bP < 0.01 vs control group.
-
Citation: Li ZF, Wang ZD, Ji YY, Zhang S, Huang C, Li J, Xia XM. Induction of apoptosis and cell cycle arrest in human HCC MHCC97H cells with
Chrysanthemum indicum extract. World J Gastroenterol 2009; 15(36): 4538-4546 - URL: https://www.wjgnet.com/1007-9327/full/v15/i36/4538.htm
- DOI: https://dx.doi.org/10.3748/wjg.15.4538


