Copyright
©2009 The WJG Press and Baishideng.
World J Gastroenterol. Sep 28, 2009; 15(36): 4499-4510
Published online Sep 28, 2009. doi: 10.3748/wjg.15.4499
Published online Sep 28, 2009. doi: 10.3748/wjg.15.4499
Figure 1 Iron up-regulates HMOX1 mRNA levels in Huh-7, 9-13 and CNS3 cells.
A: HMOX1 mRNA levels in Huh-7, 9-13 and CNS3 cells; B: HMOX1 mRNA levels in Huh-7 cells treated with 100 μmol/L FeNTA or 1 mmol/L H2O2 for 6 h; C: HMOX1 mRNA levels in 9-13 cells treated with 100 μmol/L FeNTA or 1 mmol/L H2O2 for 6 h; D: HMOX1 mRNA levels in CNS3 cells treated with 100 μmol/L FeNTA or 1 mmol/L H2O2 for 6 h. Values for cells without any treatment were set equal to 1. HMOX1 mRNA data are presented as means ± SE from triplicate samples, all normalized to GAPDH in the same samples. aP < 0.05 vs control. Huh-7, 9-13 or CNS3 cells were cultured as described in Materials and Methods, and treated with 100 μmol/L FeNTA or 1 mmol/L H2O2 for 6 h. Cells were harvested and total RNA was extracted. Levels of mRNA for HMOX1 and GAPDH were measured by quantitative RT-PCR.
Figure 2 Effects of FeNTA on Nrf2 protein levels in Huh-7, 9-13, and CNS3 cells.
A: Nrf2 protein levels in Huh-7 cells; B: Nrf2 protein levels in 9-13 cells; C: Nrf2 protein levels in CNS3 cells. aP < 0.05 vs control. Huh-7, 9-13 or CNS3 cells were treated with different concentrations of FeNTA (0, 20, 50, 100 μmol/L) or 100 μmol/L NaNTA for 6 h, after which cells were harvested and total protein was isolated, as described in Materials and Methods. Proteins were separated on 4%-15% SDS-polyacrylamide gel, transferred to a PVDF membrane, and probed with anti-human Nrf2 and GAPDH specific antibodies. The relative amounts of Nrf2 proteins were normalized to GAPDH.
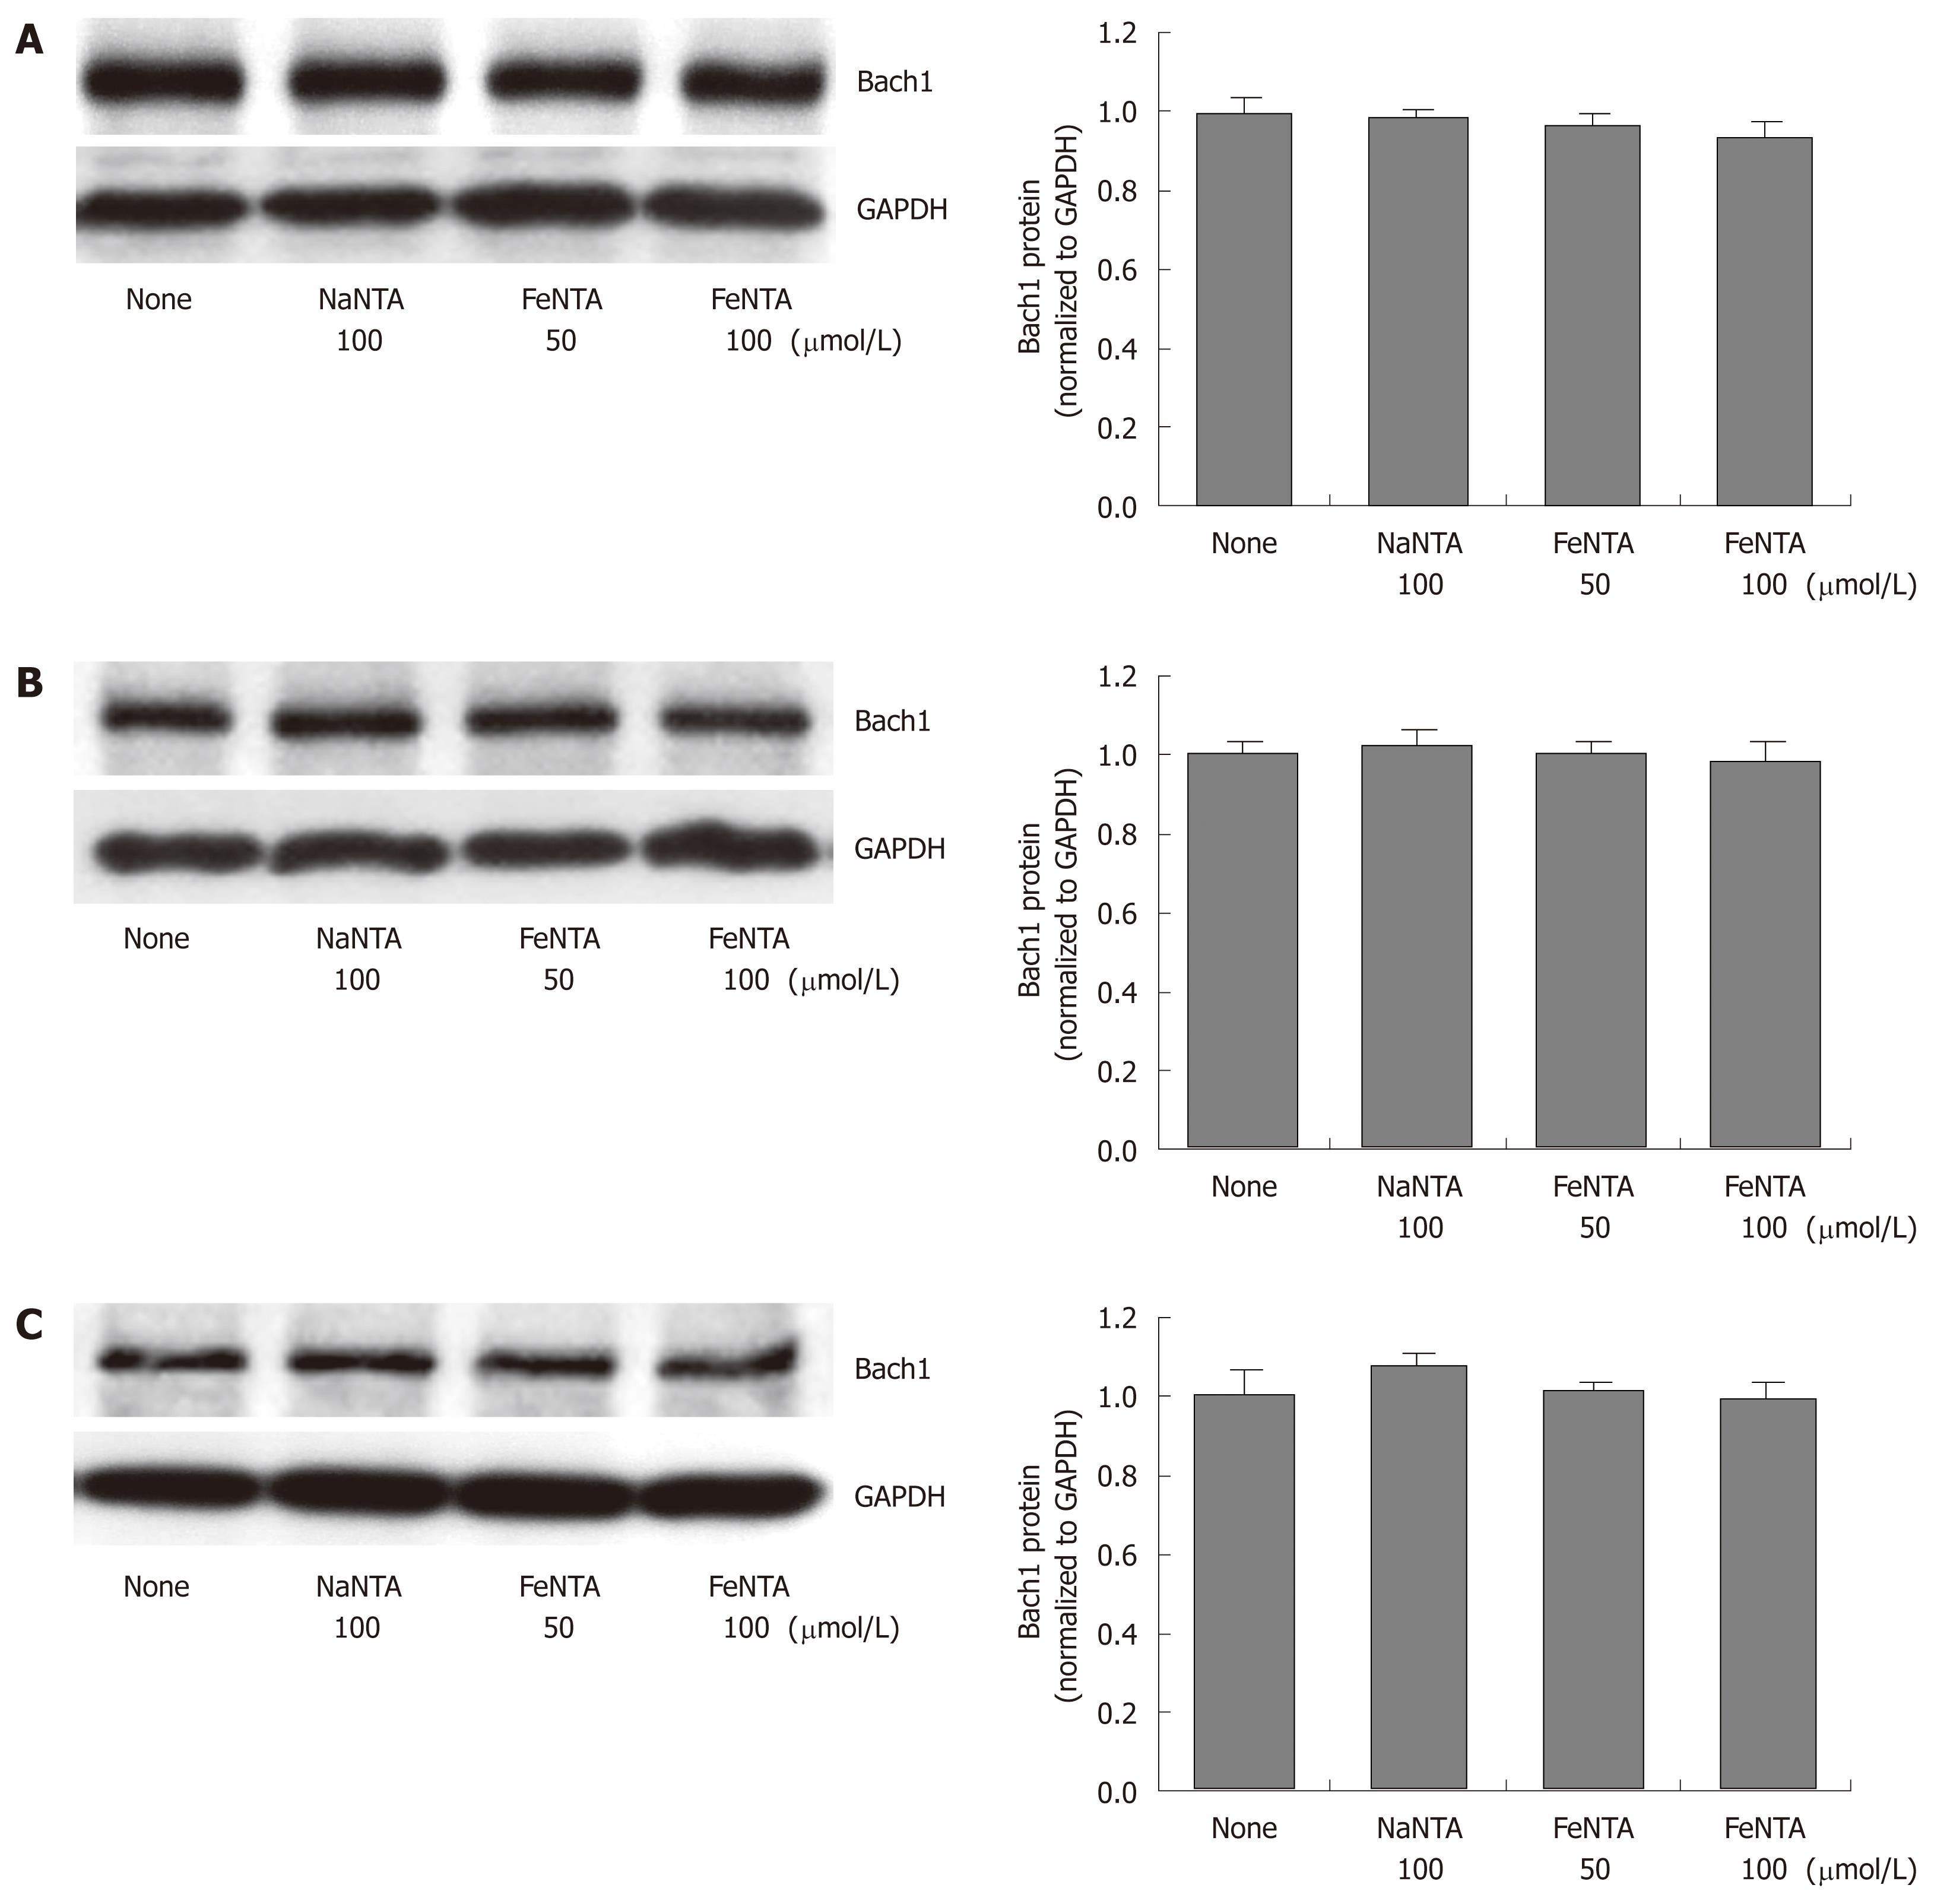
Figure 3 Effects of FeNTA on Bach1 protein levels in Huh-7, 9-13, and CNS3 cells.
A: Bach1 protein levels in Huh-7 cells; B: Bach1 protein levels in 9-13 cells; C: Bach1 protein levels in CNS3 cells. Huh-7, 9-13 or CNS3 cells were treated with different concentrations of FeNTA (0, 50, 100 μmol/L) or 100 μmol/L NaNTA for 16 h, after which cells were harvested and total protein was isolated, as described in Material and Methods. Proteins were separated on 4%-15% SDS-polyacrylamide gel, transferred to a PVDF membrane, and probed with anti-human Bach1 and GAPDH specific antibodies. The relative amounts of Bach1 were normalized to GAPDH.
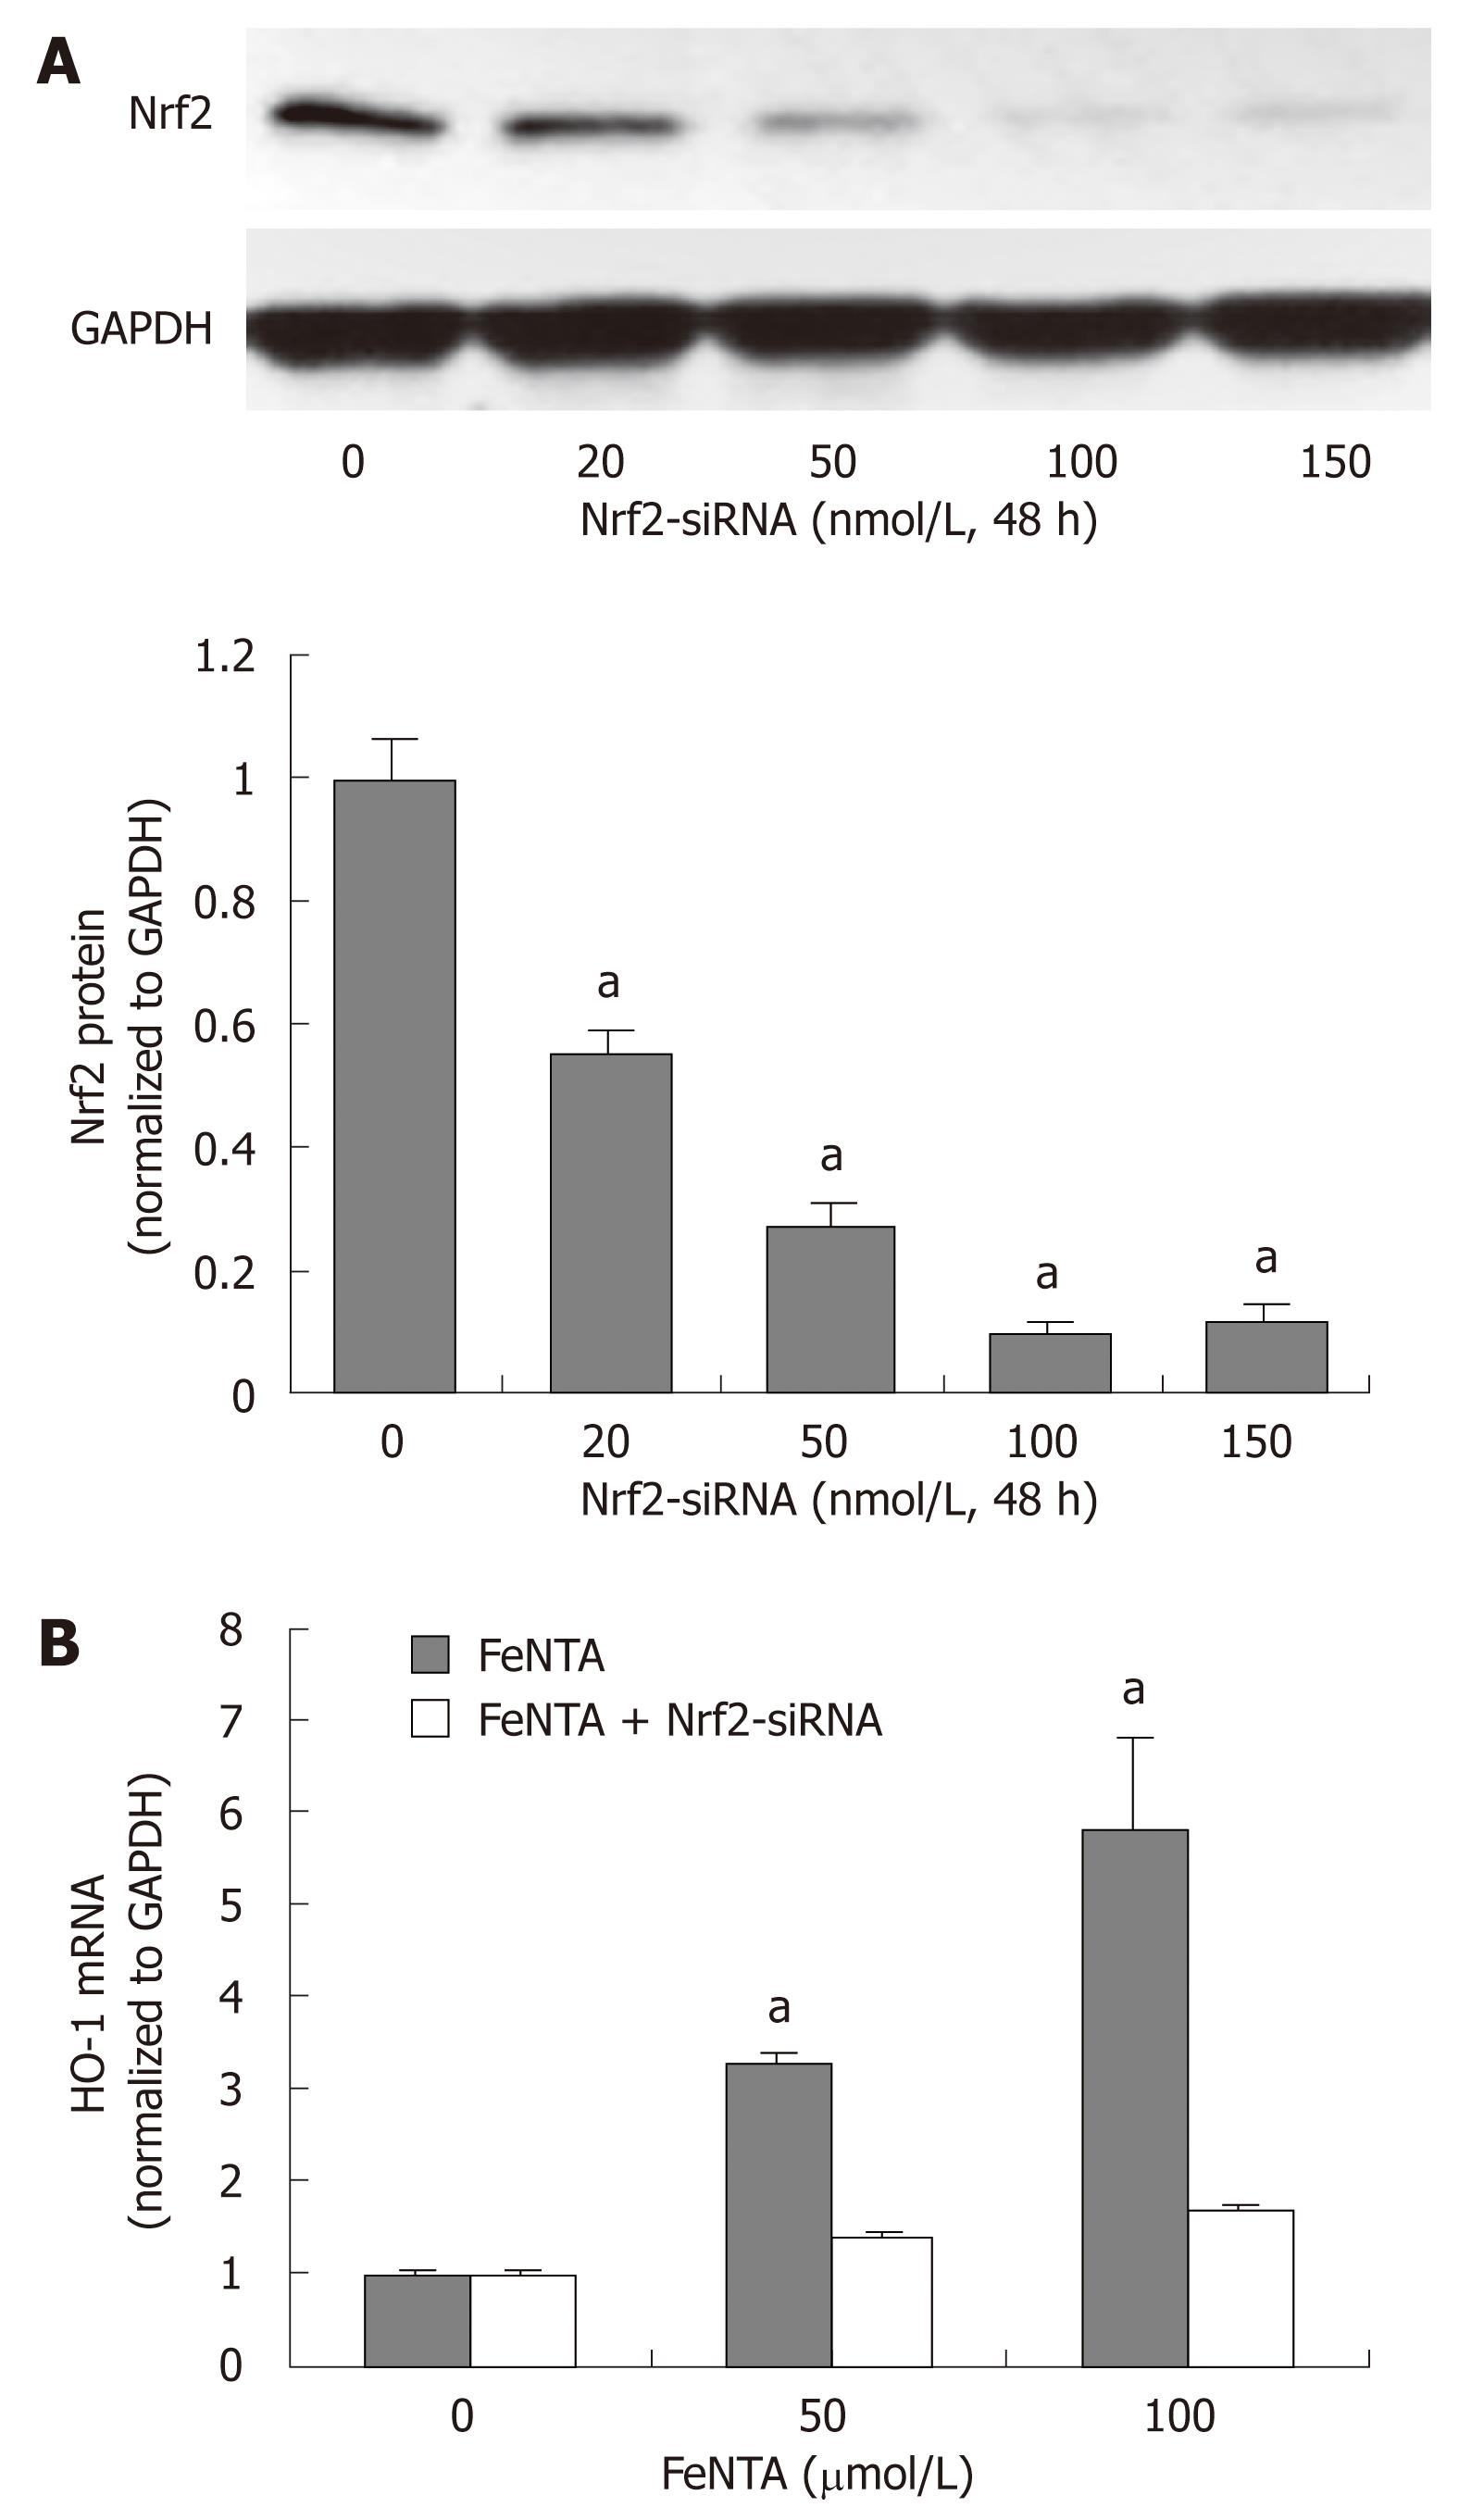
Figure 4 Silencing the Nrf2 gene abrogates up-regulation of the HMOX1 gene by iron.
A: Dose-response effect of Nrf2-specific siRNA on Nrf2 protein levels; B: Effect of Nrf2-specific siRNA on FeNTA up-regulated levels of HMOX1 mRNA. aP < 0.05 vs control. 9-13 cells were transfected with selected concentrations of Nrf2-siRNA (0, 20, 50, 100, 150 nmol/L). After 48 h of transfection, cells were treated with different concentrations of FeNTA (0, 50, 100 μmol/L) for 6 h, after which cells were harvested and total RNA was isolated. The HMOX1 mRNA levels were measured by quantitative RT-PCR as described in Materials and Methods.
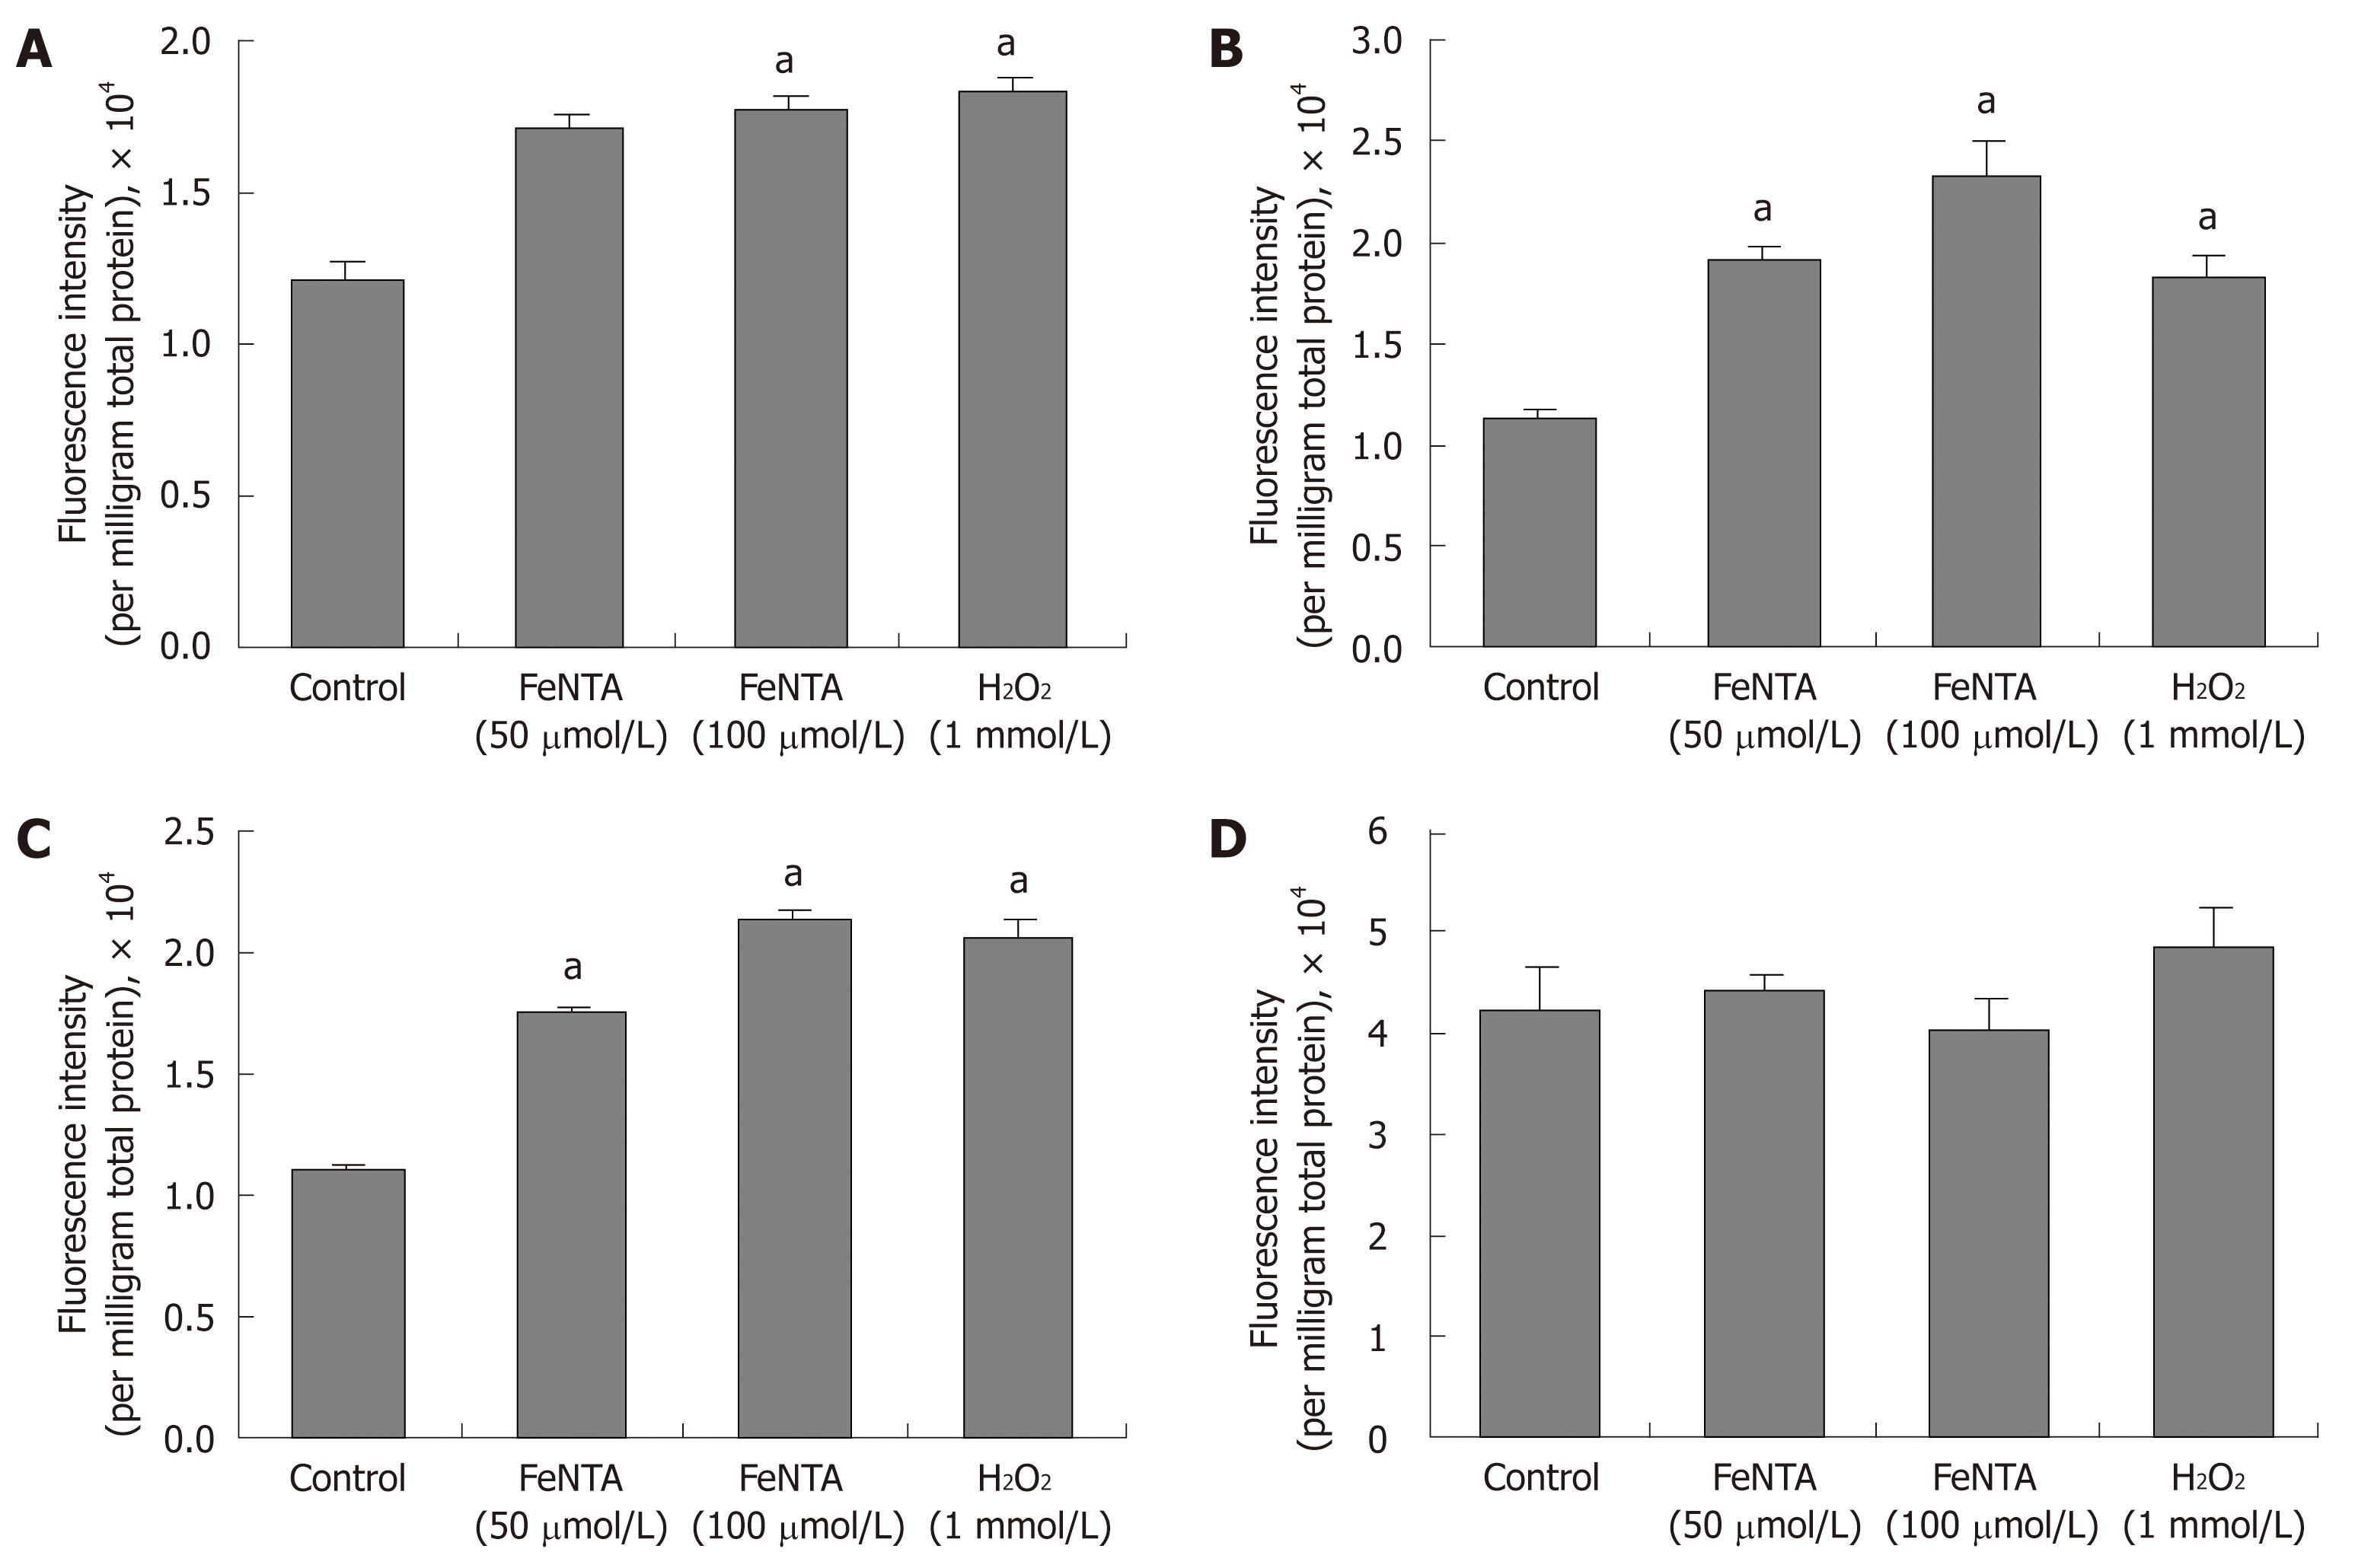
Figure 5 Effects of FeNTA on intracellular ROS in Huh-7, 9-13, and CNS3 cells.
A: Fluorescence intensity with the H2DCF-DA probe in Huh-7 cells; B: Fluorescence intensity with the H2DCF-DA probe in 9-13 cells; C: Fluorescence intensity with the H2DCF-DA probe in CNS3 cells; D: Fluorescence intensity with the (control) DCF-DA in CNS3 cells. Cells were preincubated with 100 μmol/L H2DCF-DA or DCF-DA for 30 min, and then exposed to selected concentrations of FeNTA (0, 50, 100 μmol/L) for 1 h. Intracellular ROS production was measured as described in Materials and Methods. Data represent fluorescence intensity measured and expressed as relative fluorescence units per milligram total protein (mean ± SE, n = 3 experiments). aP < 0.05 vs control.
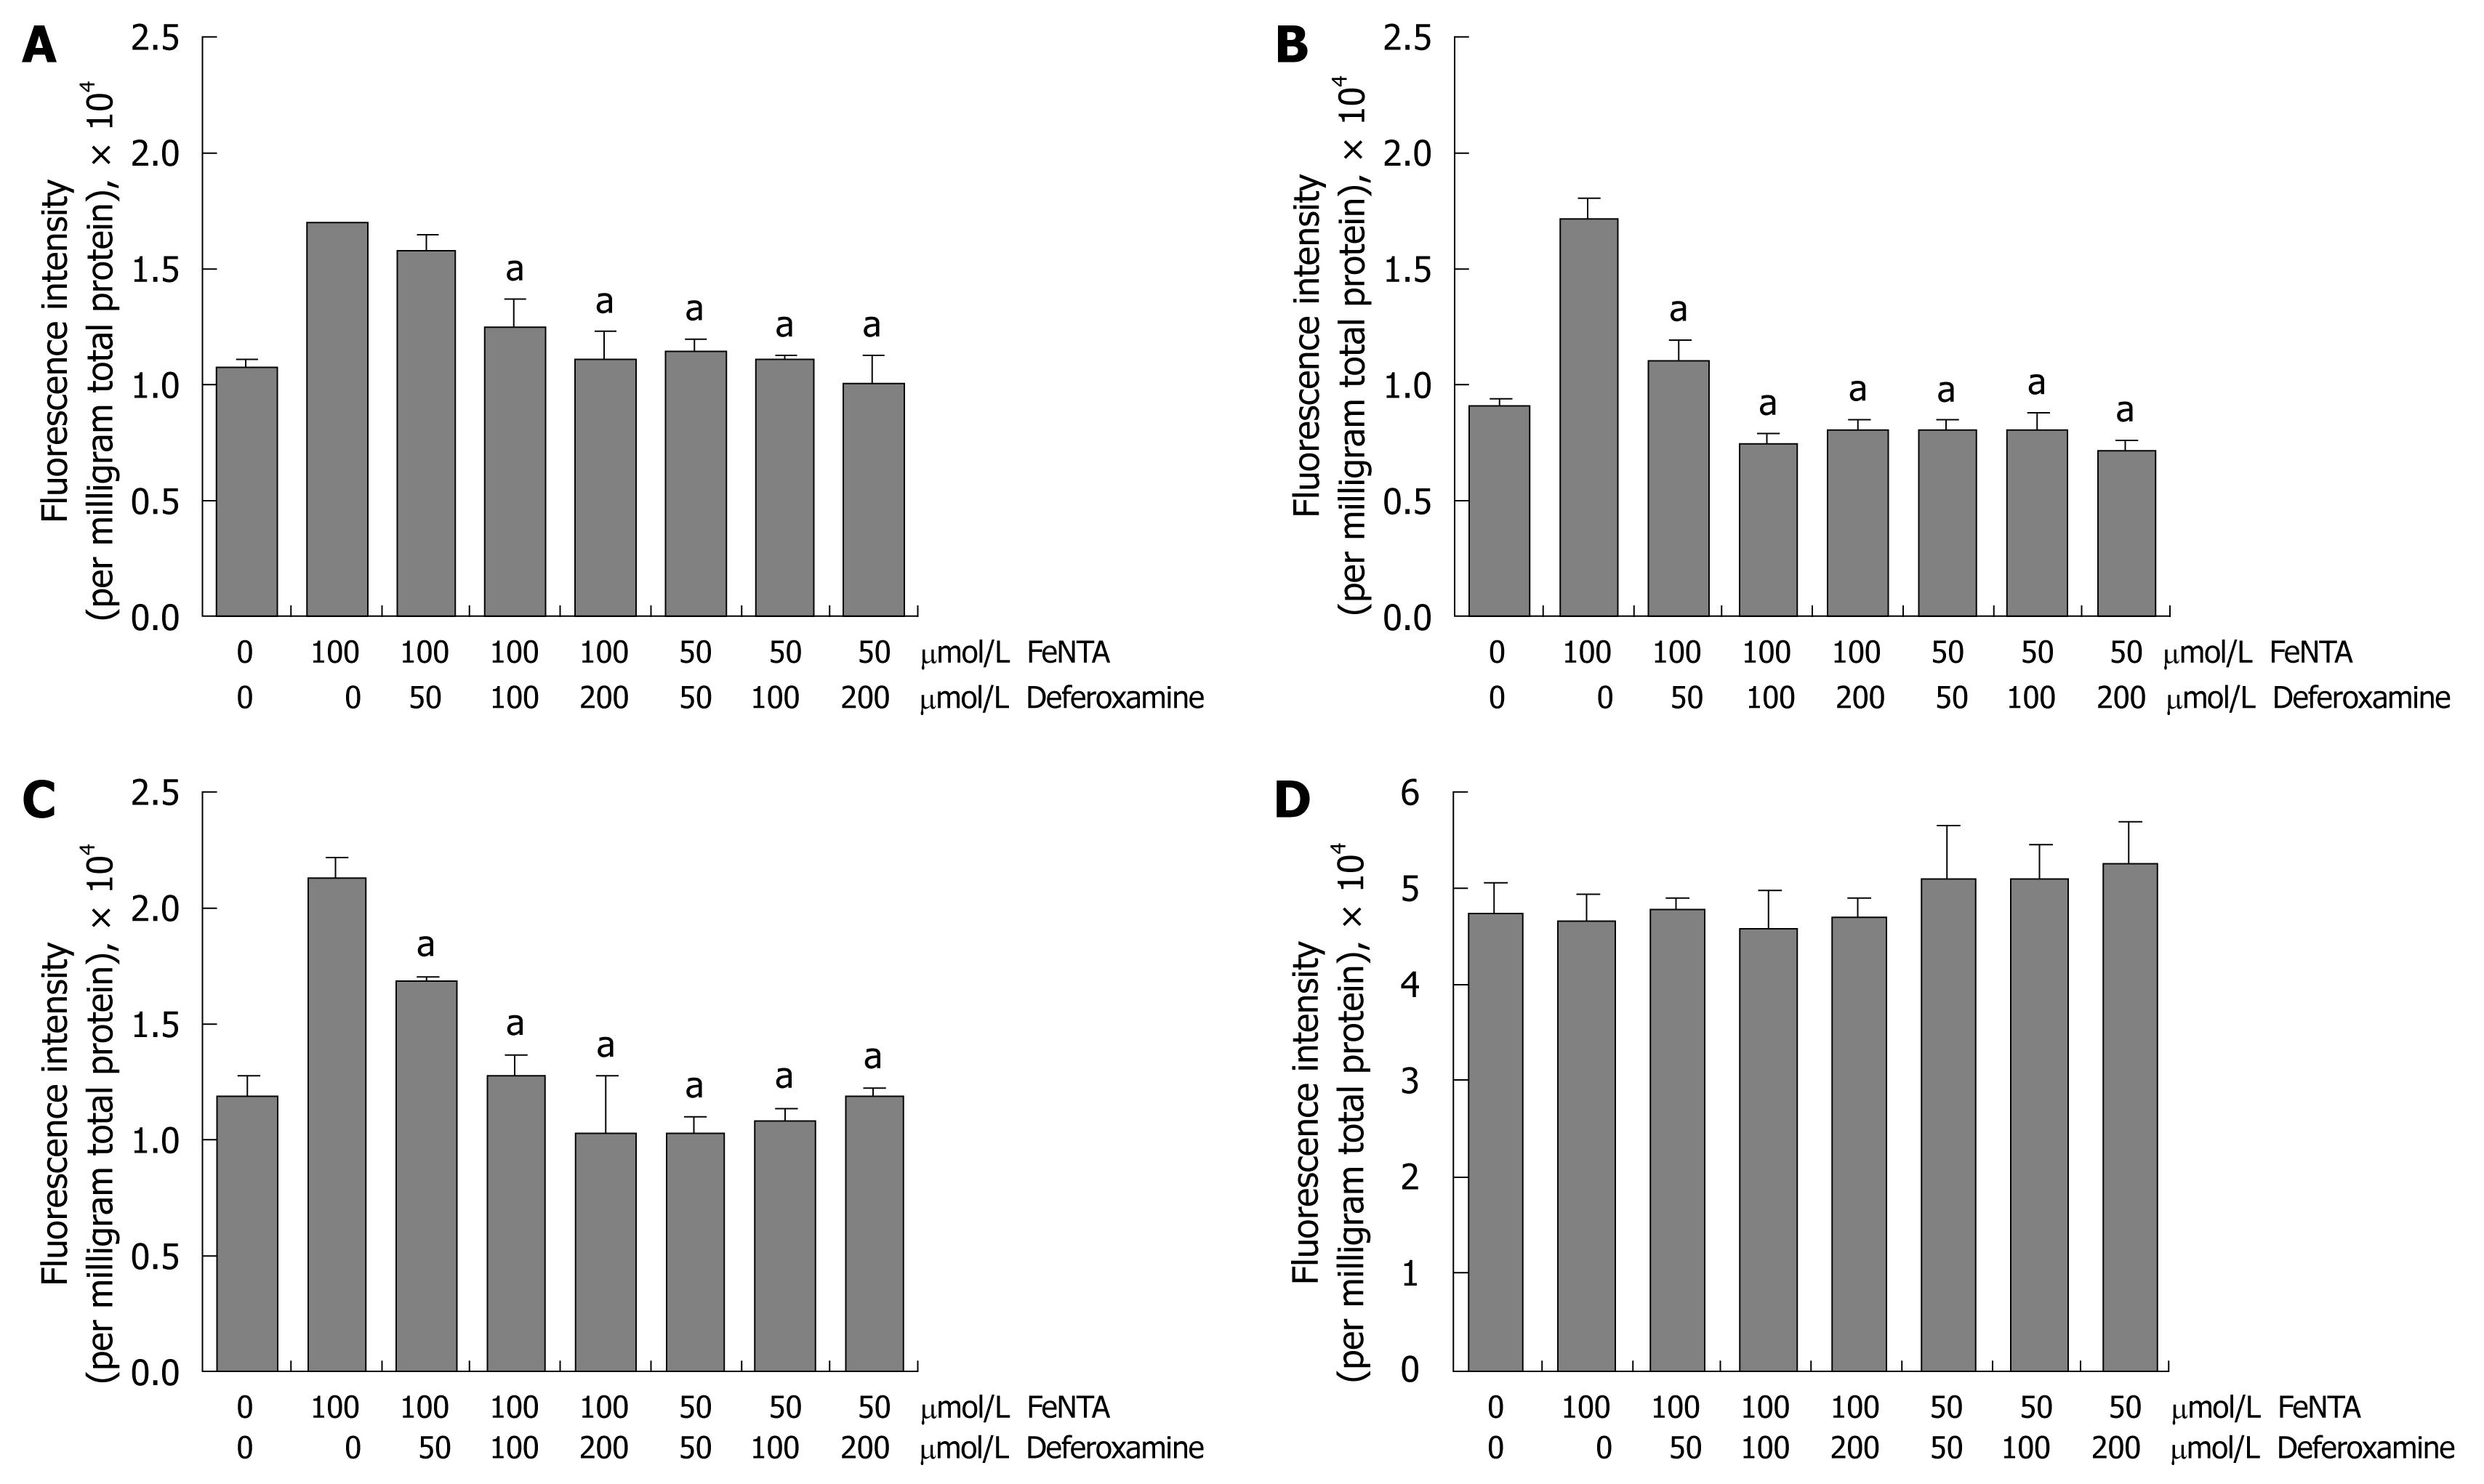
Figure 6 Effects of deferoxamine on intracellular ROS induced by FeNTA in Huh-7, 9-13, and CNS3 cells.
A: Fluorescence intensity with the H2DCF-DA probe in Huh-7 cells; B: Fluorescence intensity with the H2DCF-DA probe in 9-13 cells; C: Fluorescence intensity with the H2DCF-DA probe in CNS3 cells; D: Fluorescence intensity with the (control) DCF-DA in CNS3 cells. Cells were loaded with 100 μmol/L H2DCF-DA for 30 min, treated with different concentrations of deferoxamine (50, 100, 200 μmol/L) for 30 min, and then exposed to different concentrations of FeNTA (50, 100 μmol/L) for 1 h. Intracellular ROS production was measured as described in Materials and Methods.
Figure 7 Effects of FeNTA on HCV core and NS5A mRNA and protein levels.
A: Core mRNA levels in Con1 cells treated with FeNTA and with or without deferoxamine; B: Core protein levels in Con1 cells treated with FeNTA and with or without deferoxamine; C: NS5A mRNA levels in Con1 cells treated with FeNTA and with or without deferoxamine; D: NS5A protein levels in Con1 cells treated with FeNTA and with or without deferoxamine. Data are presented as mean ± SE from triplicate samples, all normalized to GAPDH in the same samples. aP < 0.05 vs control. The Con1 full length HCV replicon cells were treated with indicated concentrations of FeNTA and with or without deferoxamine. After 24 h, cells were harvested and total RNA and proteins were extracted. Levels of mRNA were measured by quantitative RT-PCR, and protein levels were determined by Western blots as described in Materials and Methods. Values for cells without any treatment were set equal to 1.
- Citation: Hou WH, Rossi L, Shan Y, Zheng JY, Lambrecht RW, Bonkovsky HL. Iron increases HMOX1 and decreases hepatitis C viral expression in HCV-expressing cells. World J Gastroenterol 2009; 15(36): 4499-4510
- URL: https://www.wjgnet.com/1007-9327/full/v15/i36/4499.htm
- DOI: https://dx.doi.org/10.3748/wjg.15.4499


