Copyright
©2009 The WJG Press and Baishideng.
World J Gastroenterol. Sep 21, 2009; 15(35): 4415-4422
Published online Sep 21, 2009. doi: 10.3748/wjg.15.4415
Published online Sep 21, 2009. doi: 10.3748/wjg.15.4415
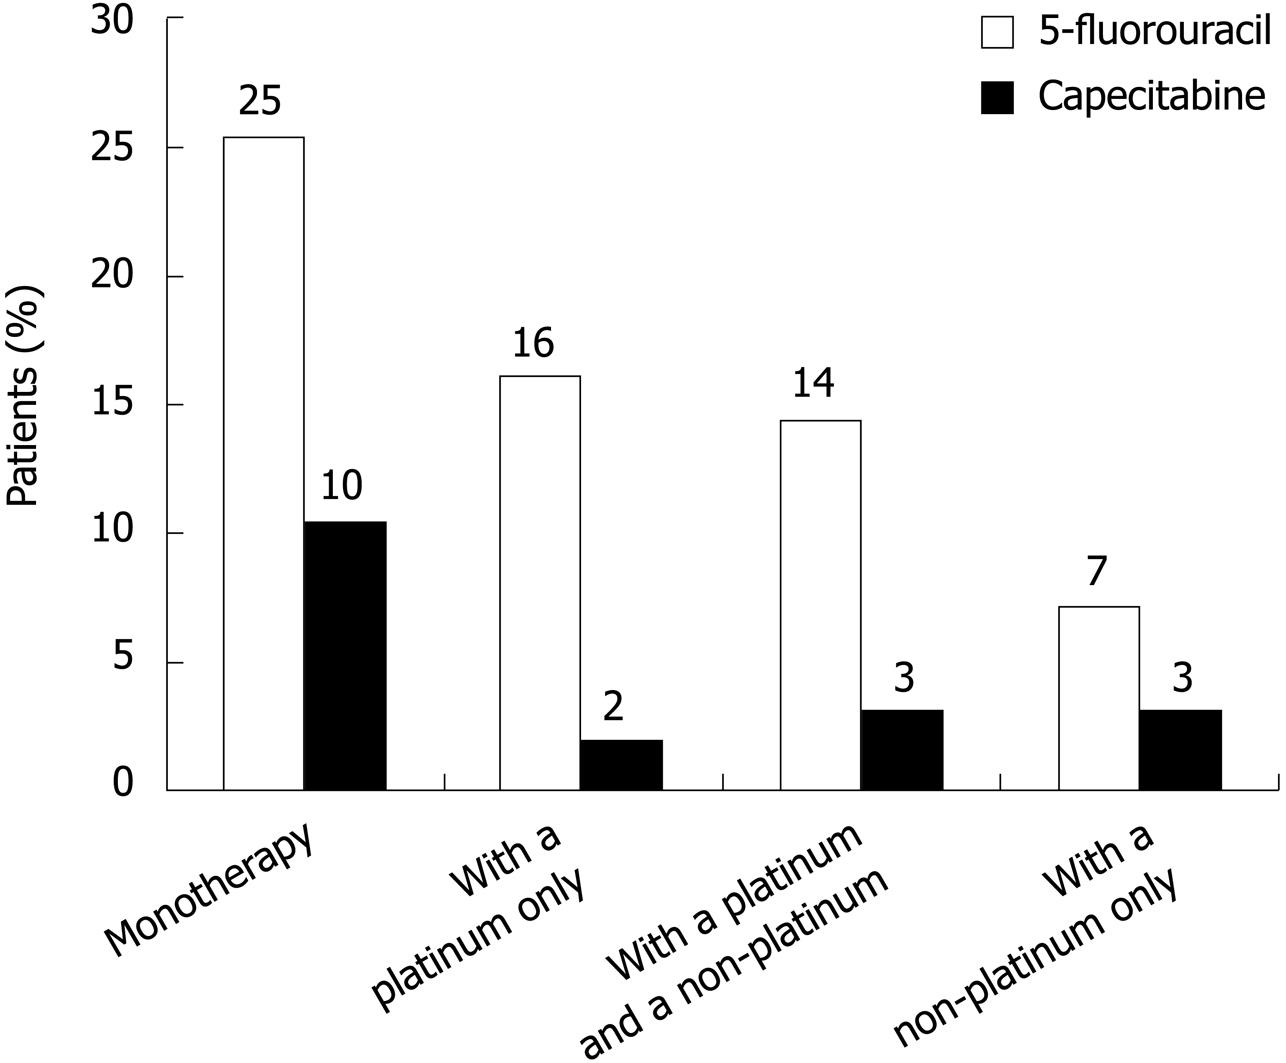
Figure 1 Chemotherapy treatment patterns across all settings in patients with GEC (n = 1013).
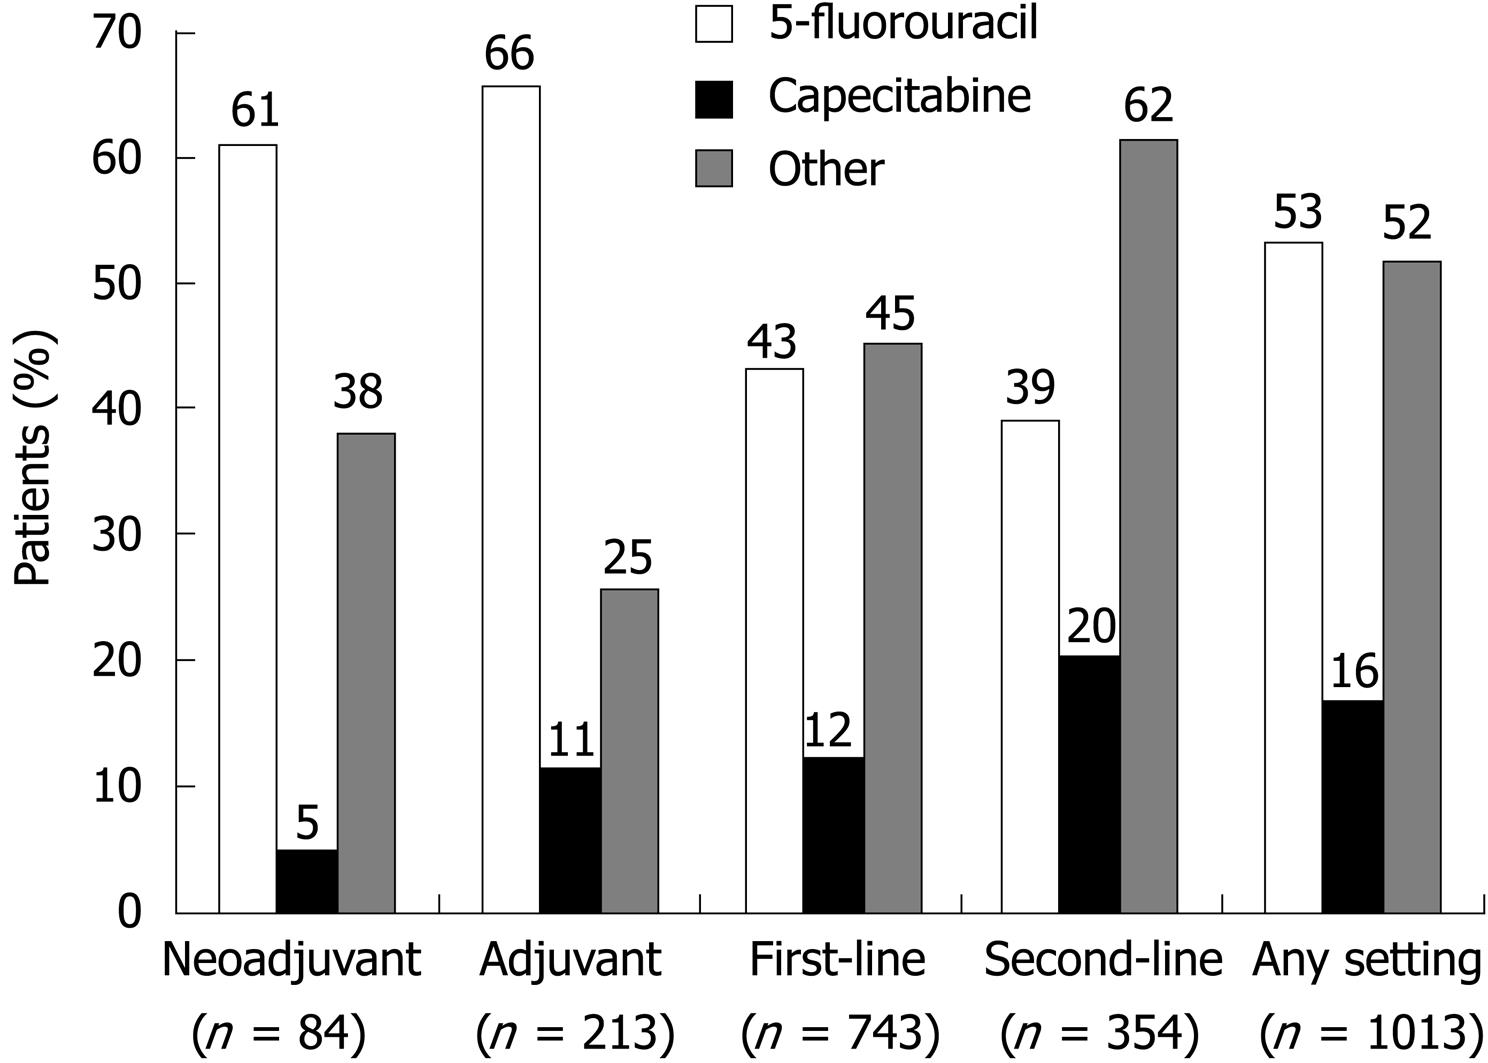
Figure 2 Distribution of chemotherapy by treatment setting.
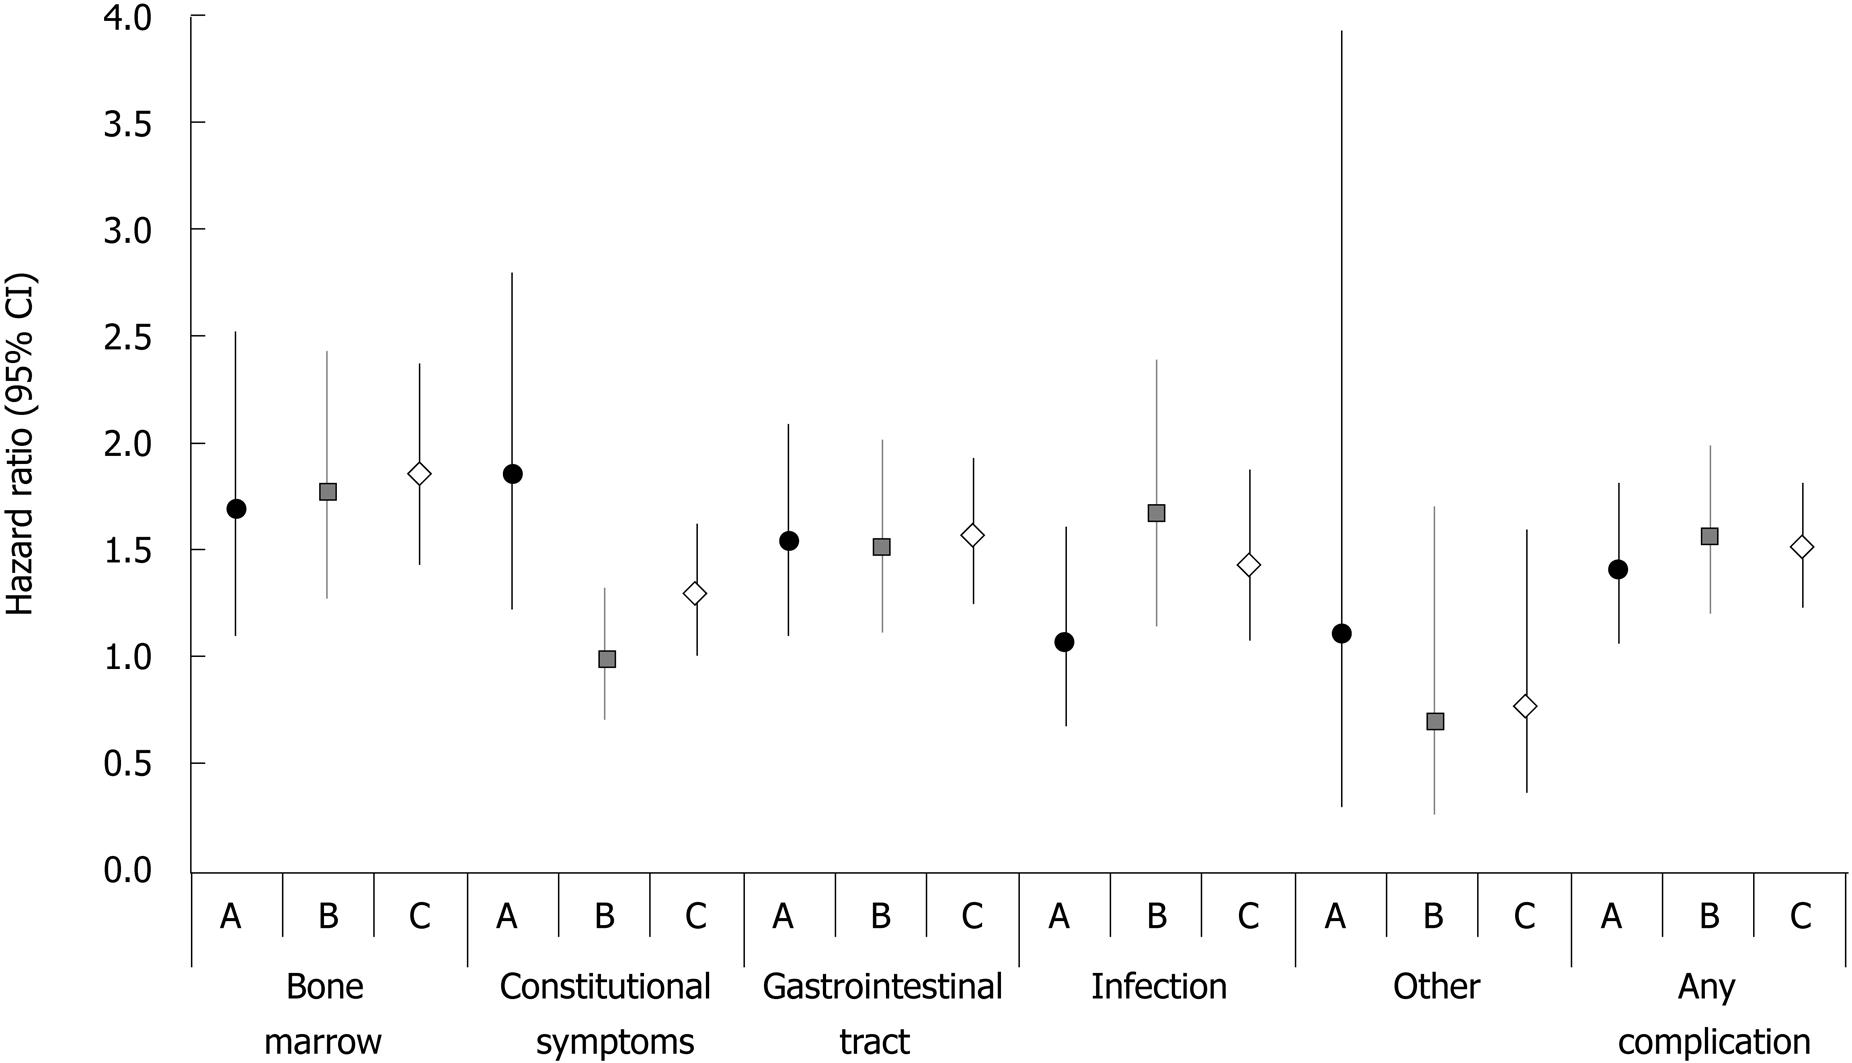
Figure 3 Adjusted complication hazard ratio: 5-FU vs capecitabine regimens.
A: 5-FU monotherapy compared with capecitabine monotherapy; B: 5-FU combination compared with capecitabine combination; C: Any 5-FU regimen compared with any capecitabine regimen. Complications were determined per 1000 person-months.
- Citation: Saif MW, Shi N, Zelt S. Capecitabine treatment patterns in patients with gastroesophageal cancer in the United States. World J Gastroenterol 2009; 15(35): 4415-4422
- URL: https://www.wjgnet.com/1007-9327/full/v15/i35/4415.htm
- DOI: https://dx.doi.org/10.3748/wjg.15.4415


