Copyright
©2009 The WJG Press and Baishideng.
World J Gastroenterol. Aug 21, 2009; 15(31): 3901-3907
Published online Aug 21, 2009. doi: 10.3748/wjg.15.3901
Published online Aug 21, 2009. doi: 10.3748/wjg.15.3901
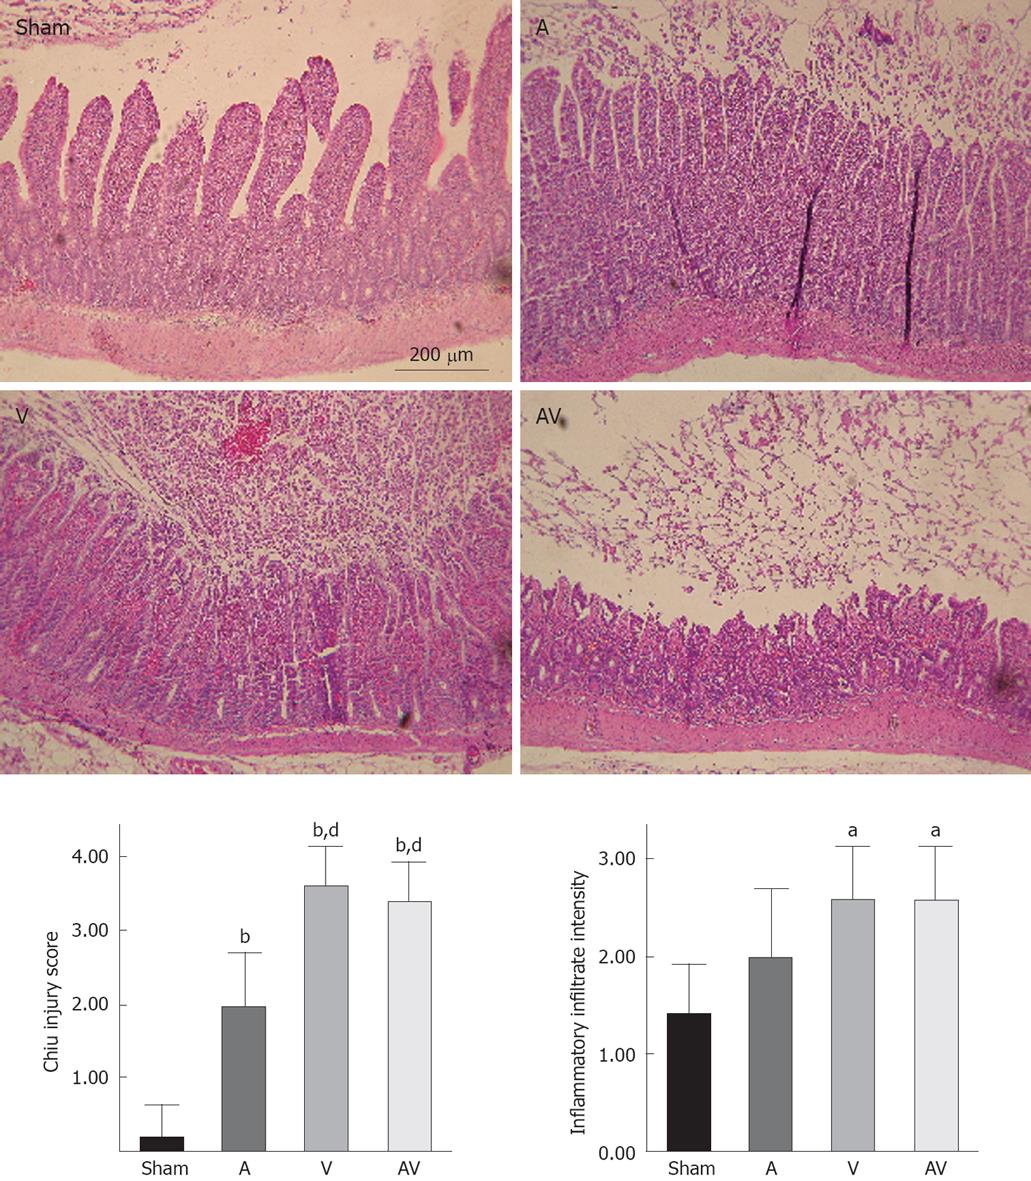
Figure 1 Histological findings (H & E) and injury scores.
A: Arterial occlusion and reperfusion group; V: Venous occlusion and reperfusion group; AV: Both arterial and venous occlusion and reperfusion group. aP < 0.05 vs sham; bP < 0.01 vs sham; dP < 0.01 vs A.
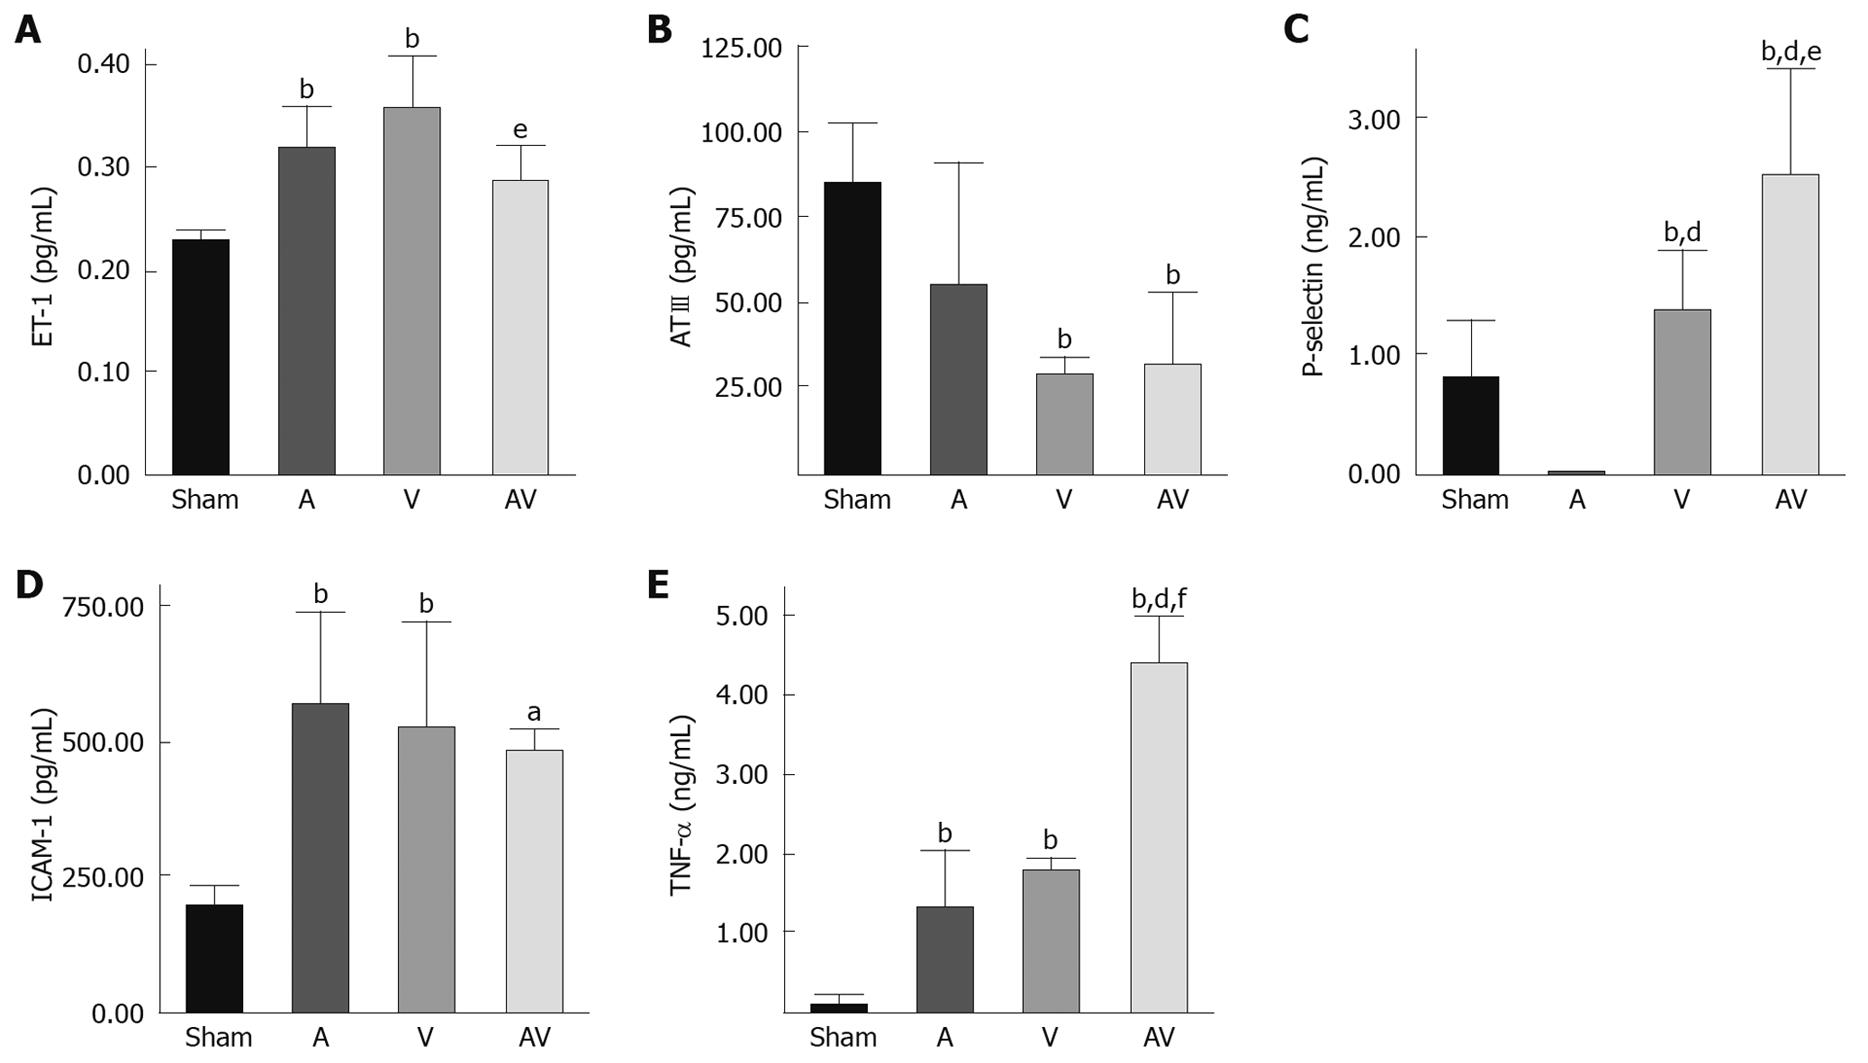
Figure 2 Serum concentrations of endothelial function markers and TNF-α.
A: ET-1 serum concentrations; B: ATIII serum concentrations; C: P-selectin serum concentrations; D: Serum levels of soluble ICAM-1; E: TNF-α serum concentrations. aP < 0.05 vs sham; bP < 0.01 vs sham; dP < 0.01 vs A; eP < 0.05 vs V; fP < 0.01 vs V.
- Citation: Guzmán-de la Garza FJ, Cámara-Lemarroy CR, Alarcón-Galván G, Cordero-Pérez P, Muñoz-Espinosa LE, Fernández-Garza NE. Different patterns of intestinal response to injury after arterial, venous or arteriovenous occlusion in rats. World J Gastroenterol 2009; 15(31): 3901-3907
- URL: https://www.wjgnet.com/1007-9327/full/v15/i31/3901.htm
- DOI: https://dx.doi.org/10.3748/wjg.15.3901


