Copyright
©2009 The WJG Press and Baishideng.
World J Gastroenterol. Aug 21, 2009; 15(31): 3874-3883
Published online Aug 21, 2009. doi: 10.3748/wjg.15.3874
Published online Aug 21, 2009. doi: 10.3748/wjg.15.3874
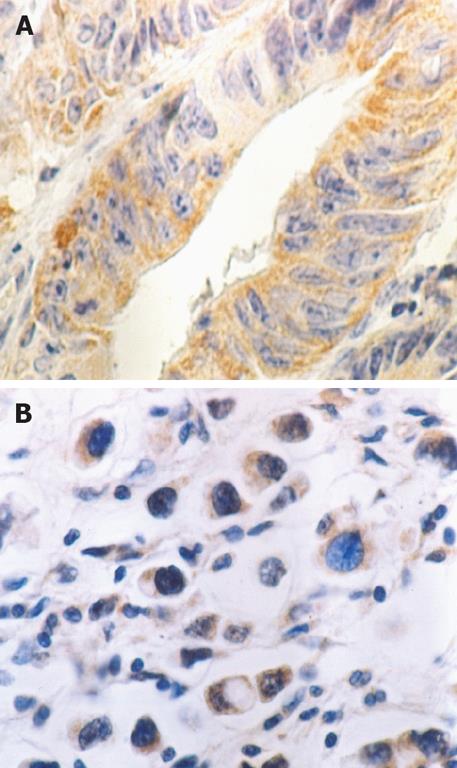
Figure 1 Peroxisome proliferator-activated receptor-γ (PPAR-γ) protein in the cytoplasm of gastric carcinoma cells by immunohistochemistry (3,3’-diaminobenzidine and hematoxylin staining × 400).
A: Well differentiated gastric carcinoma; B: Poorly differentiated gastric carcinoma.
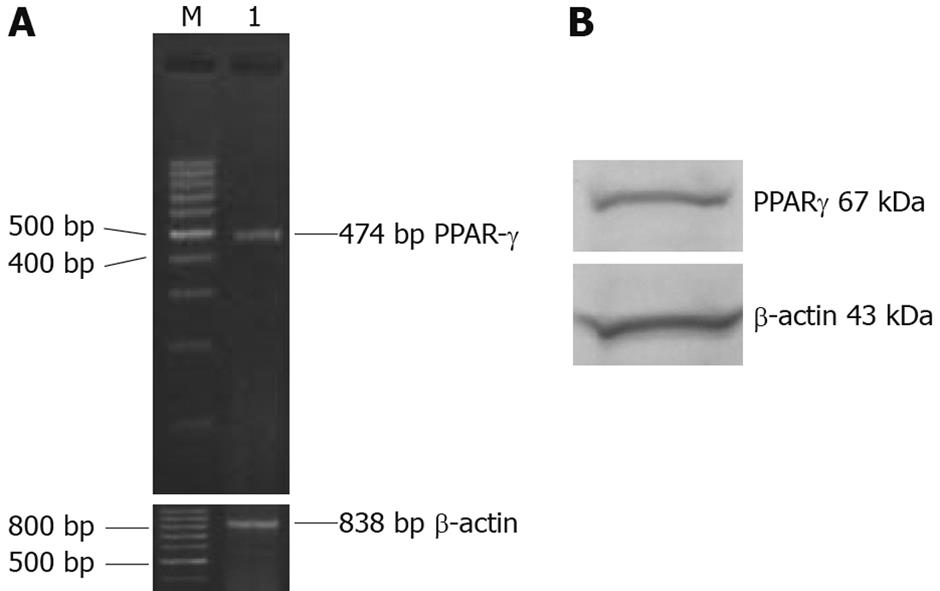
Figure 2 PPAR-γ mRNA and protein expression in gastric carcinoma cell line MGC803.
A: PPARγ mRNA expression examined in MGC803 cells by reverse transcriptase-polymerase chain reaction. M: 100 bp DNA marker and 500 bp was the brightest; 1: MGC803 cells. B: PPAR-γ protein expression examined by Western blotting in MGC803 cells.
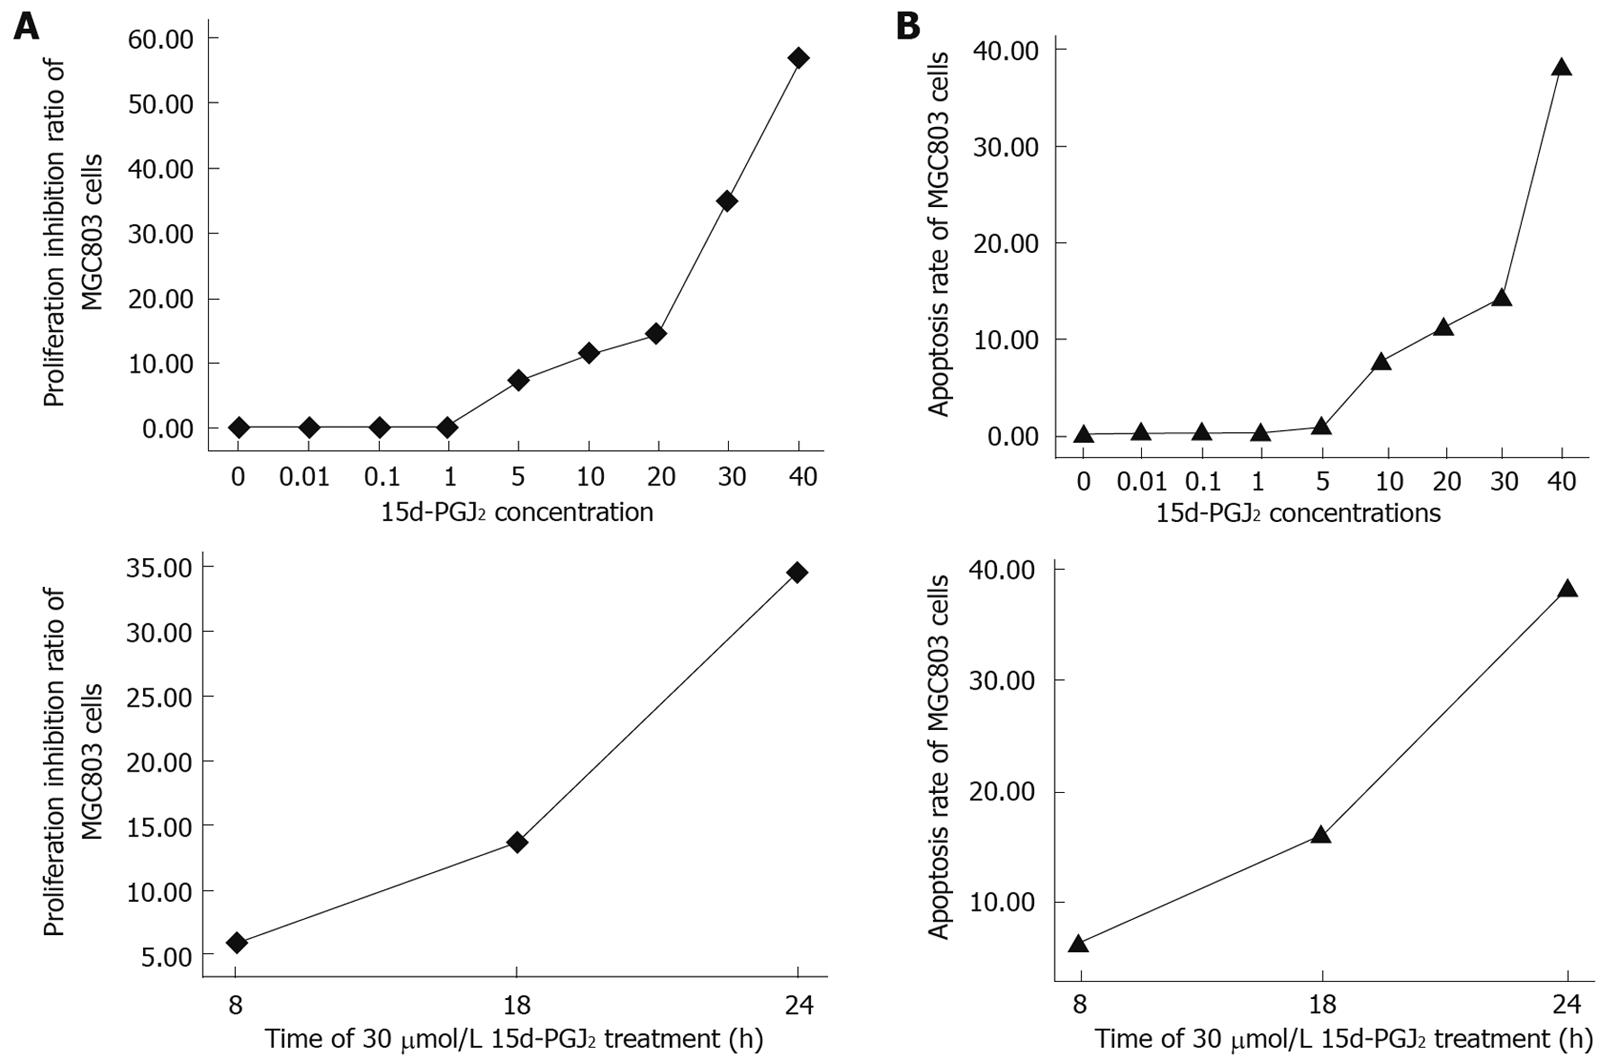
Figure 3 15d-PGJ2 inhibited proliferation (A) and induced apoptosis (B) of MGC803 cells in a concentrationdependent and time-dependent manner.
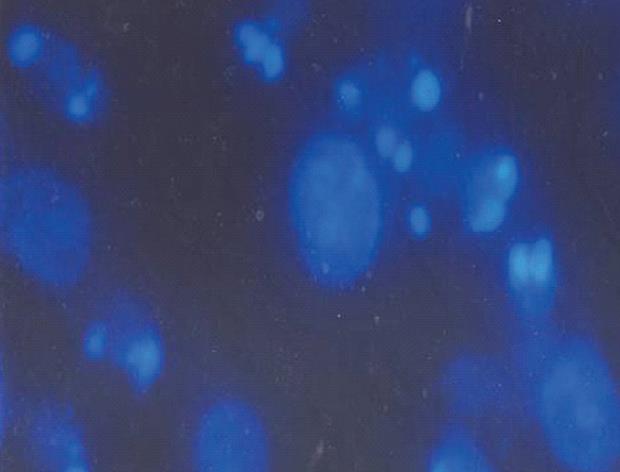
Figure 4 Morphological changes of MGC803 cells 24 h after treatment with 30 μmol/L 15d-PGJ2.
Cell shapes were observed by fluorescence microscopy (Hoechst 33342 staining, × 400). Nuclear chromatin condensation, marginalization of nuclear chromatin and half moon formation, nuclear fragments with bright chromatin and apoptotic bodies were easily identified in some cells.
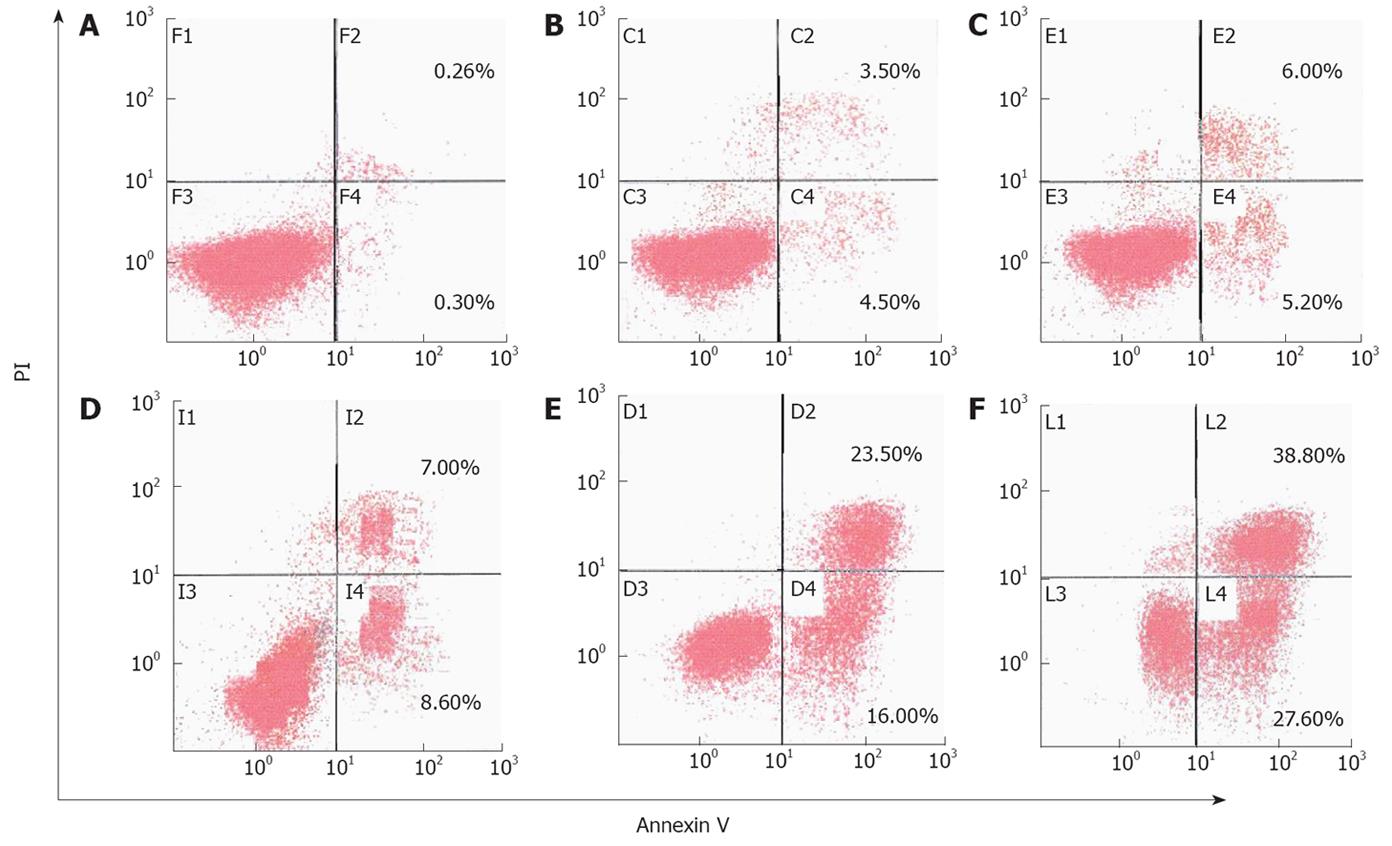
Figure 5 Apoptosis rate of MGC803 cells detected by flow cytometry 24 h after treatment with 15d-PGJ2 at various concentrations.
A: 0 μmol/L; B: 5 μmol/L; C: 10 μmol/L; D: 20 μmol/L; E: 30 μmol/L; F: 40 μmol/L.
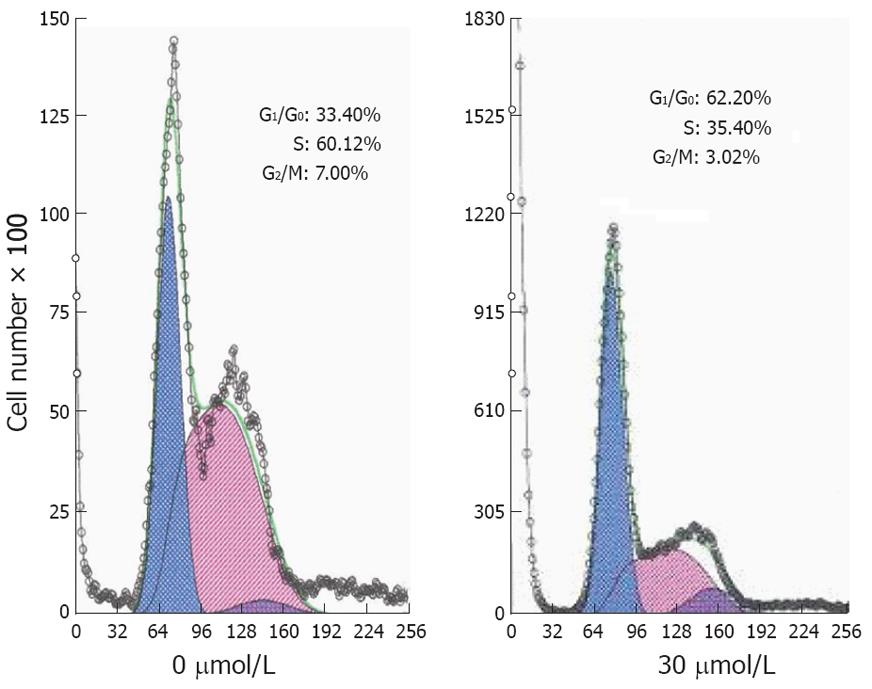
Figure 6 Cell cycle distribution of MGC803 cells by flow cytometry 24 h after treatment with 15d-PGJ2 at various concentrations.
15d-PGJ2 at 30 μmol/L could significantly increase the proportion of cells in the G0/G1 phase (P < 0.001) and decrease the proportion in the S and G2/M phases in MGC803 cells (P < 0.001 and P < 0.01).
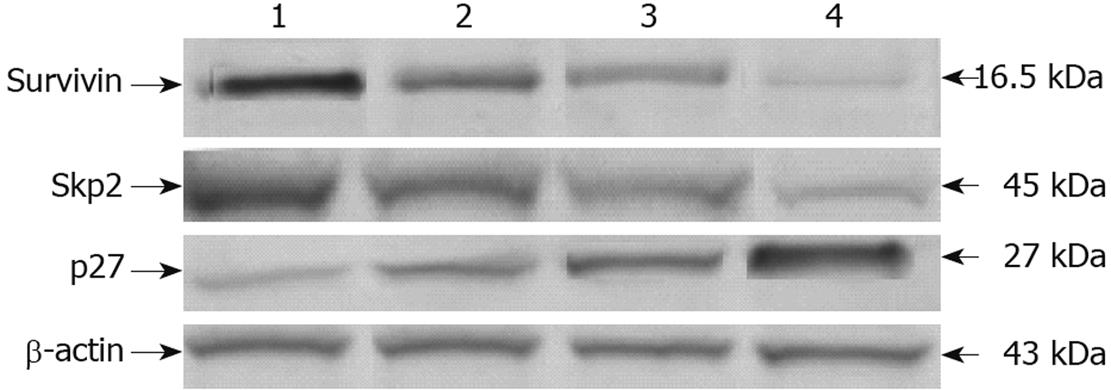
Figure 7 Survivin, Skp2 and p27 protein expression by Western blotting in MGC803 cells 24 h after treatment with 15d-PGJ2 at various concentrations.
Lane 1: 0 μmol/L; Lane 2: 5 μmol/L; Lane 3: 20 μmol/L; Lane 4: 30 μmol/L. Survivin and Skp2 protein decreased and p27 protein increased with increasing concentrations of 15d-PGJ2.
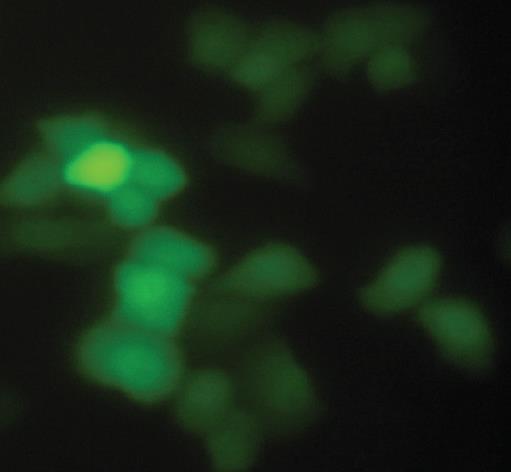
Figure 8 Human gastric carcinoma MGC803 cells observed by fluorescence microscopy 48 h after pSi1 transfection.
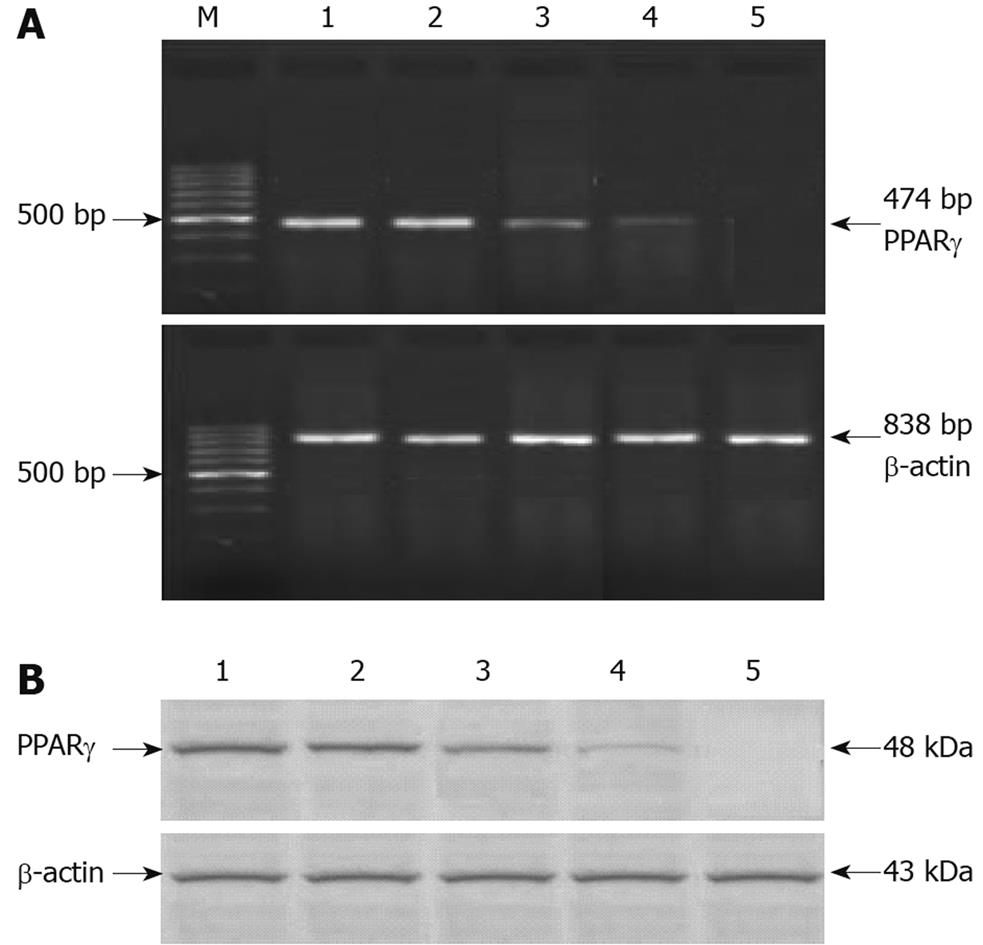
Figure 9 PPARγ after pSi transfection.
A: PPARγ mRNA expression in various cells detected by RT-PCR 48 h after transfection; B: PPARγ protein expression in various cells 48 h after transfection as detected by Western blotting. Lane M: 100 bp DNA marker, 500 bp was the brightest; Lane 1: MGC803-N (normal MGC803 cells); Lane 2: MGC803-HK (MGC803 cells transfected by empty vector); Lane 3: MGC803-pSi3 (MGC803 cells transfected by pSi3 vector); Lane 4: MGC803-pSi2 (MGC803 cells transfected by pSi2 vector); Lane 5: MGC803-pSi1 (MGC803 cells transfected by pSi1 vector). The effect of pSi1 was best in silencing PPAR-γ mRNA and protein expression in MGC803 cells.
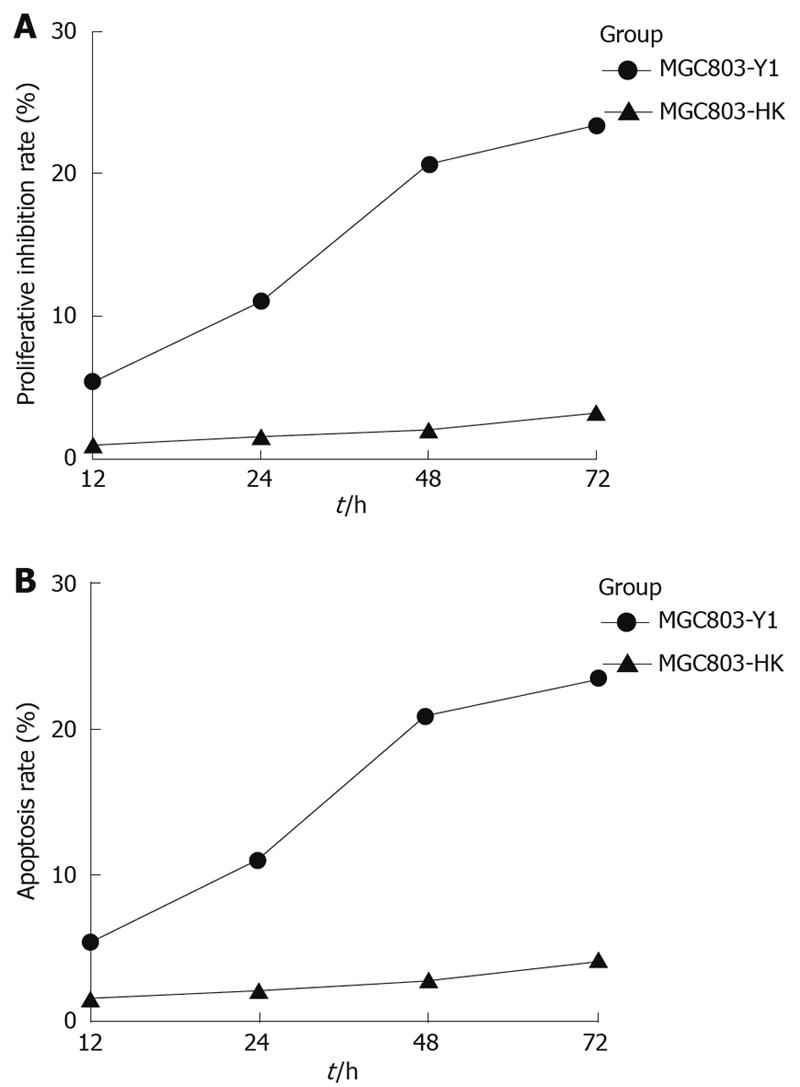
Figure 10 Proliferative inhibition and apoptosis rate of MGC803-Y1 and of MGC803-HK cells after transfection.
The proliferative inhibition (A) and apoptosis (B) rate of MGC803-Y1 cells was higher than that of MGC803-HK cells at 12-72 h after transfection.
- Citation: Ma XM, Yu H, Huai N. Peroxisome proliferator-activated receptor-γ is essential in the pathogenesis of gastric carcinoma. World J Gastroenterol 2009; 15(31): 3874-3883
- URL: https://www.wjgnet.com/1007-9327/full/v15/i31/3874.htm
- DOI: https://dx.doi.org/10.3748/wjg.15.3874


