Copyright
©2009 The WJG Press and Baishideng.
World J Gastroenterol. Jan 21, 2009; 15(3): 369-372
Published online Jan 21, 2009. doi: 10.3748/wjg.15.369
Published online Jan 21, 2009. doi: 10.3748/wjg.15.369
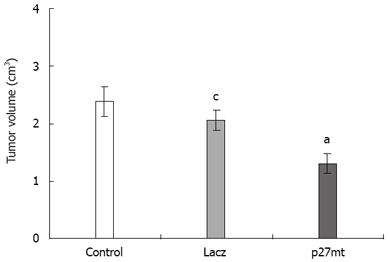
Figure 1 Comparison of transplanted tumor volume among different groups (cm3).
aP < 0.050 vs Ad-Lacz, cP > 0.05 vs control.
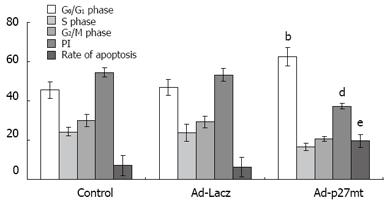
Figure 2 Comparison of status of cell cycle, PI and rate of apoptosis between different groups.
bP < 0.01 vs Ad-LacZ, dP <0.01 vs Ad-LacZ, eP < 0.01 vs Ad-LacZ.
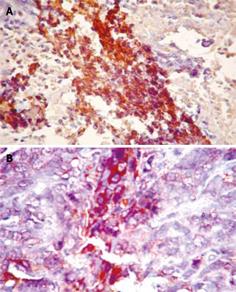
Figure 3 Expression of MMP-9 in the transplanted tumor.
A: control group; B: Ad-p27mt group.
-
Citation: Chen J, Ding WH, Lu GX, Xu SY. Impact of
p27mt gene on transplantation model of human colorectal cancer in nude mice. World J Gastroenterol 2009; 15(3): 369-372 - URL: https://www.wjgnet.com/1007-9327/full/v15/i3/369.htm
- DOI: https://dx.doi.org/10.3748/wjg.15.369


