Copyright
©2009 The WJG Press and Baishideng.
World J Gastroenterol. Jan 21, 2009; 15(3): 321-327
Published online Jan 21, 2009. doi: 10.3748/wjg.15.321
Published online Jan 21, 2009. doi: 10.3748/wjg.15.321
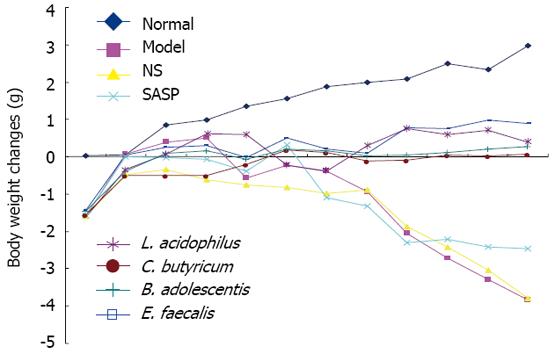
Figure 1 Body weight changes in all groups.
The body weight of mice on the 1st day was taken as the basal level. The body weight of mice each day minus the basal body weight was expressed as the body weight change. The negative value indicates the decreased weight, and the positive value indicates the increased weight.
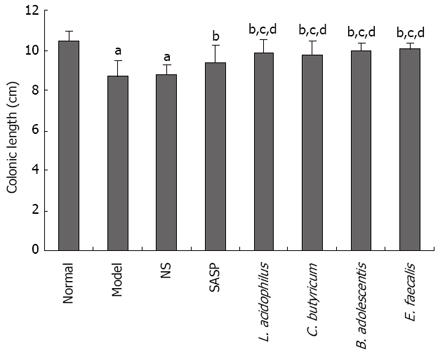
Figure 2 Length of colon on the 13th day.
aP < 0.05 vs normal group; bP < 0.05 vs model group; cP > 0.05 vs normal group; dP < 0.05 vs SASP treatment group.
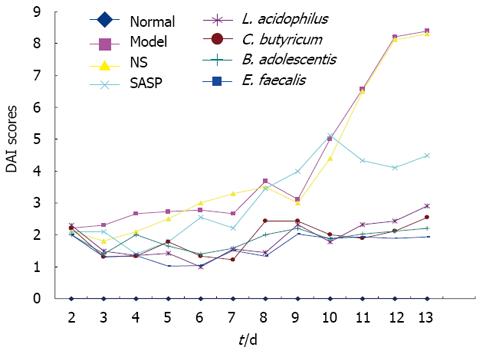
Figure 3 DAI scores of different groups.
The DAI score was zero in normal group. The score increased gradually and reached 8.6 on the 13th day in model group. The score was low in SASP treatment group during the first 8 d, increased gradually during the last 5 d and reached 5.0 on the 13th day. The DAI scores of all four strains of probiotics were low in probiotics treatment groups, especially in E. faecalis treatment group. The maximum DAI score was only 1.9.
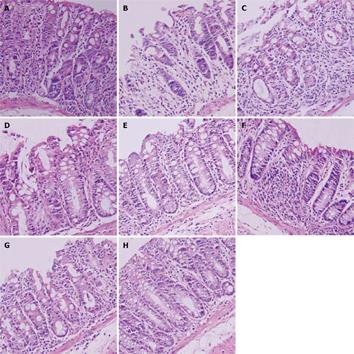
Figure 4 Histological images of mice.
A: Normal group; B: Model group; C: NS group; D: SASP treatment group, E: L. acidophilus treatment group, F: C. butyricum treatment group, G: B. adolescentis treatment group, H: E. faecalis treatment group ( HE, light microscope, x 200).
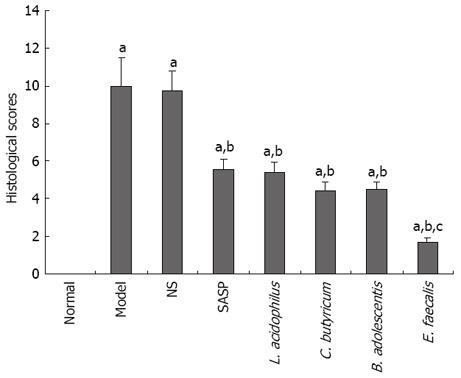
Figure 5 Histological scores of mice in different groups (mean ± SD, n = 10).
The histological score was zero in normal group was zero (aP < 0.0). The highest score was 9.9 ± 1.50 in model and NS groups (bP < 0.05). The score was different in E. faecalis and SASP treatment groups (cP < 0.05).
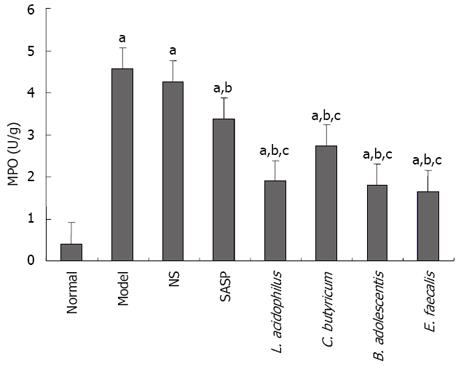
Figure 6 MPO activity in normal group (0.
399 ± 0.133 U/g compared with normal group, model group and SASP treatment group. aP < 0.05 vs normal group, bP < 0.05 vs model group, cP < 0.05 vs SASP treatment group.
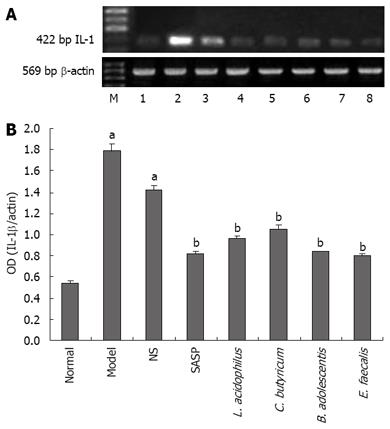
Figure 7 A-B Level of IL-1 βmRNA.
M: Marker; 1: Normal group; 2: Model group; 3: NS group; 4: SASP treatment group; 5: L. acidophilus treatment group; 6: C. butyricum treatment group; 7: B. adolescentis treatment group; 8: E. faecalis treatment group. aP < 0.05 vs normal group; bP < 0.05 vs model group.
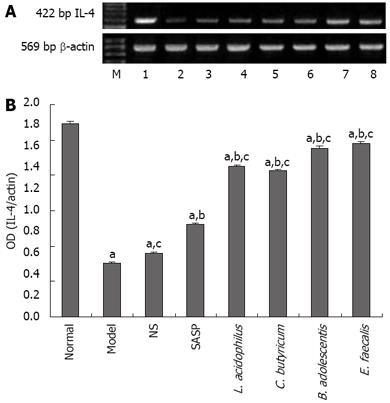
Figure 8 A-B Level of IL-4 mRNA.
M: Marker; 1: Normal group; 2: Model group; 3: NS group; 4: SASP treatment group; 5: L. acidophilus treatment group; 6: C. butyricum treatment group; 7: B. adolescentis treatment group; 8: E. faecalis treatment group. aP < 0.05 vs normal group; bP < 0.05 vs model group; cP < 0.05 vs SASP treatment group.
- Citation: Chen LL, Wang XH, Cui Y, Lian GH, Zhang J, Ouyang CH, Lu FG. Therapeutic effects of four strains of probiotics on experimental colitis in mice. World J Gastroenterol 2009; 15(3): 321-327
- URL: https://www.wjgnet.com/1007-9327/full/v15/i3/321.htm
- DOI: https://dx.doi.org/10.3748/wjg.15.321


