Copyright
©2009 The WJG Press and Baishideng.
World J Gastroenterol. Aug 7, 2009; 15(29): 3621-3630
Published online Aug 7, 2009. doi: 10.3748/wjg.15.3621
Published online Aug 7, 2009. doi: 10.3748/wjg.15.3621
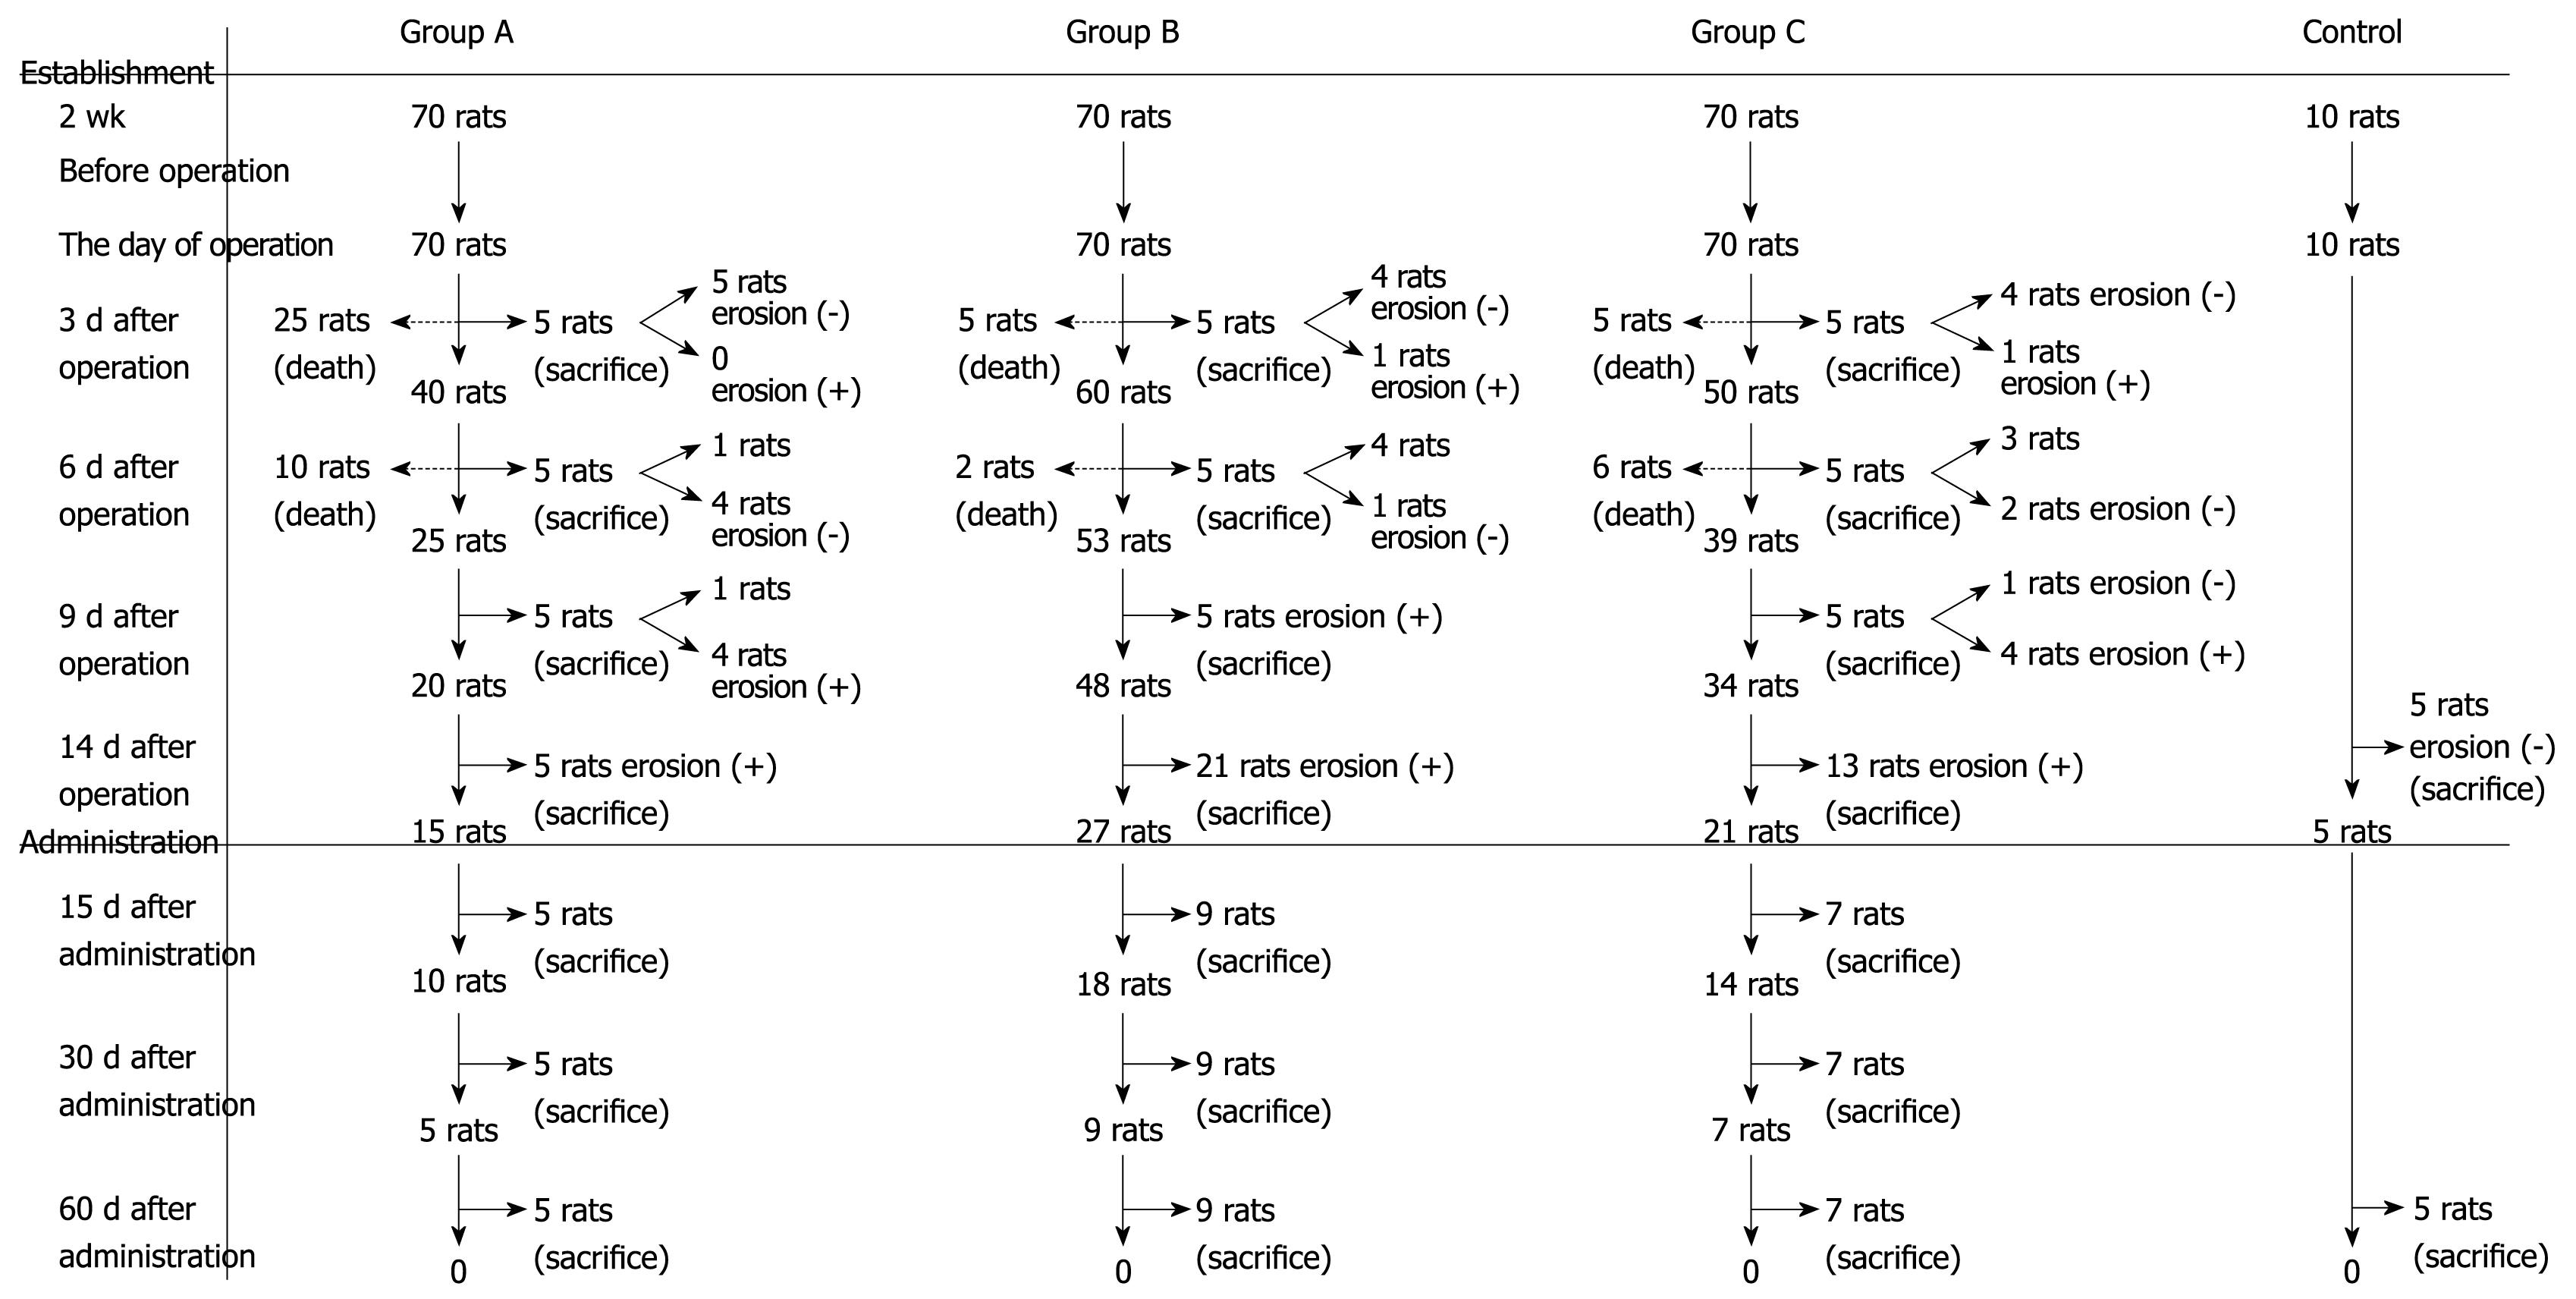
Figure 1 Procedure for the establishment of animal models in each group.
Control: Without treatment; A: Acid RE; B: Alkaline RE; C: Mixed RE.
Figure 2 Survival and incidence of RE.
The modeling details are described. RE incidence rate was 100% 2 wk after treatment and rat survival rate was 50% (n = 35/70) in group A, 90% (n = 63/70) in group B and 70% (n = 49/70) in group C.
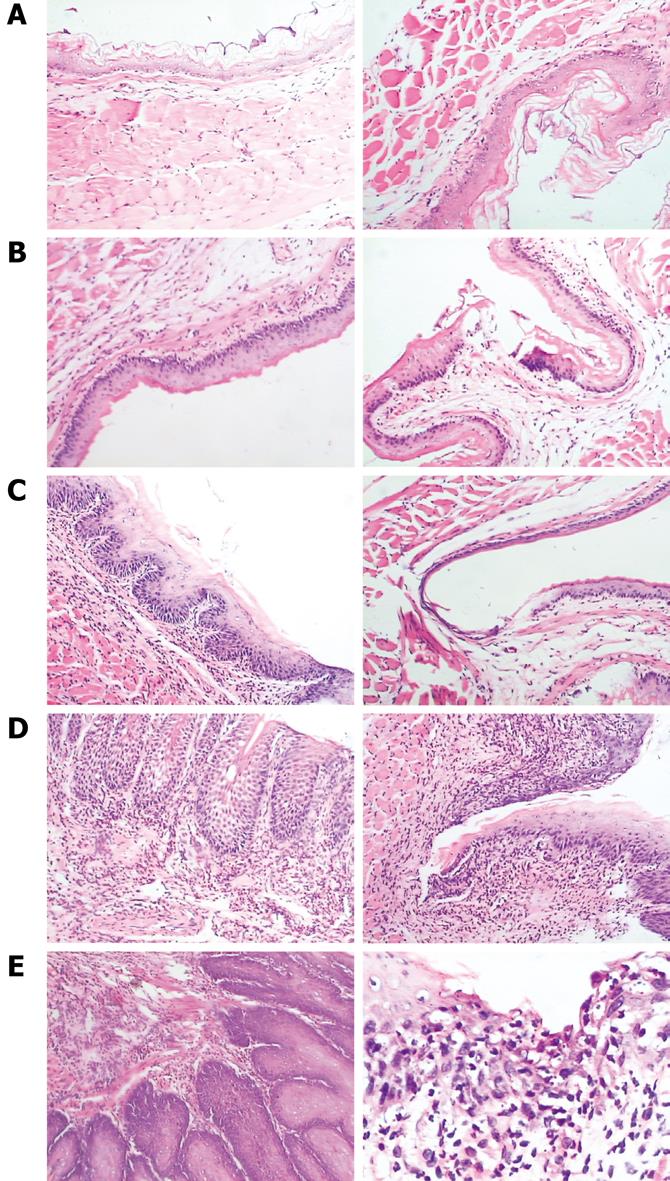
Figure 3 Histological findings of control esophagus and chronic reflux esophagitis (× 100).
A: Normal mucosa; B: At day 3 after operation; C: At day 6 after operation; D: At day 9 after operation; E: at day 14 after operation. B-E (left): Basal cell hyperplasia became severe along with the reflux time; B-E (right): Epithelial mucosa ulcer became severe along with the reflux time.
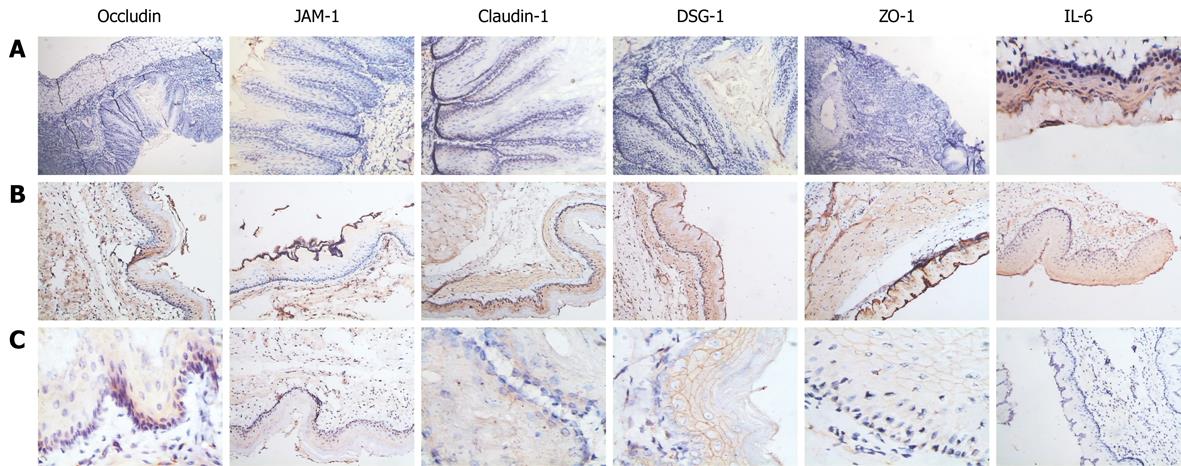
Figure 4 Immunostaining for occludin, JAM-1, claudin-1, DSG-1, ZO-1, IL-6 in controls and reflux esophagitis model (× 400).
A: Protein expression on day 14 in chronic RE model; B: Protein expression on day3 in chronic RE model; C: Protein expression on day 14 in control esophagus.
Figure 5 HE and immunostaining (× 40).
A: HE; B: DSG-1; C: Claudin-1; D: ZO-1, E: JAM-1. Hyperplasia and vesicles could be seen, but expression of these proteins was significantly lower in individual cells as compared to control group.
Figure 6 Transmission electron microscopy.
A: Normal; B: 14 d after operation; C: A model of 60 d after aluminium phosphate administration; D: B model of 60 d after aluminium phosphate administration.
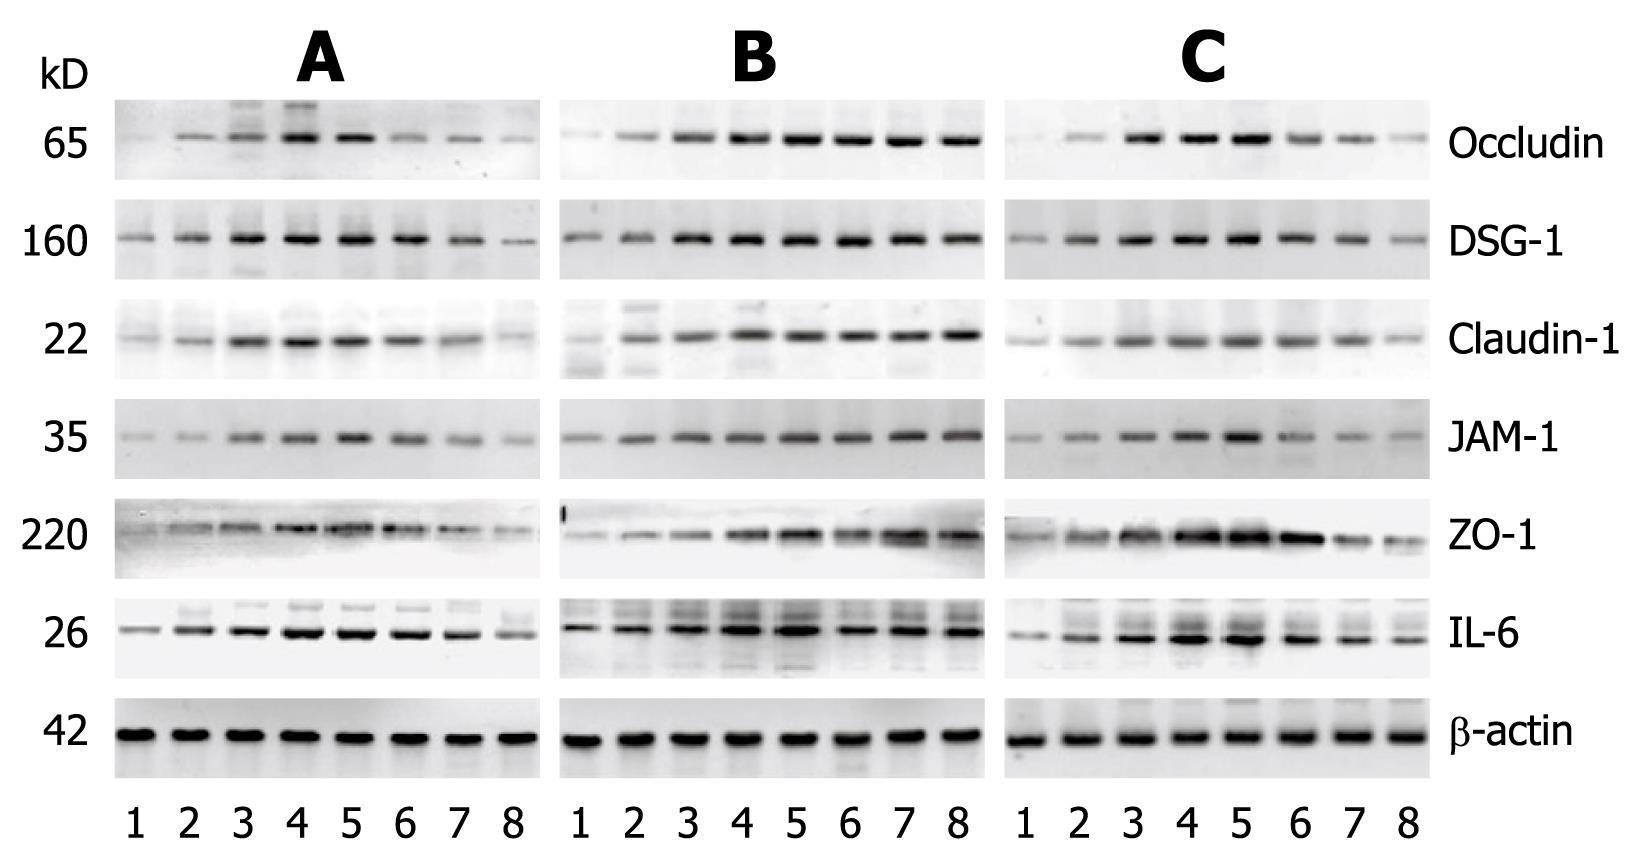
Figure 7 Western blotting.
A: Model GER (acid reflux esophagitis); B: Model DER (alkaline reflux esophagitis); C: Model DG-ER (mixed reflux esophagitis). 1: Samples from control rats (n = 5); 2-8: Samples from rats with 3, 6, 9, 14, 15, 30 and 60 d after operation (n = 5).
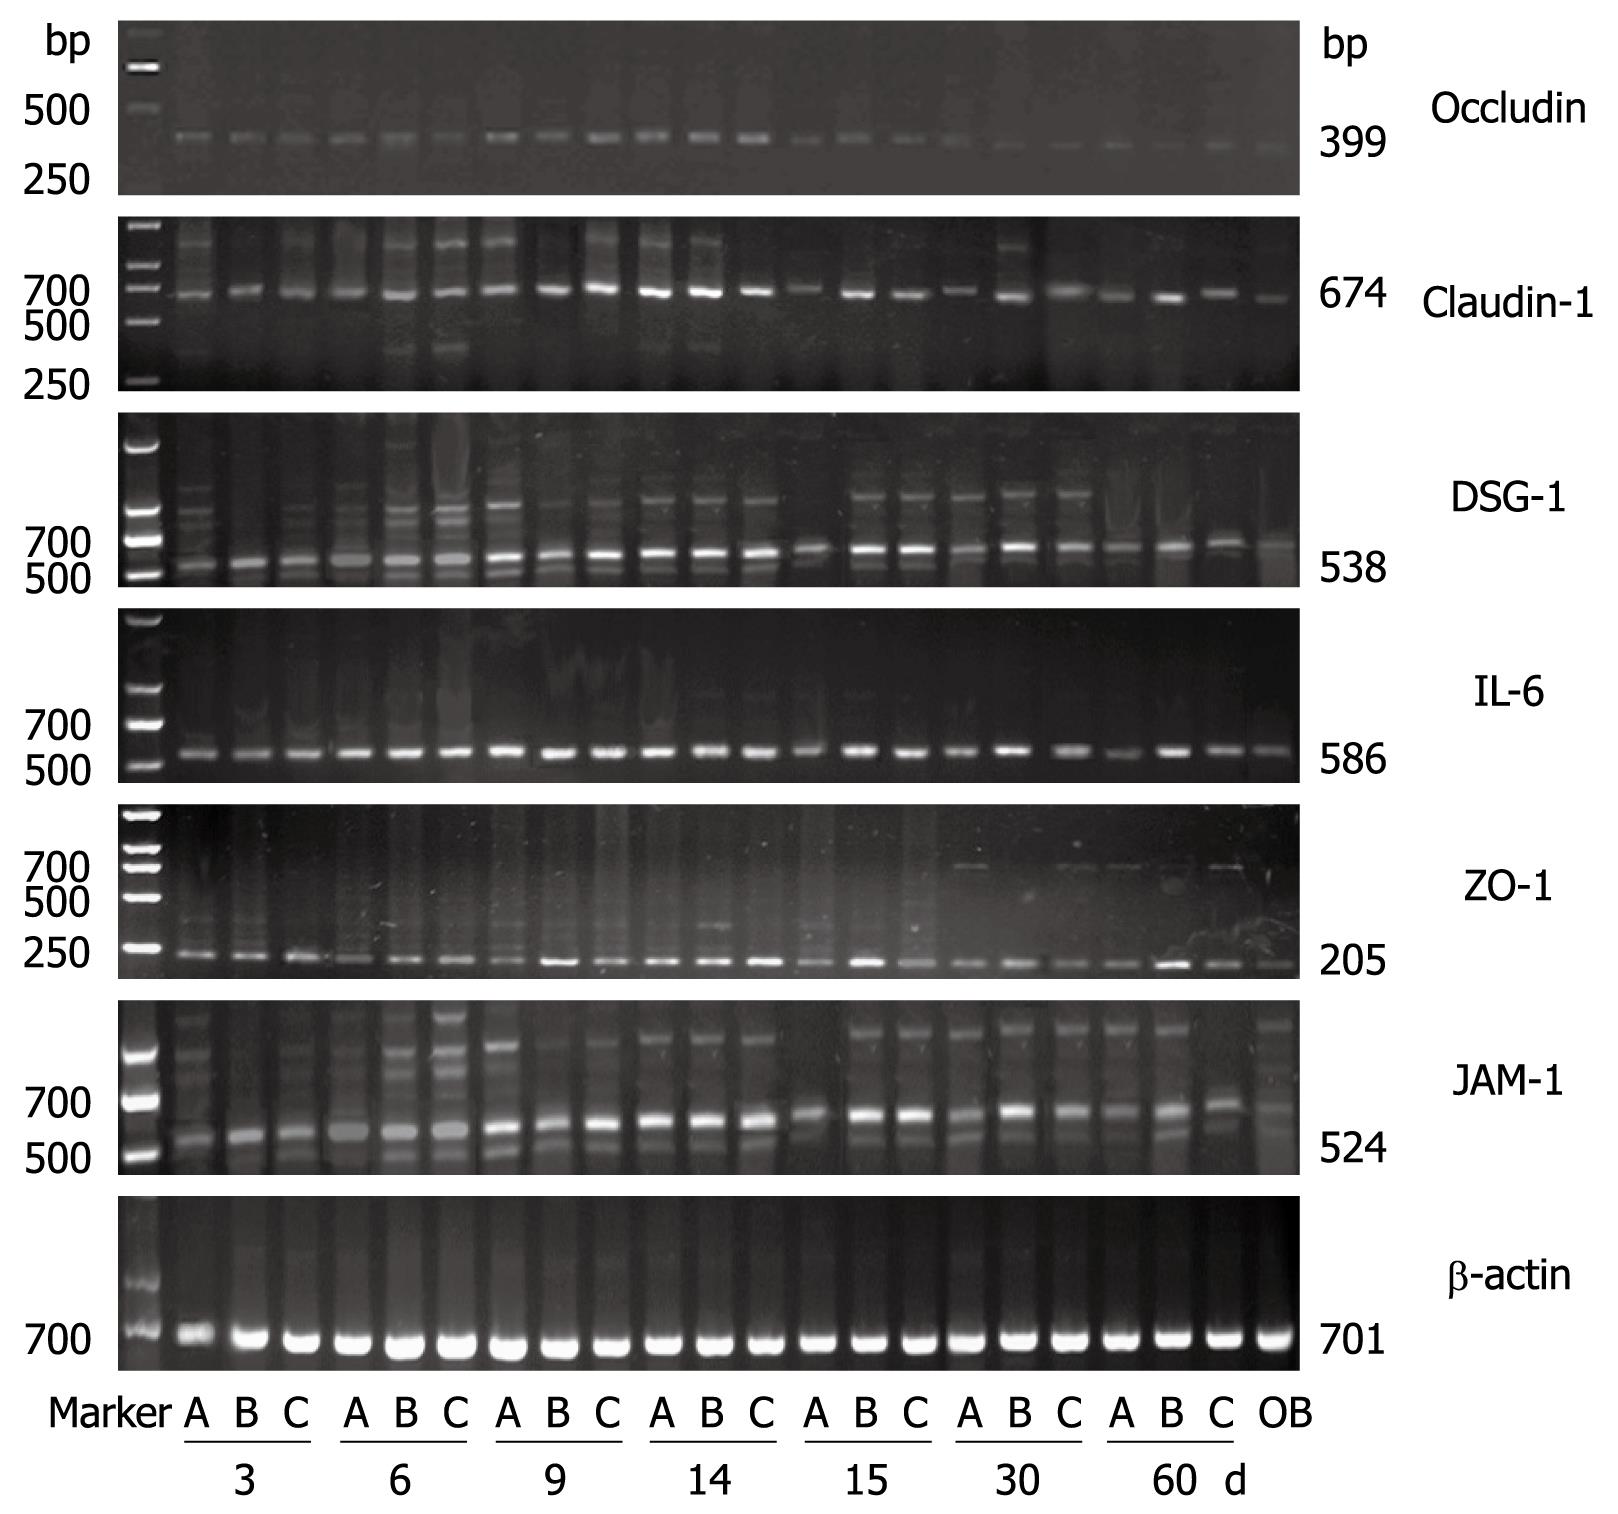
Figure 8 RT-PCR.
Samples from rats with 3, 6, 9, 14, 15, 30 and 60 d after operation. A: GER model; B: DER model; C: DG-ER model; OB: Samples from control rats (n = 5).
- Citation: Li FY, Li Y. Interleukin-6, desmosome and tight junction protein expression levels in reflux esophagitis-affected mucosa. World J Gastroenterol 2009; 15(29): 3621-3630
- URL: https://www.wjgnet.com/1007-9327/full/v15/i29/3621.htm
- DOI: https://dx.doi.org/10.3748/wjg.15.3621


