Copyright
©2009 The WJG Press and Baishideng.
World J Gastroenterol. Aug 7, 2009; 15(29): 3611-3620
Published online Aug 7, 2009. doi: 10.3748/wjg.15.3611
Published online Aug 7, 2009. doi: 10.3748/wjg.15.3611
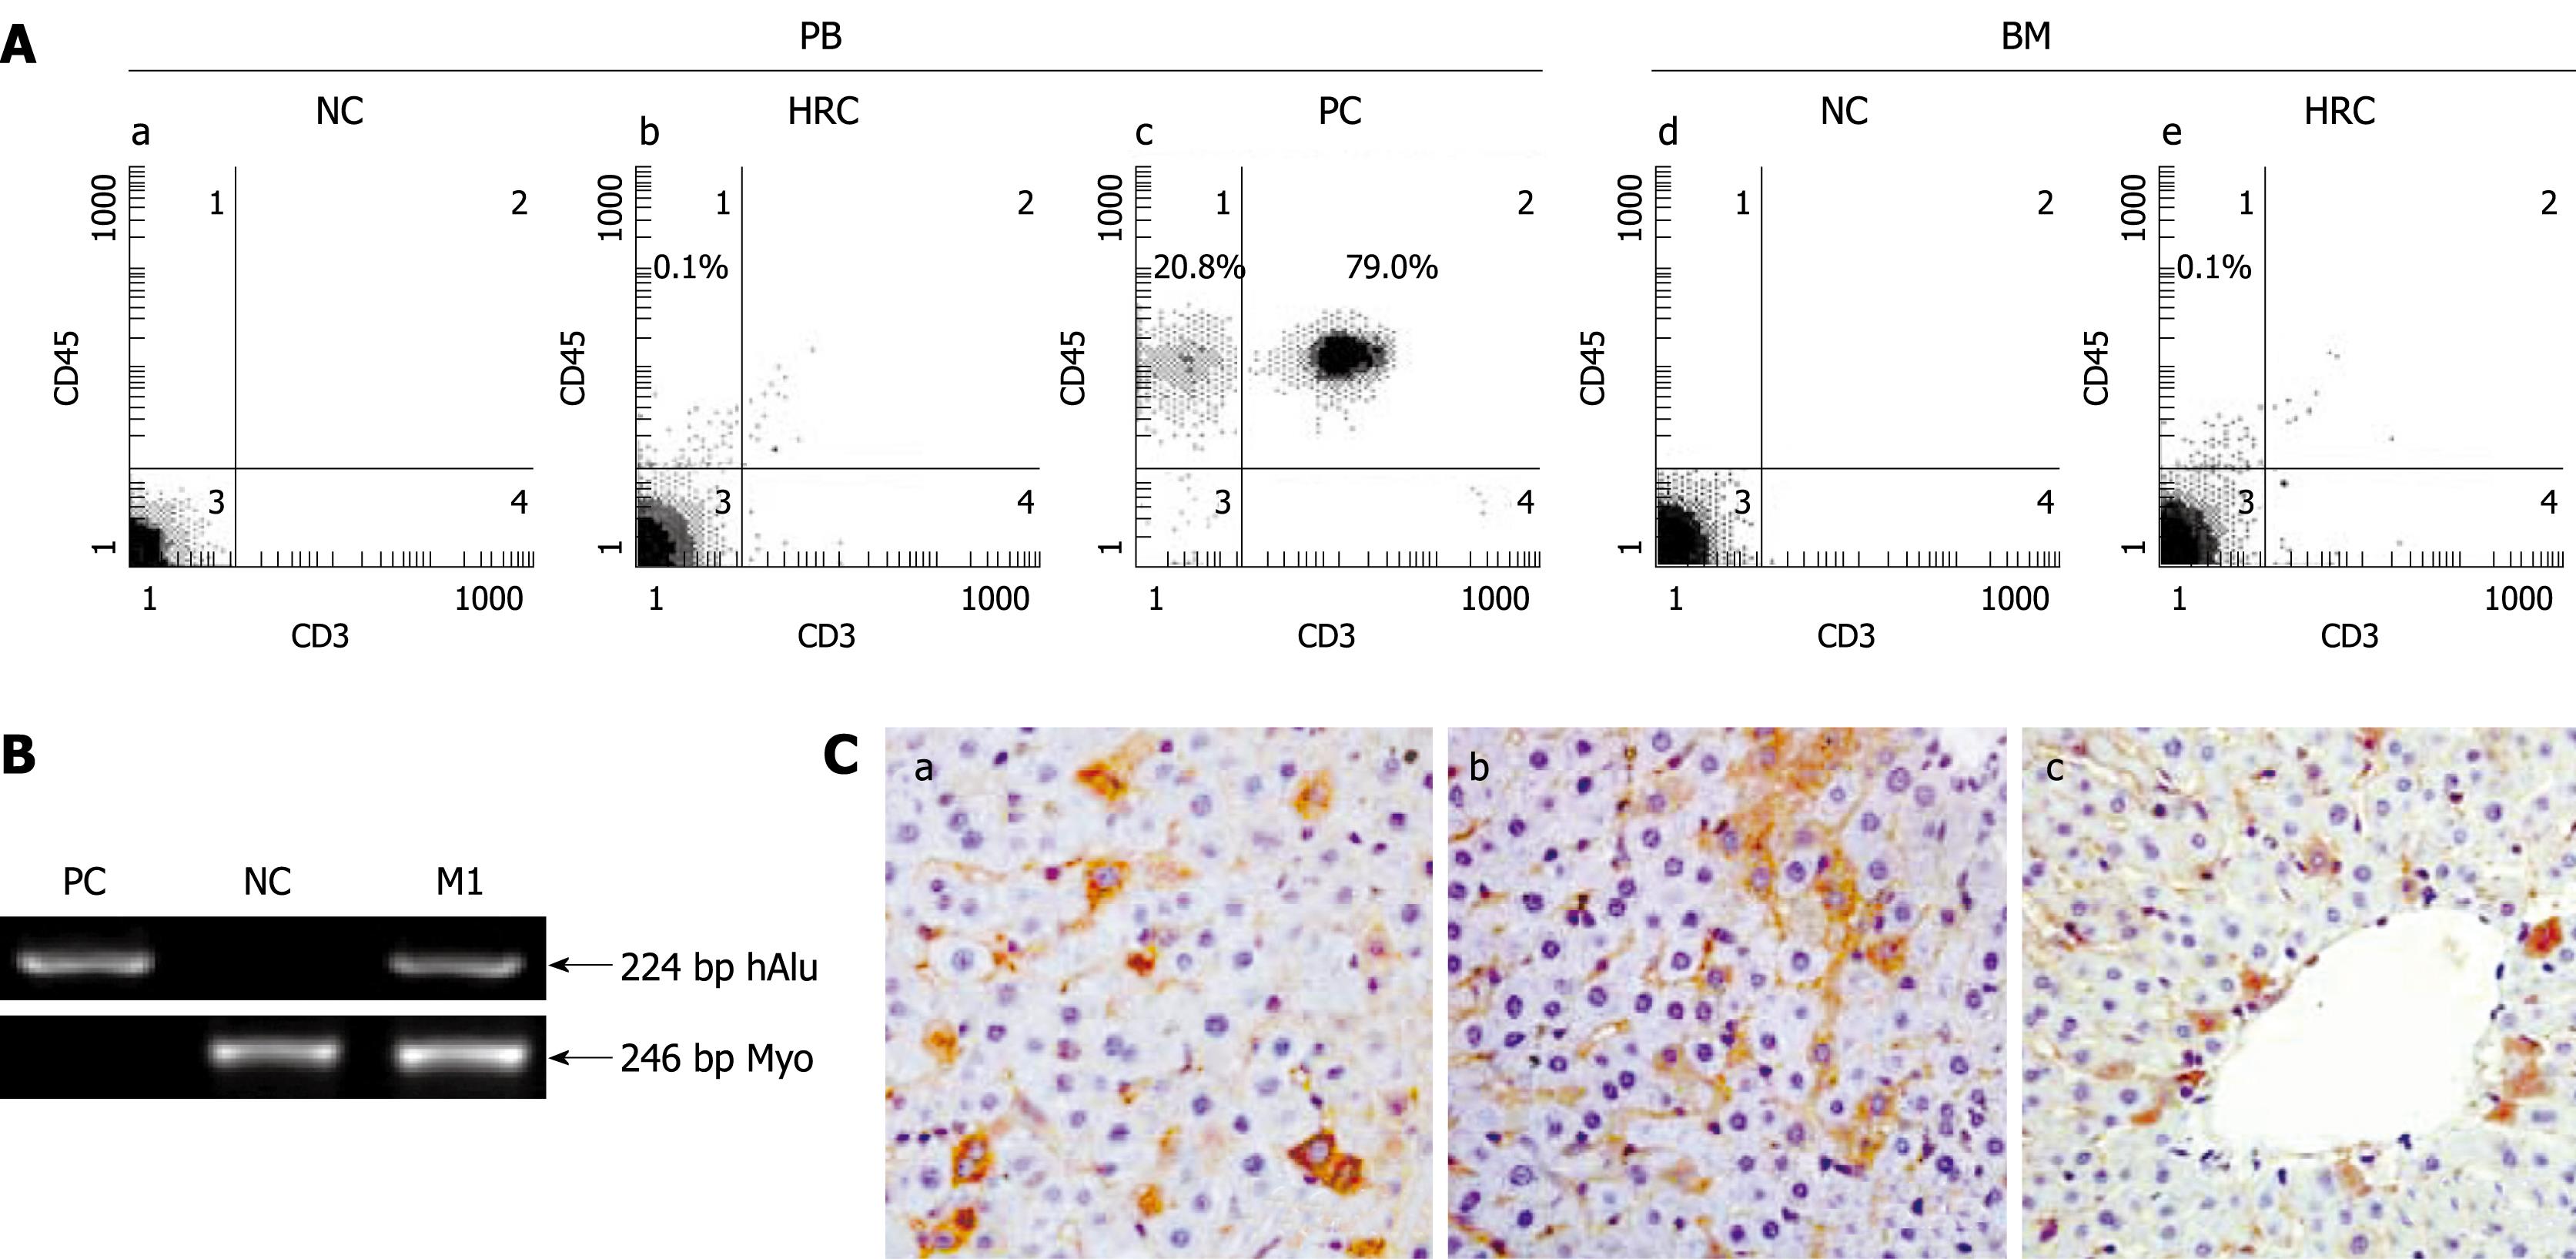
Figure 1 Screening for human-rat chimera (HRC) derived from in utero transplantation of hUCB-MNCs.
Human-rat hybrid animals were produced by in utero transplantation of low-density mononuclear cells (MNCs) from human umbilical cord blood (hUCB) into fetal rats at the gestation of 9-11 d. A: Representative flow cytometric analysis of human CD45-positive cell engraftment in PB and BM of HRC. After birth, peripheral blood (PB) was collected at the indicated time points. The collected blood cells were stained with anti-human CD45 and CD3 antibodies and analyzed by flow cytometry. MNC-transplanted rat (MTR) was killed at end of each experiment, with bone morrow (BM) obtained and assessed for human CD45+ cell engraftment by 2-color flow cytometry. Human PB from healthy volunteers was used as a positive control (PC) and normal rat PB was used a negative control (NC); B: Identification of human genes in liver of MTR by human gene-specific PCR. To determine the human donor contribution in the liver of MTR, PCR was carried out on genomic DNA with primers specific for hAlu gene[19]. The PCR products were analyzed by agarose gel electrophoresis from positive-control human blood genomic DNA (lane PC), normal/non-transplanted rat genomic DNA (lane NC) and genomic DNA prepared from liver of one MTR was shown. Rat myogenin (Myo)-specific PCR was carried out for quality and quantity controls of genomic DNA with primers specific for rat Myo gene[19]. Data are representative of three independent PCRs yielding similar results. Arrow indicates the position of PCR products amplified by the primers for hAlu[19]. M1: Molecular weight DNA marker (DL2000, TaKaRa); C: Immunohistochemical analysis of various human antigens in liver of MTR. In the receipt liver, donor-derived human cells with different cellular phenotypes were detected by IHC for different human markers, such as β2-microglobulin [β2-M (a), CK18 (b) and CK19 (c)]. Brown staining shows positive human cells in various tissues from MTR and human samples (data not shown), whereas no positive human cells were found in normal control (NC) rats (data not shown).
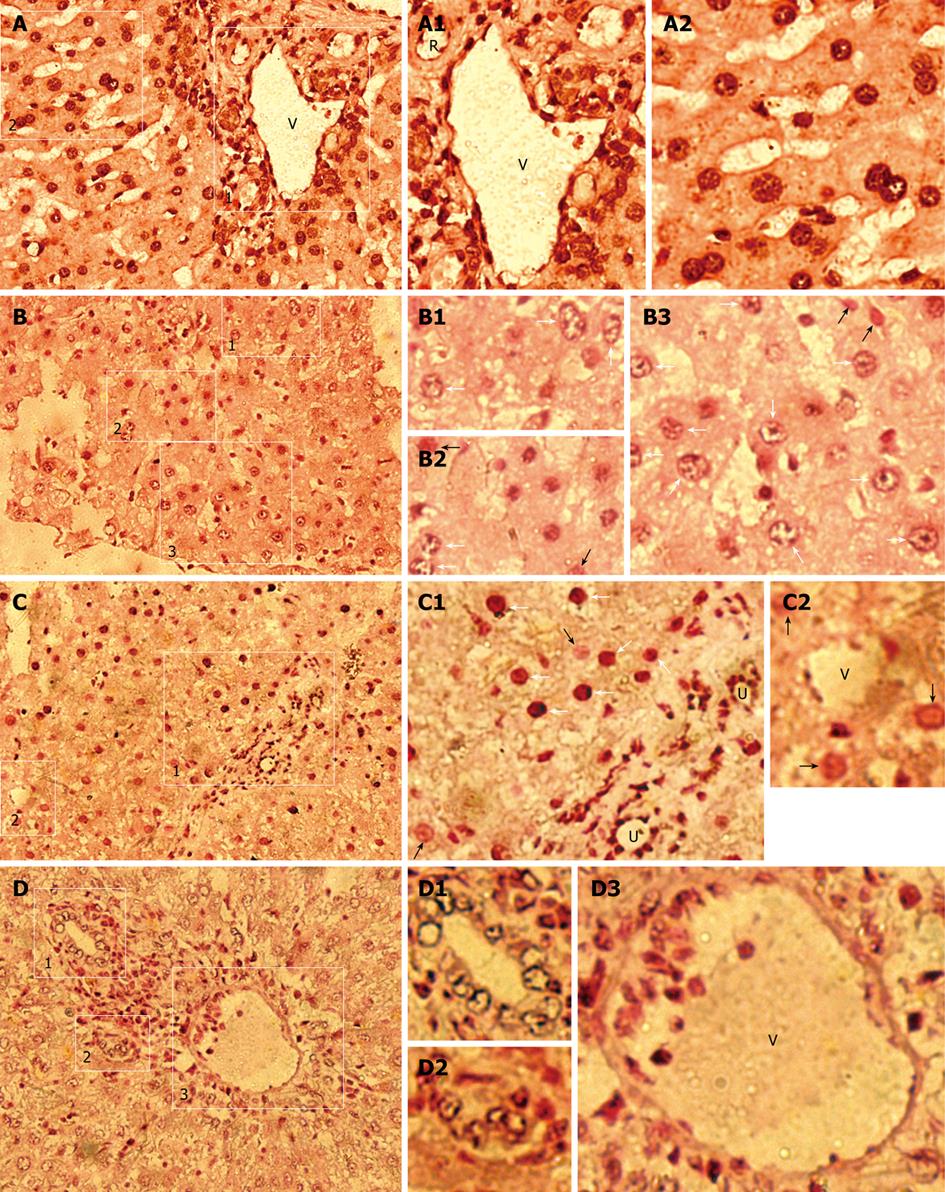
Figure 2 Human donor contributions in HRC liver analyzed by in situ hybridization (ISH) for human Alu sequences.
Black/dark brown Alu-positive human cells in nuclei (white arrow) were identified in receipt liver using a probe specific for human DNA Alu sequences, and counterstained (pink) with nuclear fast red. Black/dark brown hybridization signals (white arrow) shows Alu-positive human cells in liver of MTR and human samples, whereas no Alu-positive human cells were found in normal control (NC) rats (data not shown). White arrow and black arrow indicate the partially demonstrated Alu-positive and negative human cells in B1-B3, C1 and C2, respectively. A: Human liver (positive control); B-D: Detection of donor-derived human cells in the chimeric liver of HRC. R: Artery; U: Bile duct; V: Vein. A: Low-power magnification of hAlu-positive human cells; A1: High-power magnification of the region (1) in the right rectangle of (A) demonstrating hAlu-positive vein (V) containing hAlu-positive human endothelial cell-like cells (hECLs), hAlu-positive artery (R) containing hAlu-positive human cells, and hAlu-positive human hepatocytes and other human cells in human liver; A2: High-power magnification of the region (2) in the left rectangle of (A), hAlu-positive human hepatocytes and other human cells in human liver; B: Low-power magnification of hAlu-positive human cells; B1: High-power magnification of hAlu-positive human cells (white arrow) of the rectangle region (1) in (B); B2: High-power magnification of hAlu-positive human cells (white arrow) and hAlu-negative cells (white arrowhead) of the rectangle region (2) in (B); B3: High-power magnification of hAlu-positive human cells (white arrow) and hAlu-negative cells (white arrowhead) of the rectangle region (3) in (B); C: Low-power magnification of hAlu-positive human cells; C1: High-power magnification of the rectangle region (1) in (C) showing hAlu-positive human hepatocyte-like cells (hHLCs) (white arrow), hAlu-positive bile duct (U) epithelial cells and other human cells (white arrow) in chimeric liver; C2: High-power magnification of the rectangle region (2) in (C) showing hAlu-positive hECLs in vein (V) of chimeric liver; D: Low-power magnification of hAlu-positive small bile ducts (U) and hAlu-positive vein (V) in chimeric liver; D1, D2: High-power magnification of hAlu-positive small bile ducts (U) in (1, 2) of (D), respectively; D3: High-power magnification of vein (V) containing hAlu-positive hECLs in (3) of (D).
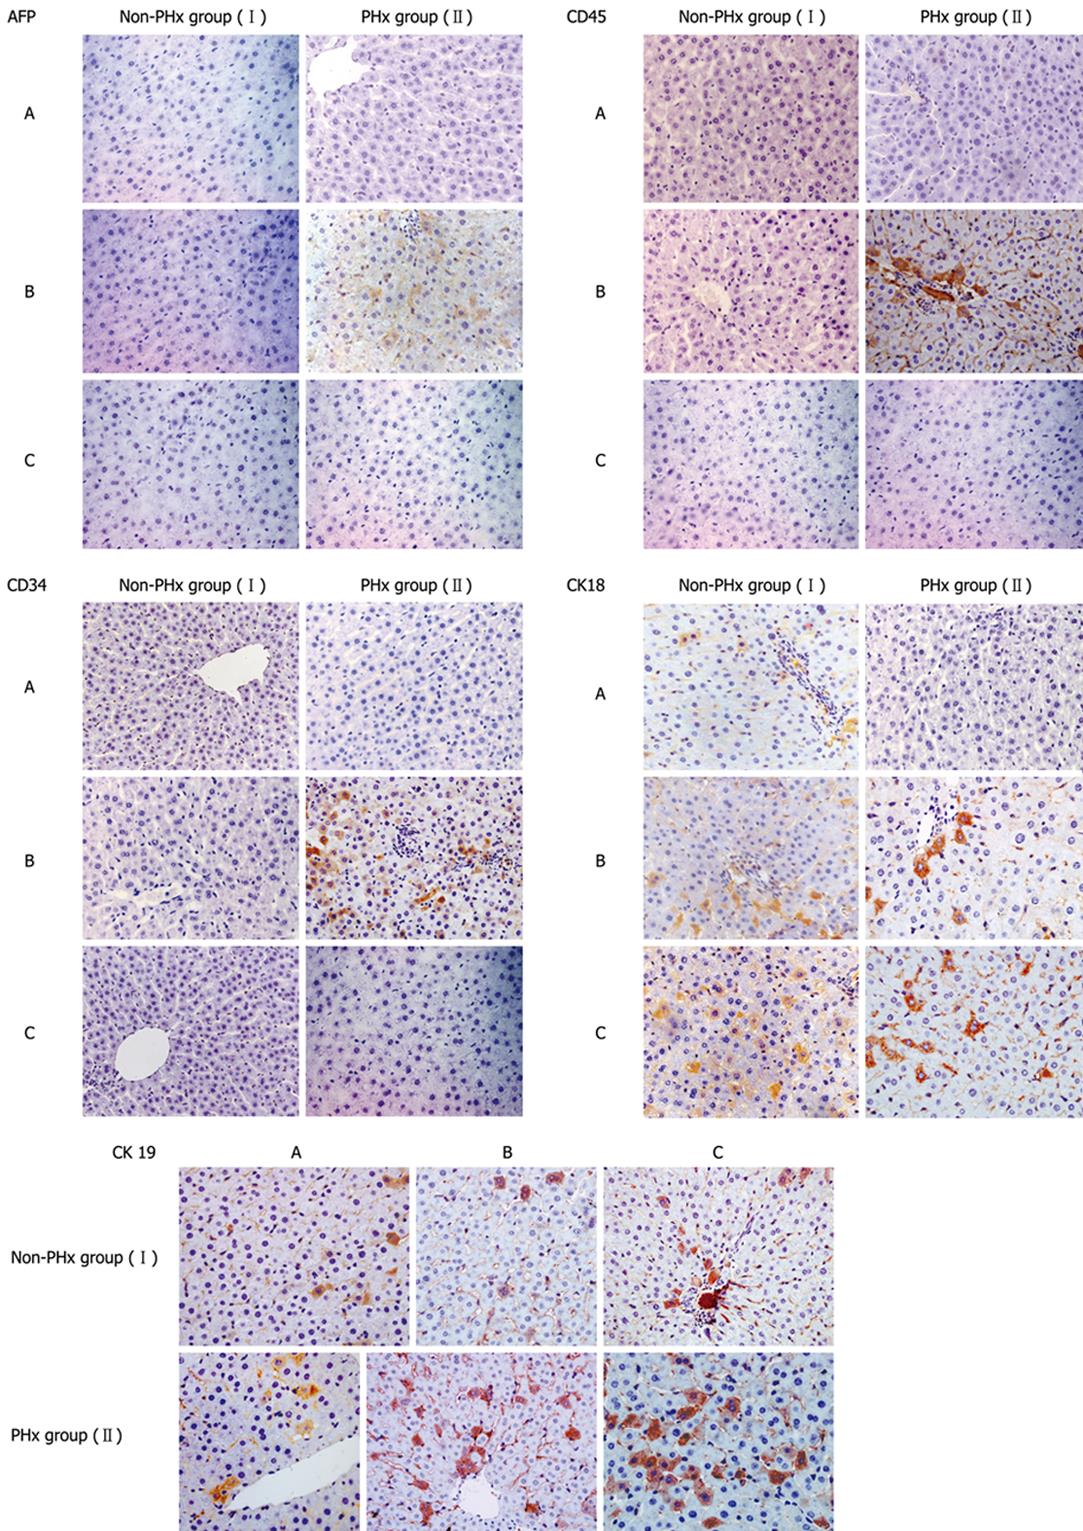
Figure 3 Representative immunohistochemistric analysis of phenotypic changes of donor-derived human cells in HRC liver during PHx-induced liver regeneration.
Seventy percent partial hepatectomy (PHx), a procedure that removes 70% of the liver, is regarded as the preferred in vivo method to study liver growth due to its synchronized growth response. In the representative chimeric livers of animals 5 and 6 (Table 1), donor-derived human cells with different cellular phenotypes were detected by IHC for different human markers (AFP, CD34, CD45, CK18 and CK19). Minimal liver tissues used for IHC were collected before PHx, and after 10 and 20 d of PHx. Additionally, the untransplanted control group was also set up when we performed this experiment (data not shown). The results demonstrate that CD45+, CK18+, AFP+, CD34+ and CK19+ cells could not be detected in liver sections from untransplanted control rats by human-specific IHC, suggesting that human-specific IHC can show human specificity of staining (data not shown). PHx: 70% partial hepatectomy, I: Non-PHx group; II: PHx group. A: before PHx; B: 10 d after PHx; C: 20 d after PHx.
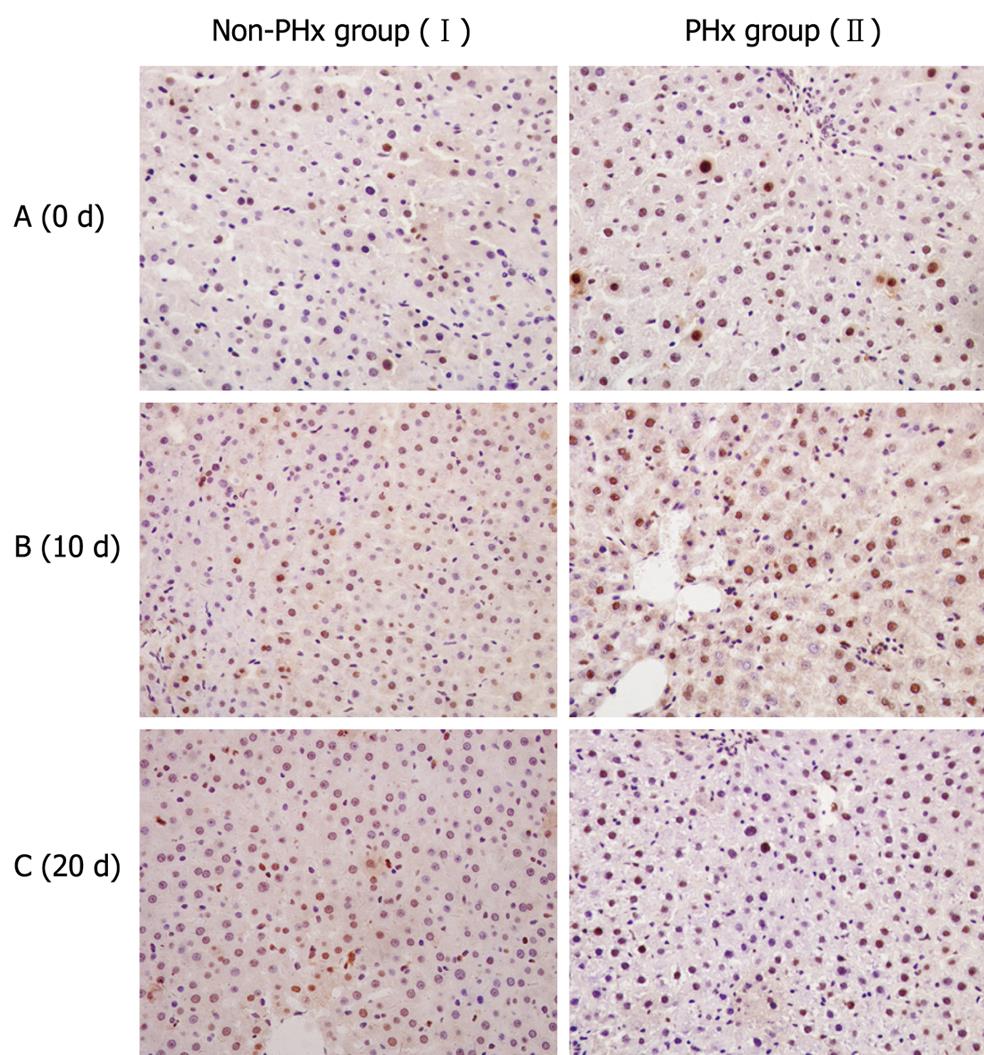
Figure 4 Proliferative activities of hHLCs during PHx-induced liver regeneration in HRC.
Immunostaining for PCNA, a marker for cell proliferation, was performed to evaluate the proliferation of hHLCs. An antibody against PCNA antigen was used to evaluate the percentage of hepatocytes in the regenerative process after 70% hepatectomy. Ten days after PHx, PCNA staining demonstrated the active proliferation of hHLCs in the PHx group (II) compared with the control group (I).
- Citation: Sun Y, Xiao D, Li HA, Jiang JF, Li Q, Zhang RS, Chen XG. Phenotypic changes of human cells in human-rat liver during partial hepatectomy-induced regeneration. World J Gastroenterol 2009; 15(29): 3611-3620
- URL: https://www.wjgnet.com/1007-9327/full/v15/i29/3611.htm
- DOI: https://dx.doi.org/10.3748/wjg.15.3611


